核心发现
肿瘤胎儿样状态在早期侵袭前沿出现,成纤维细胞及其信号参与这一状态的诱导。 TGFβ 与前列腺素共同刺激能够增强 EMP1 相关状态;状态标记的出现并不意味着病灶必然发生转移(PDF 第 2–3、6–8 页)。
研究设计
| 环节 | 模型与技术 | 研究问题 |
|---|---|---|
| 区域定位 | GeoMx、组织芯片、单细胞与 CosMx | 肿瘤核心与侵袭前沿有哪些差异? |
| 遗传与状态 | 配对区域类器官、部分样本 WGS | 前沿表型是否伴随新增已知驱动? |
| 功能验证 | 成纤维细胞共培养、Transwell、EMP1 报告器 | 局部信号能否诱导胎儿样状态? |
| 浸润阶段 | 不同浸润深度病例的空间分析 | 肿瘤细胞状态与 CAF 如何共同变化? |
研究设计:PDF 第 2–9、12–15 页。
发现一:侵袭前沿提前出现胎儿样程序
早期病灶的空间分析显示,肿瘤核心与侵袭前沿的细胞状态不同。前沿区域出现 HRC/oncofetal 相关特征,组织队列进一步验证了 LAMC2 与基质标记的分布(PDF 第 2–3 页)。
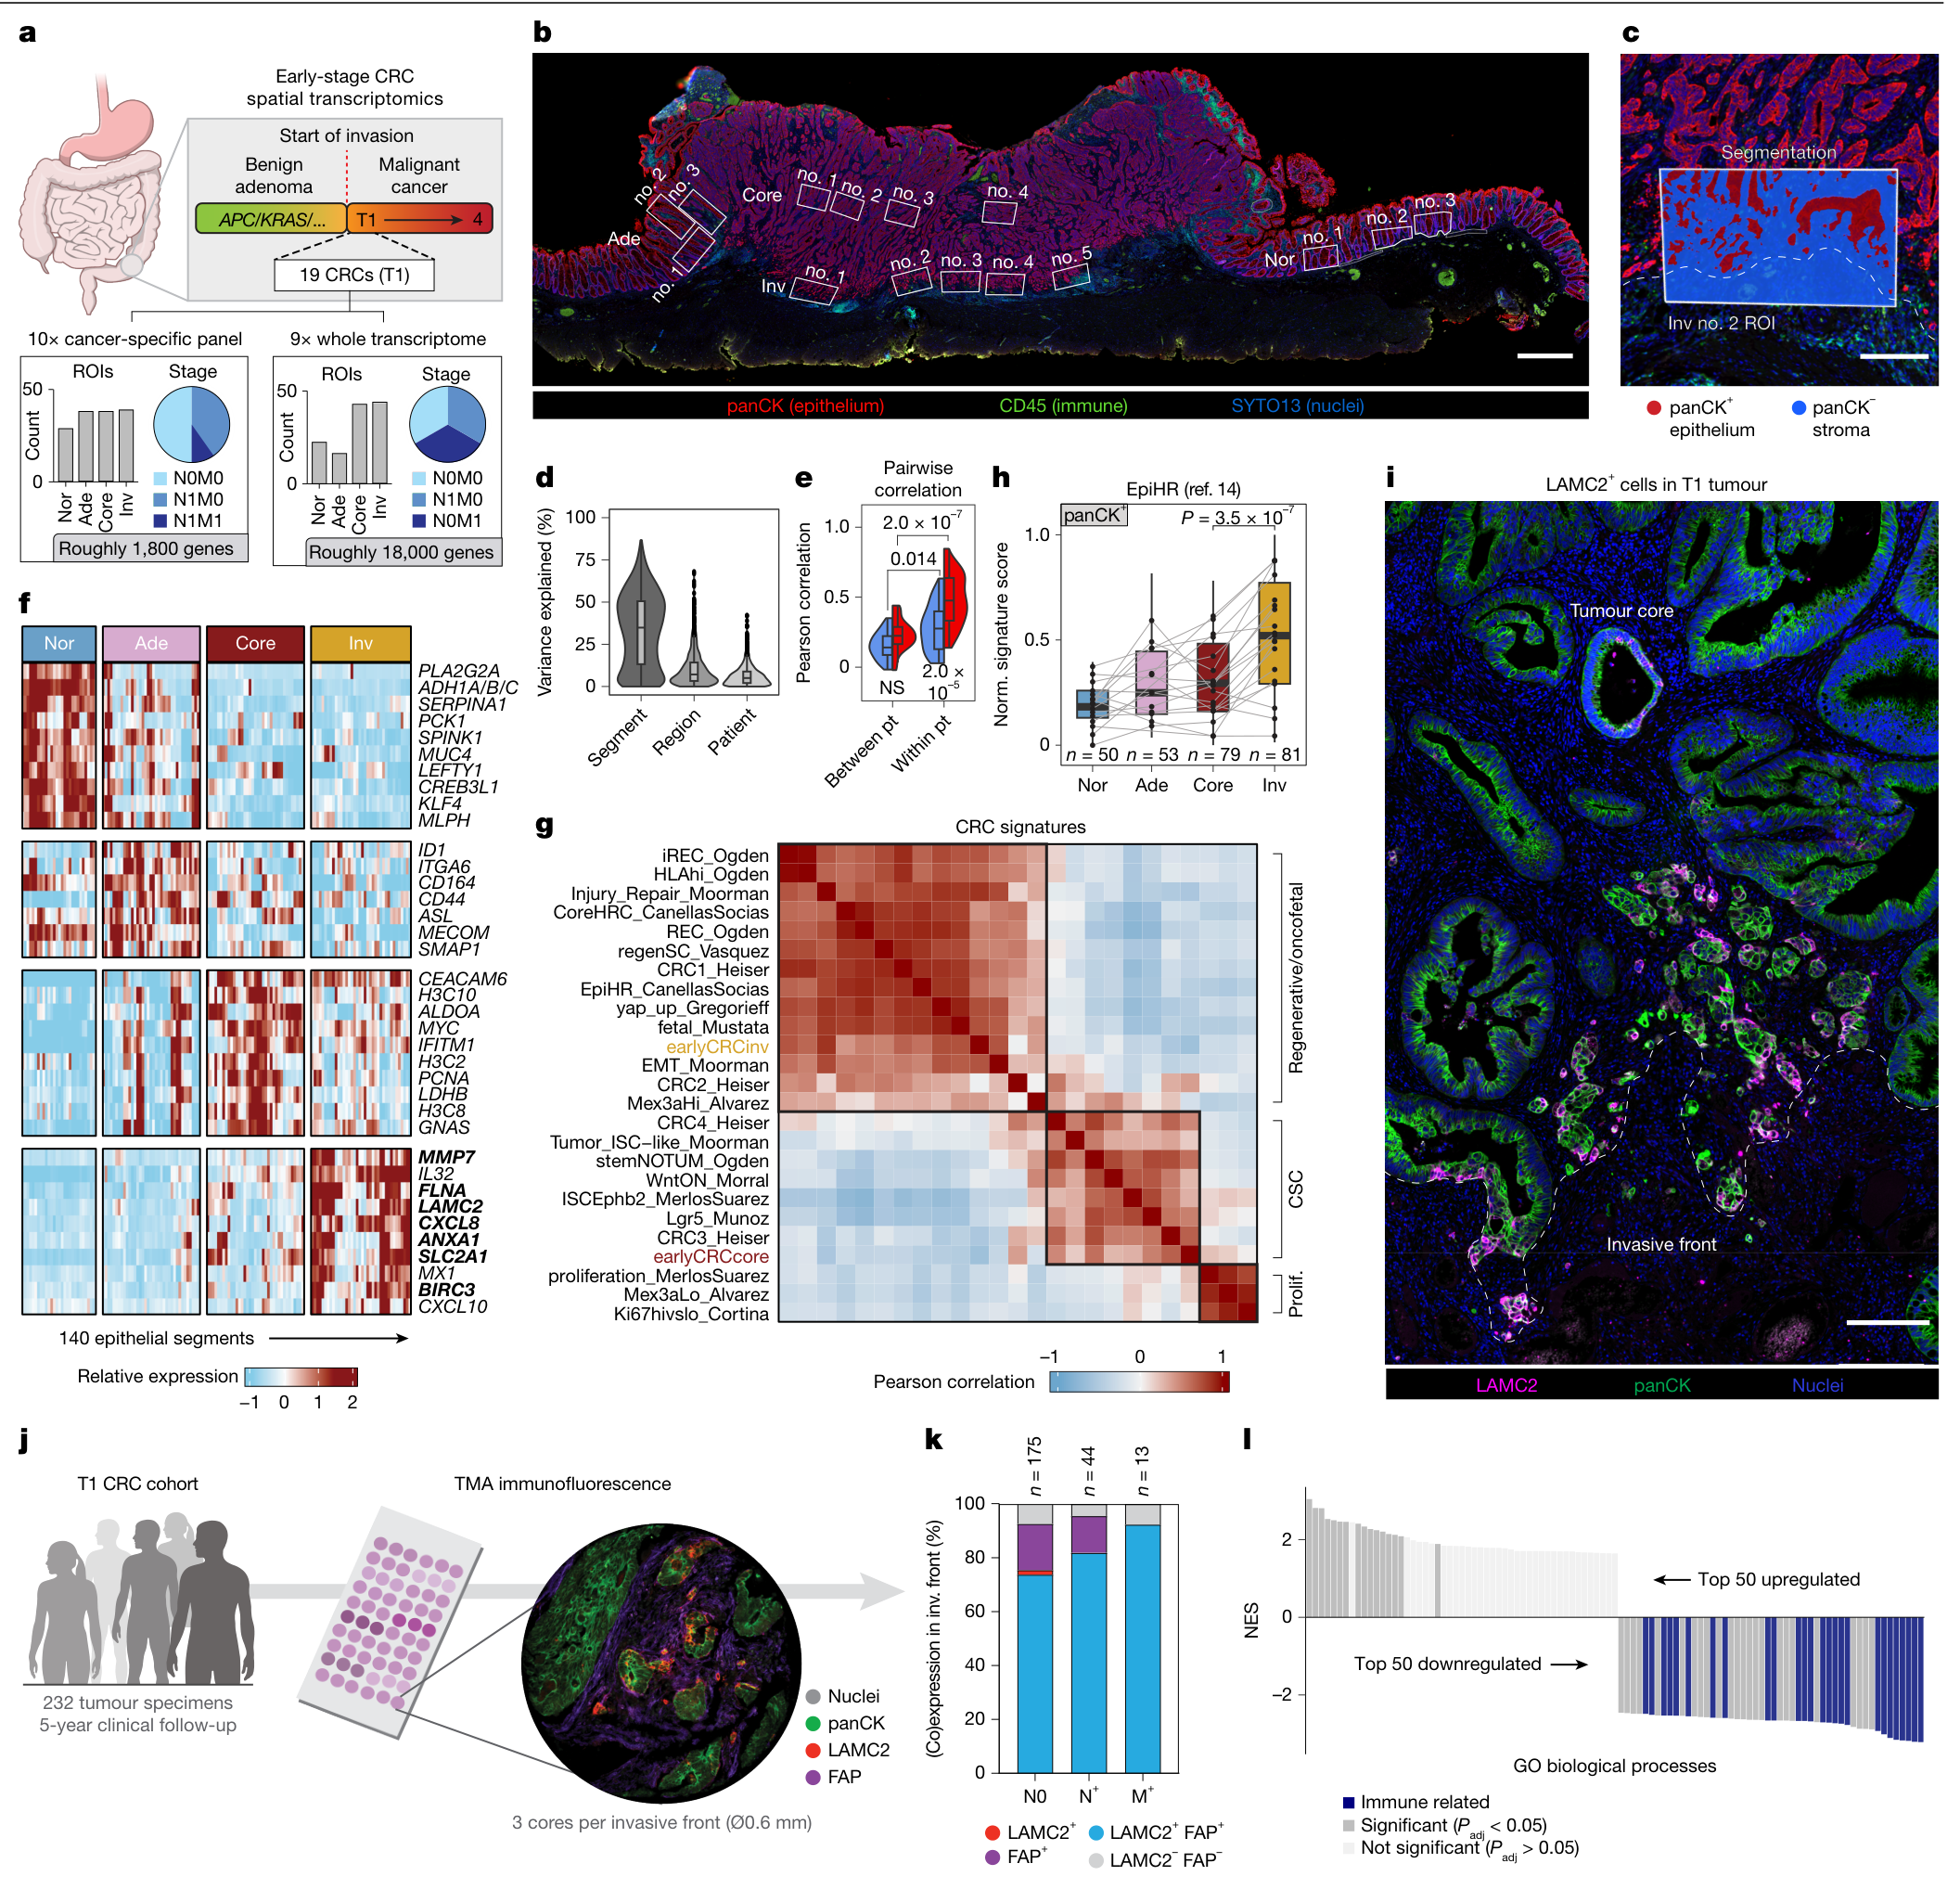
图 1 · 早期病灶的空间状态。原文 PDF 第 3 页。
发现二:区域类器官指向环境影响
研究建立了来自 16 位患者的区域类器官库,并对部分样本进行 WGS。前沿相对核心未发现新增已识别驱动,结合体外状态变化,支持局部环境参与表型形成(PDF 第 2、4–5 页)。
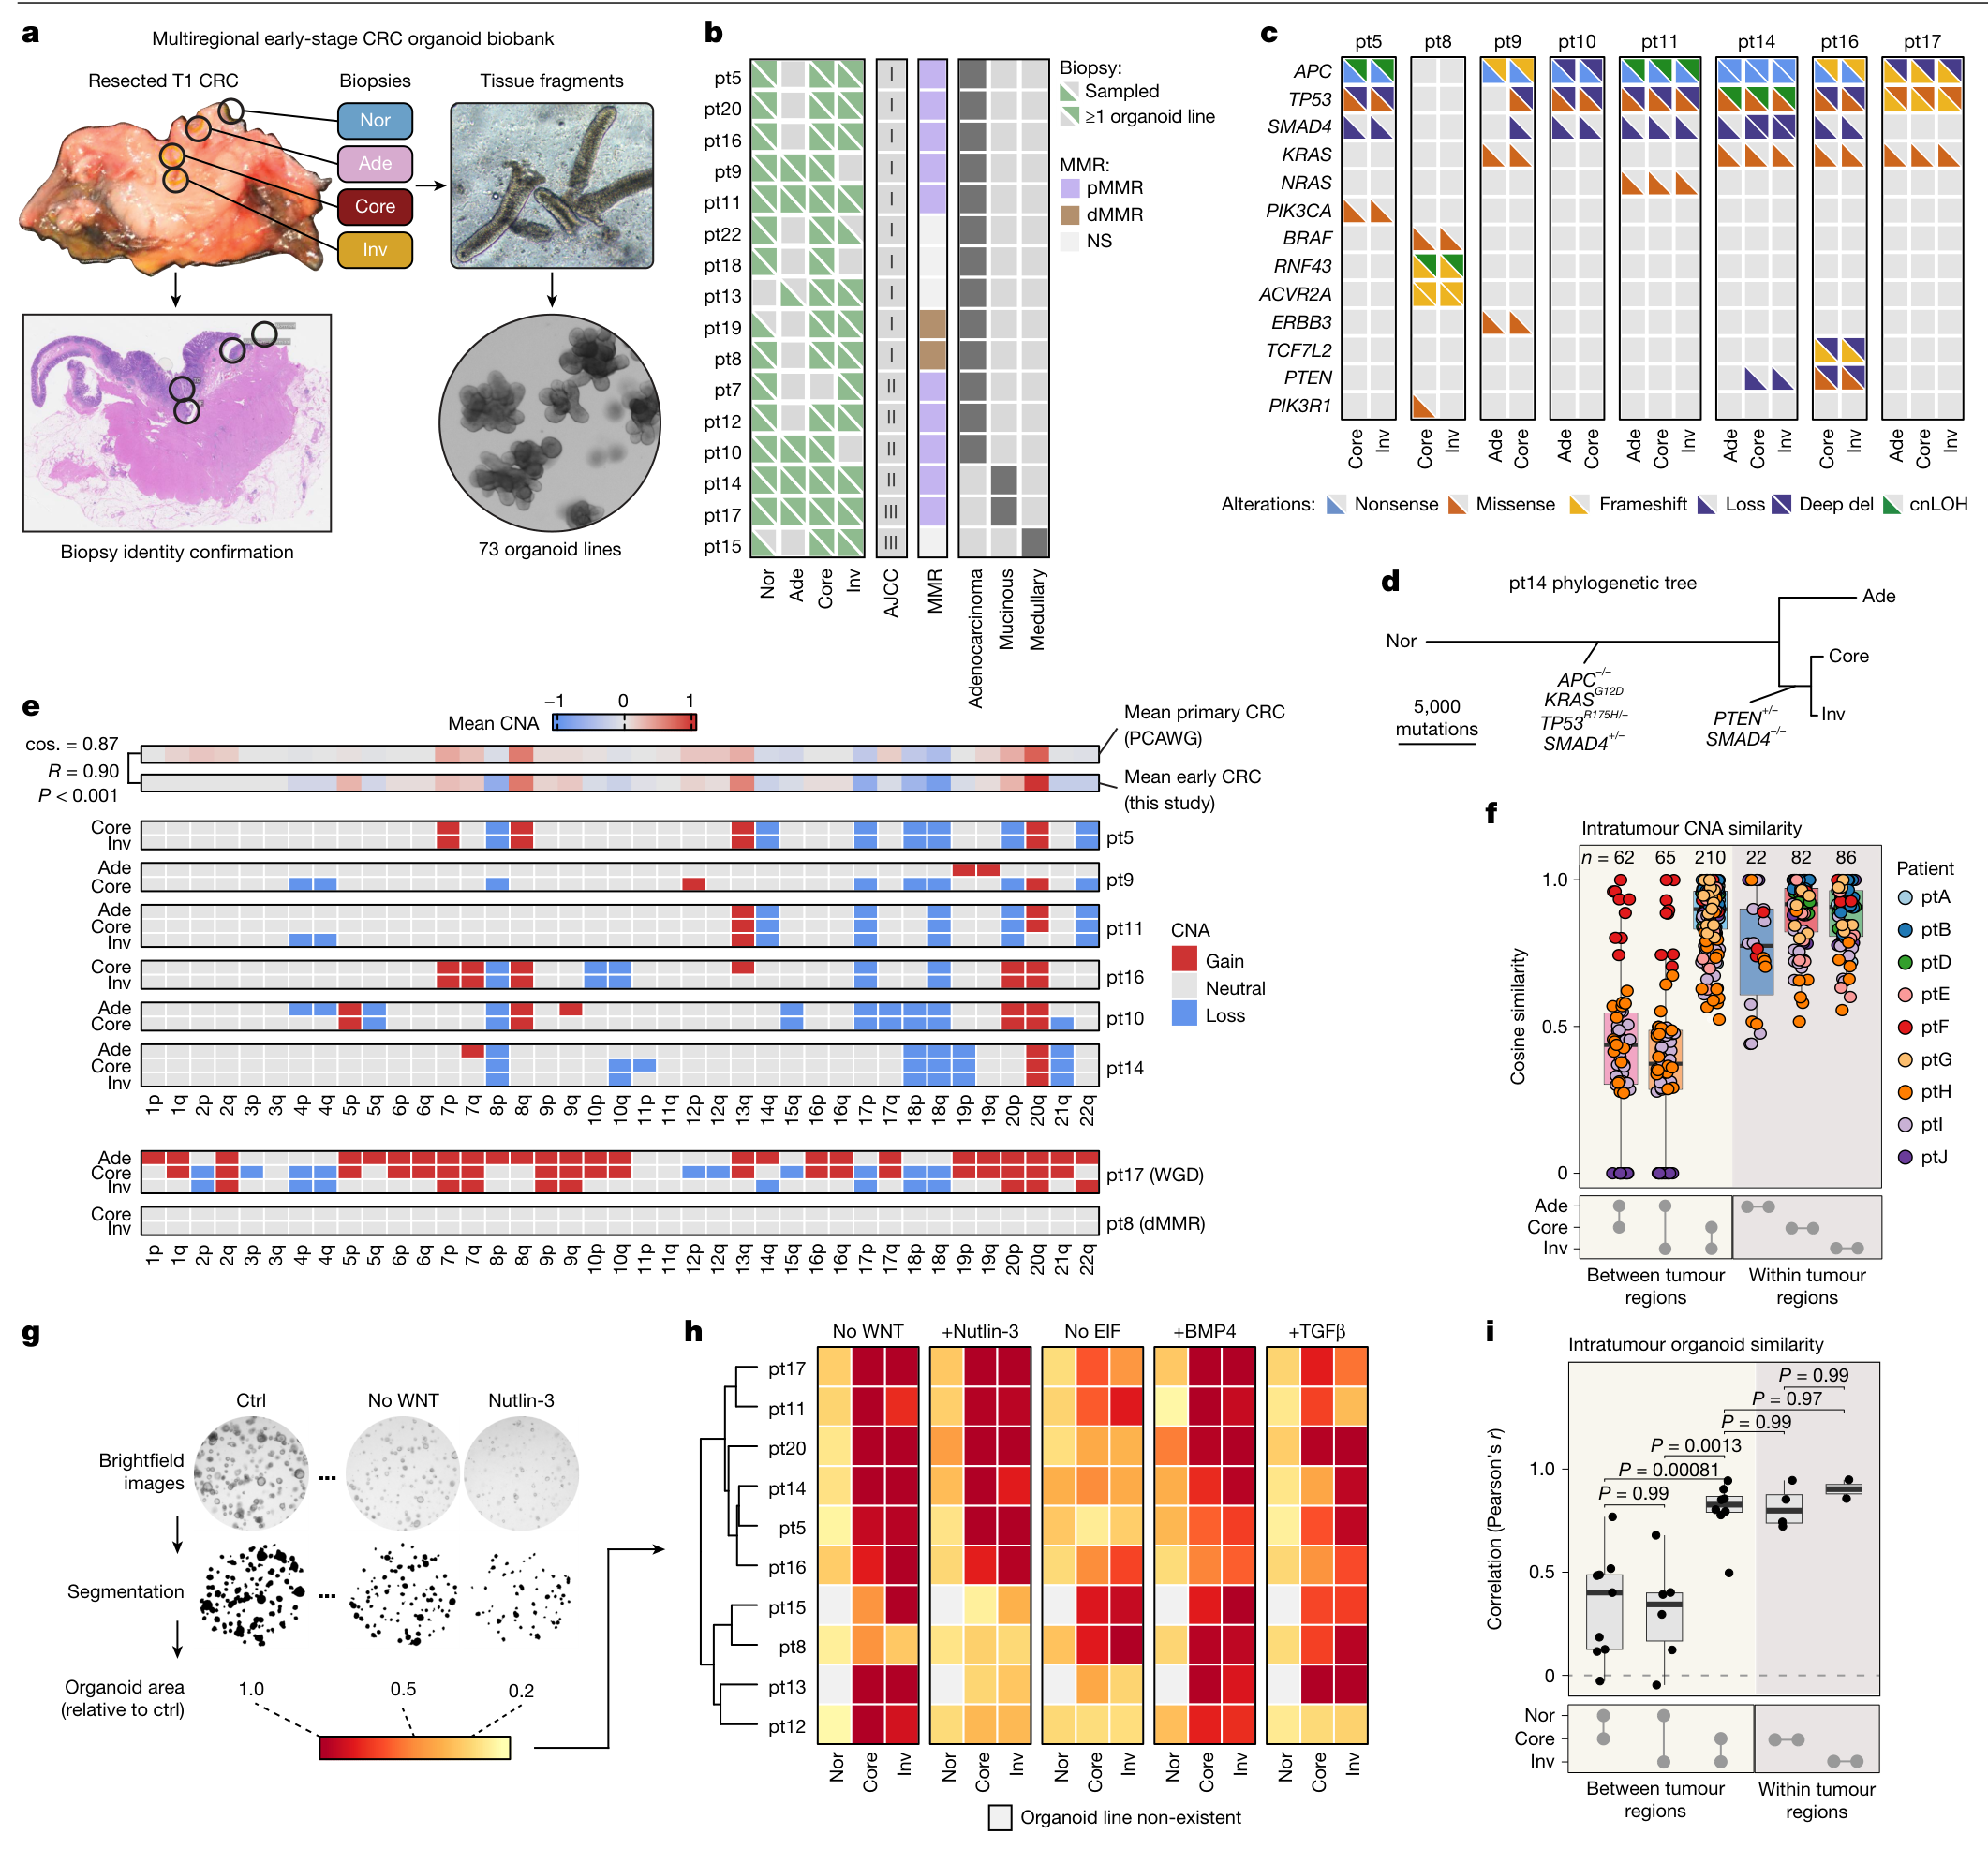
图 2 · 肿瘤核心与侵袭前沿的配对比较。原文 PDF 第 4 页。
机制:成纤维细胞与旁分泌诱导
单细胞和空间分析将 trophocyte-like CAF 定位到侵袭前沿,连接了基质组成与上皮细胞状态(PDF 第 5–7 页)。
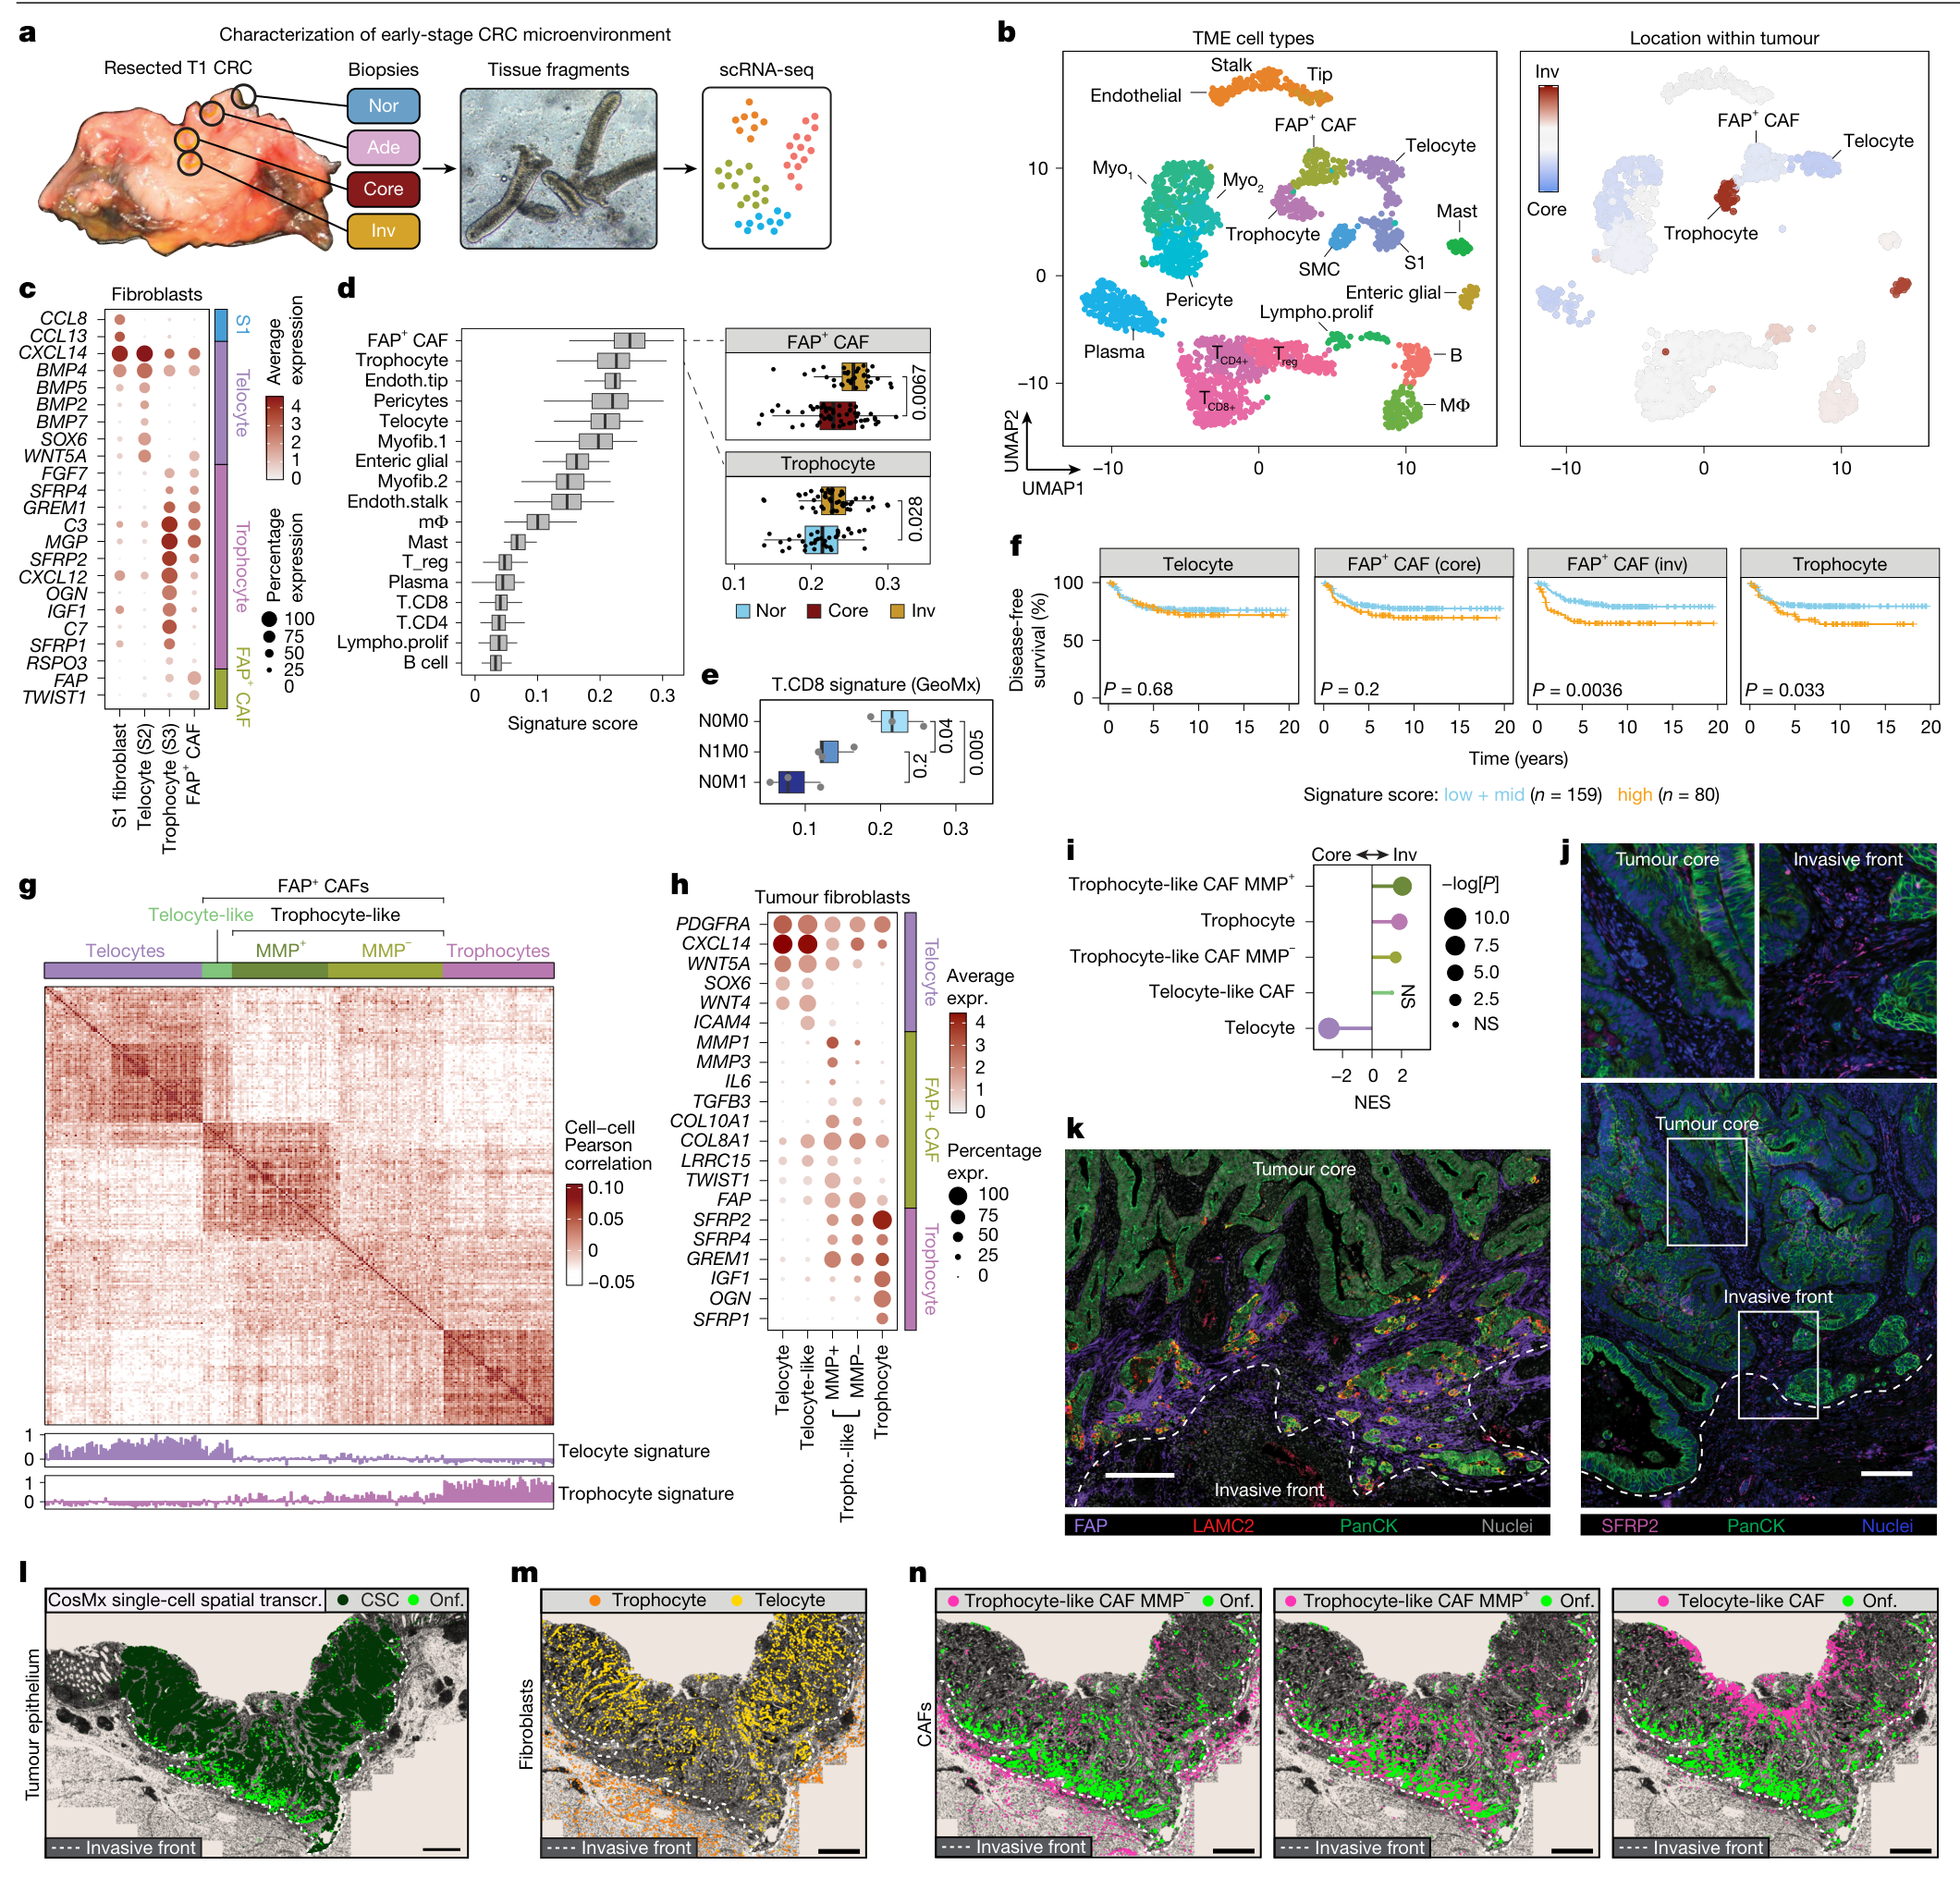
图 3 · 成纤维细胞亚群与空间分布。原文 PDF 第 6 页,图注第 7 页。
共培养与 Transwell 实验提供了旁分泌作用的支持。TGFβ 和前列腺素的联合刺激增强 EMP1 相关状态,且可作用于核心与前沿来源的类器官(PDF 第 6–8 页)。
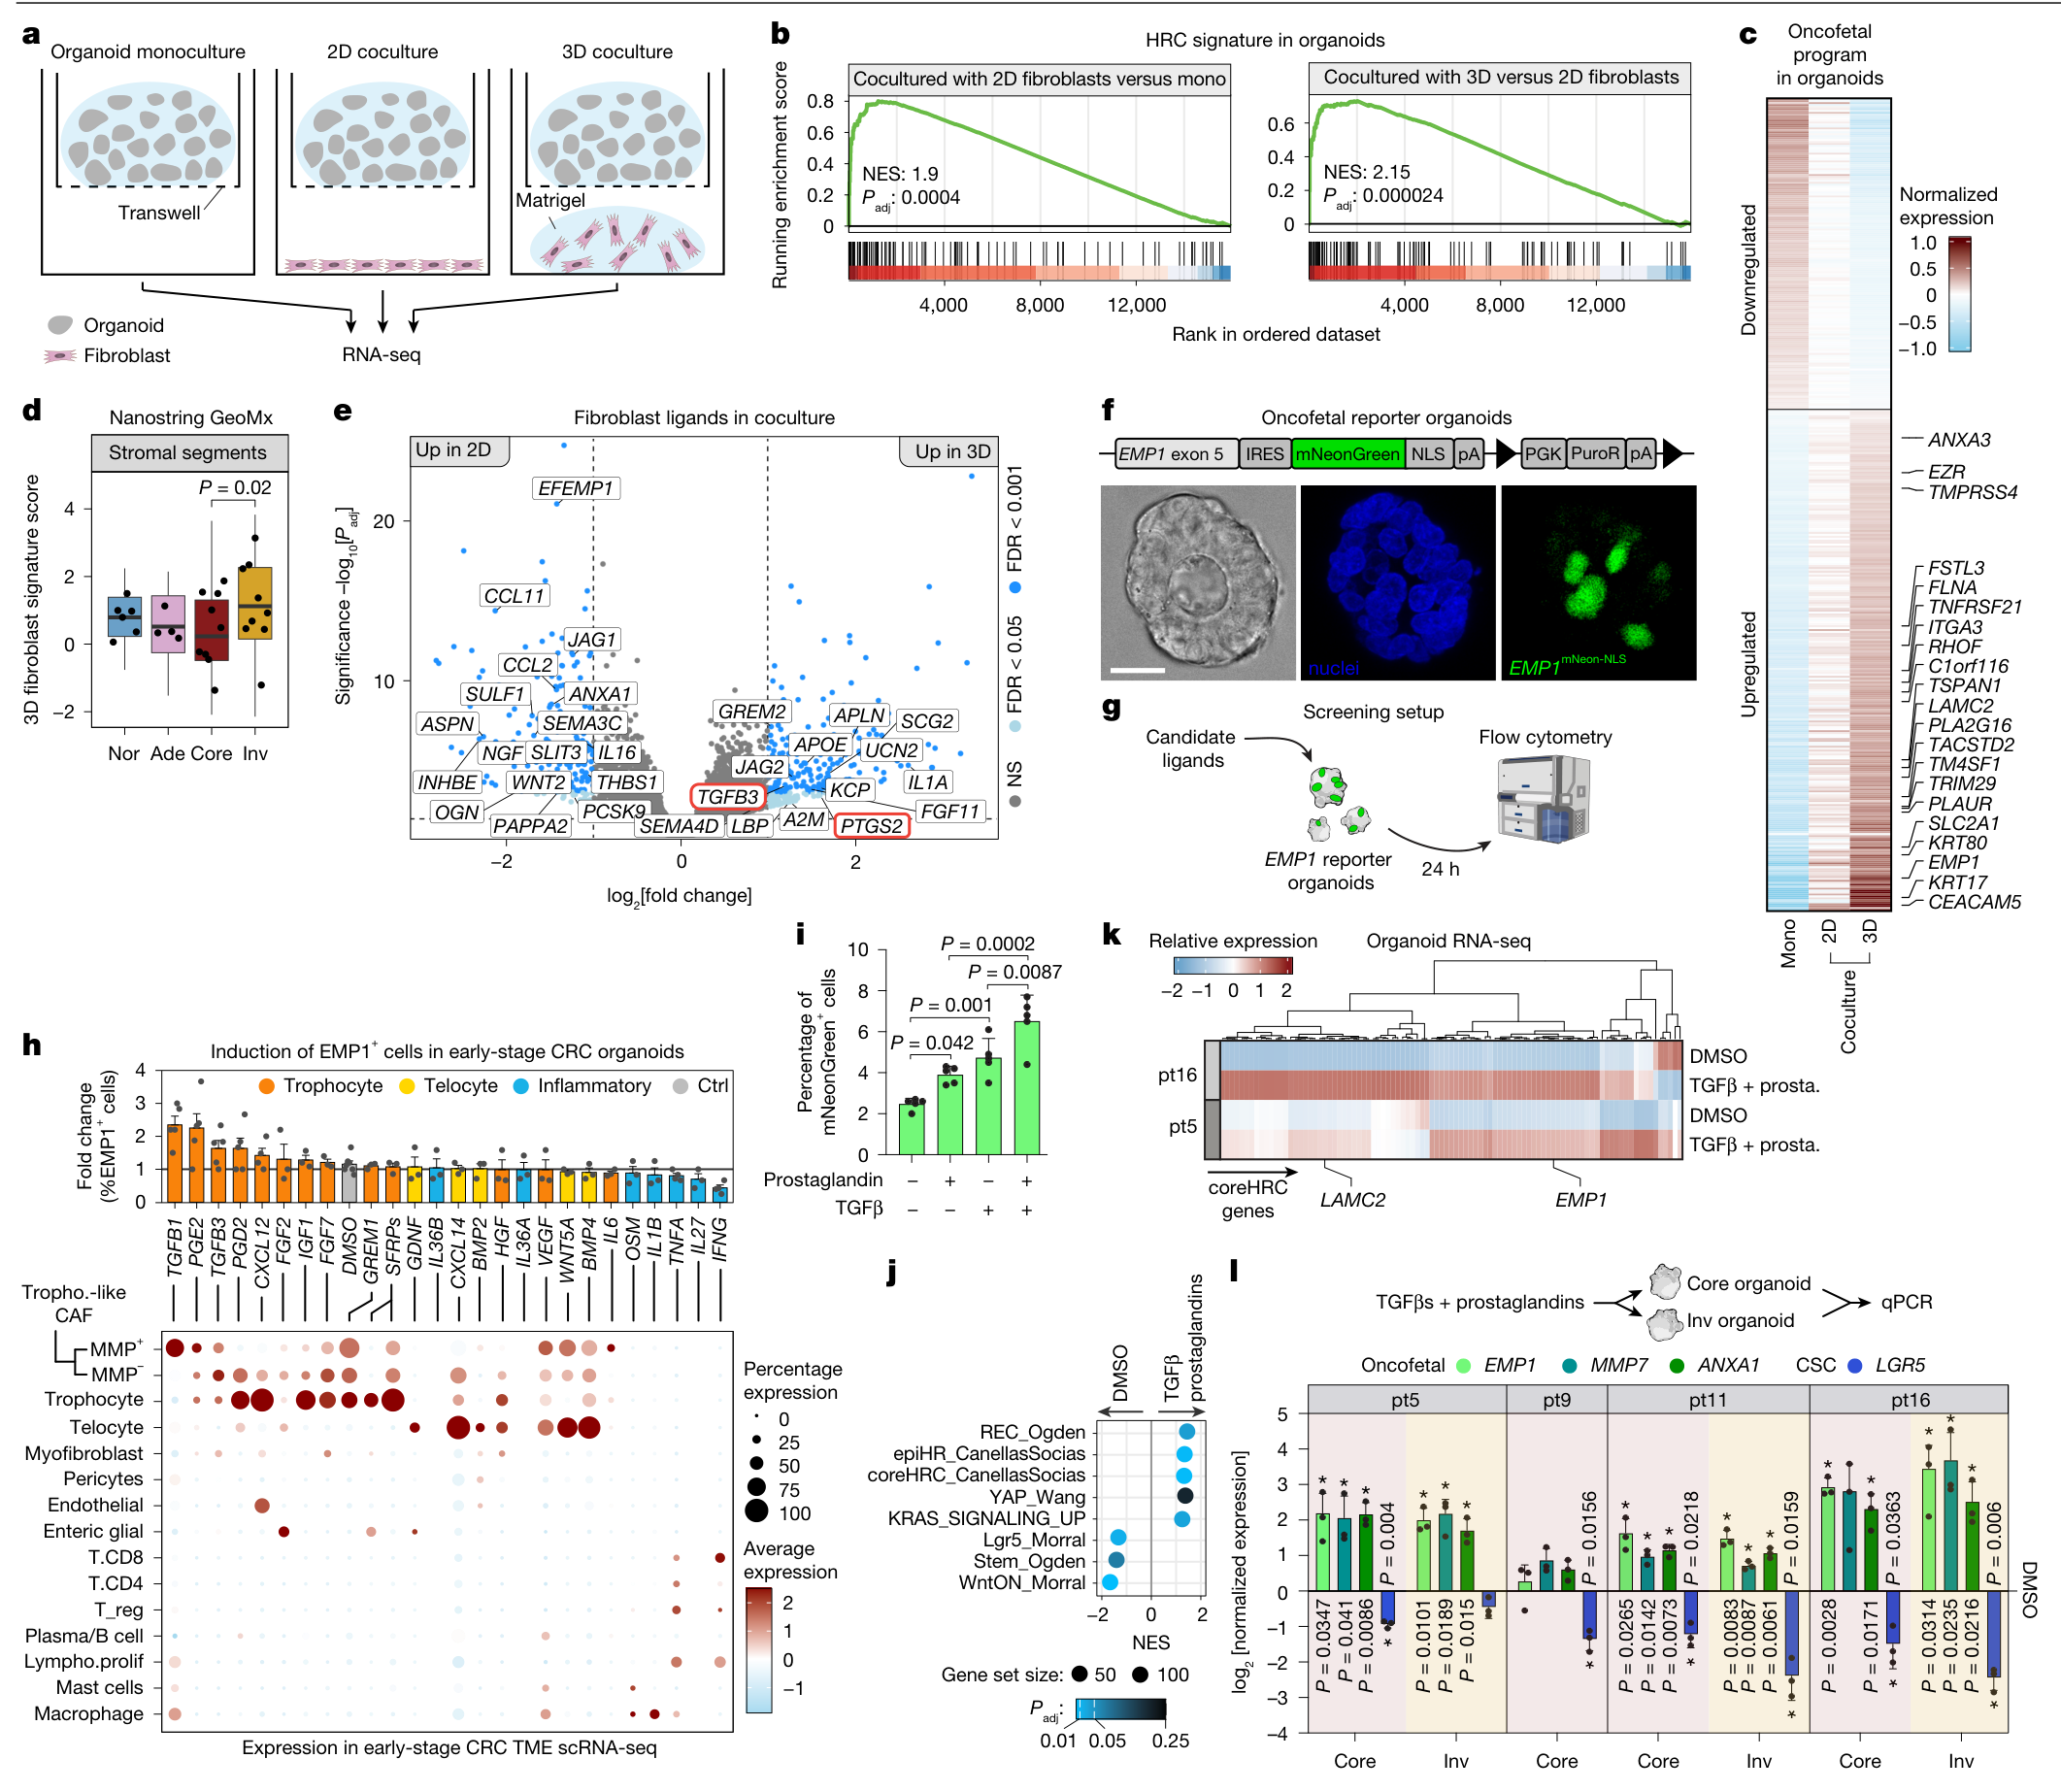
图 4 · 共培养与状态诱导。原文 PDF 第 8 页。
发现三:CAF 与胎儿样状态随侵袭共同增加
跨浸润亚阶段的病例分析显示,trophocyte-like CAF 与胎儿样肿瘤细胞的增加相伴发生。空间与轨迹分析支持 CAF 来源的模型,目前仍属于不同病例构成的拟纵向观察(PDF 第 7–10 页)。
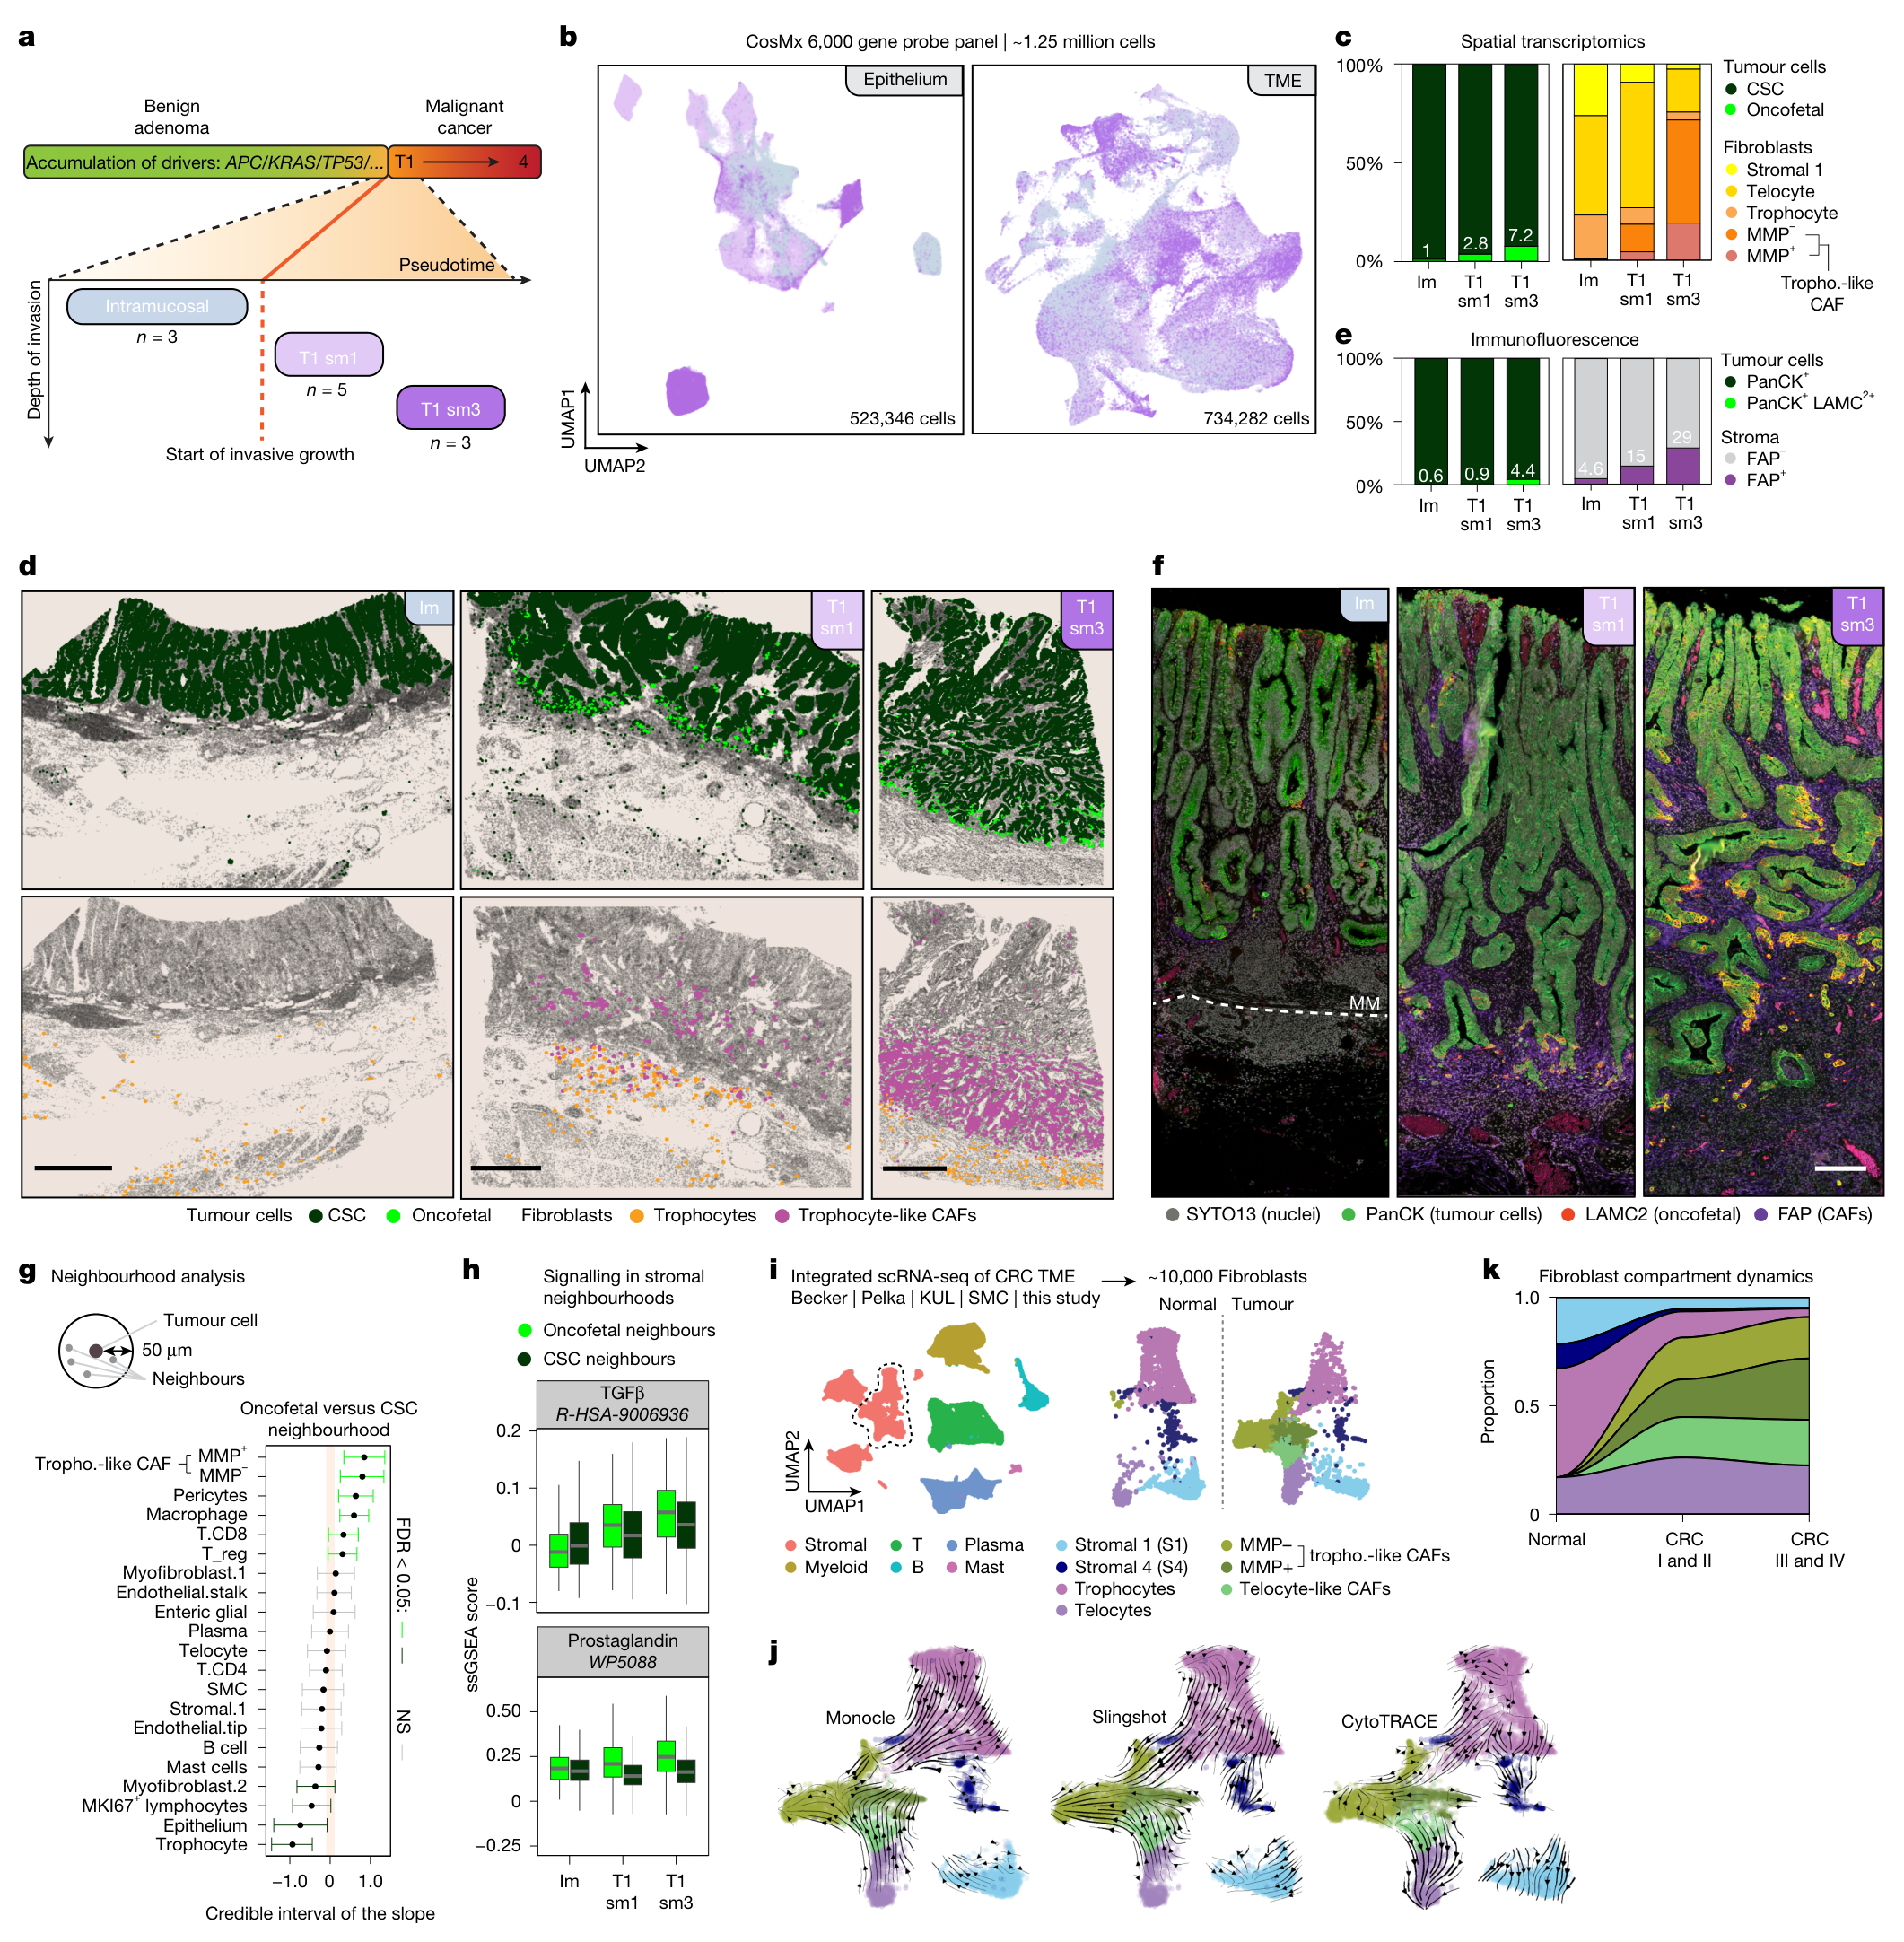
图 5 · 侵袭阶段与生态位变化。原文 PDF 第 9 页。
这项研究带来的新线索
转移相关状态的研究窗口可以前移。 早期侵袭病灶已经提供了观察细胞可塑性与基质相互作用的机会。
微环境能够塑造细胞状态。 区域类器官与共培养把组织中的空间关联推进到了信号诱导实验。
免疫逃逸与后续转移仍是进一步的问题。 胎儿样程序出现以后,哪些条件促成真正的播散与复发,是后续研究的关键(PDF 第 7–10 页)。
原始文献线索:Cañellas-Socias 等关于残留 EMP1+ 细胞与转移复发的研究(Nature 2022,ref. 14);McCarthy 等关于肠道 BMP 信号梯度的研究(2020,ref. 46)。
主图与表格 · 5 张
Fig. 1 · PDF 第 3 页
Fig. 1 | Metastasis-associated signatures at the invasive front of early-stage colon cancer. a, Spatial transcriptomics on 19 T1 CRCs with cancer-specific (CTA; 373 segments; 5 probes per gene) and whole-transcriptome (WTA; 281 segments; 1 probe per gene) probe panels. Lymph node (N) and distant metastasis status (M) are indicated. b, Example of ROI placement in T1 CRCs. c, Zoom-in of a representative ROI (invasive front no. 2 shown in b), showing epithelial and stromal segmentation for separate profiling. The dashed line shows the tumour border. d, Variance partitioning of a spatial transcriptomics dataset (WTA; n = 2,000 most variable genes; boxes, interquartile range; black bars, median; whiskers, 1.5× interquartile range). e, Violin plot of pairwise correlations between stromal–stromal (blue) or epithelial–epithelial (red) segment pairs within, or between, patients (n = 104 region comparisons across 9 patients; boxes, interquartile range; black bars, median; whiskers, 1.5× interquartile range; ANOVA P = 2.31 × 10⁻¹¹, Tukey’s honestly significant difference (HSD)). f, Heatmap showing relative expression (log2 fold change) of the top differentially expressed genes (lowest 10 Padj values with Padj < 0.05; Wilcoxon rank-sum test with Bonferroni correction) in epithelial segments (n = 140) for each histopathological region (CTA). Bold font shows fetal markers. g, Correlation matrix of T1 tumour core (red font) and invasive front (yellow font) signatures from this study versus published CRC signatures within tumour core (n = 42) and invasive front (n = 43) epithelial segments (WTA). h, EpiHR signature in epithelial segments of indicated histopathological regions of all 19 spatially profiled T1 CRCs. Connected points denote patient median. EpiHR signature was subset for genes probed in both the CTA and WTA probe panels (boxes, interquartile range; black bars, median; whiskers, 1.5× interquartile range; t-test). i, Immunofluorescence showing oncofetal marker LAMC2 at the invasive front of T1 CRC (n = 2 tumours). j, Immunofluorescence for LAMC2+ oncofetal tumour cells and FAP+ CAFs on tissue microarray of 232 T1 CRCs with 5-year clinical follow-up. k, Composition analysis of j. l, GSEA of epithelial invasive front segments from metastatic versus non-metastatic tumours. Significant immune-related gene ontology biological processes are highlighted in blue (permutation-based test, Benjamini–Hochberg corrected). Ade, adenoma; core, tumour core; CSC, cancer stem cell; GO, gene ontology; inv, invasive front; NES, normalized enrichment score; nor, normal; NS, not significant; pt, patient; TMA, tissue microarray. Scale bars, 1 mm (b); 200 μm (c,i). Illustration in a reproduced from NIH BioArt (https://bioart.niaid.nih. gov/bioart/212); illustrations in j adapted from NIH BioArt (https://bioart. niaid.nih.gov/bioart/214 and https://bioart.niaid.nih.gov/bioart/232).
Fig. 2 · PDF 第 4 页
Fig. 2 | Invasive front tumour cell phenotypes are not genetically driven. a, Overview of organoid derivation from regional punch biopsies (circles) in early-stage CRC. Biopsies are processed to tissue fragments and aliquoted for organoid culture and cryopreservation. Regional identity of biopsies was histologically confirmed on the sampled CRC (FFPE) by a pathologist (circles denote punch locations on haematoxylin and eosin). b, Overview of multiregional early-stage CRC organoid biobank. c, Driver landscape in early-stage CRC organoids. Driver genes with a prevalence of more than 4% in ref. 49 and a driver likelihood score of more than 0.8 are shown. d, Representative phylogenetic tree (patient 14) showing an evolutionary relationship between histopathological regions based on WGS data. Mutations and stage of acquisition are annotated. e, CNAs in early-stage CRC organoids. Top, mean CNA profile of our samples and PCAWG primary CRC reference dataset (dMMR and WGD excluded, statistical comparison is Pearson’s correlation r with P value and cosine similarity). f, Boxplot showing pairwise cosine similarities of inferred CNA profiles (inferCNV) within spatial transcriptomics dataset of early-stage CRCs. Points represent pairwise comparisons between regions (boxes, interquartile range; black bars, median; whiskers, 1.5× interquartile range). g, Quantification method for organoid outgrowth efficiency in various culture conditions using OrganoSeg64. Total organoid area relative to control medium after 9 days of outgrowth from single cells was assessed. h, Outgrowth efficiency of organoids from the early-stage CRC biobank in medium with indicated modifications. i, Pearson correlations of outgrowth efficiencies between organoid lines derived from the same tumour (n = 29 comparisons across regional organoid lines from 13 patients; boxes, interquartile range; black bars, median; whiskers, 1.5× interquartile range; ANOVA P < 0.0001, Tukey’s HSD). AJCC, American Joint Committee on Cancer staging system; cnLOH, copy neutral loss of heterozygosity; ctrl, control; del, deletion; dMMR, deficient mismatch repair; ND, not determined; pMMR, proficient mismatch repair; WGD, whole-genome duplication.
Fig. 3 · PDF 第 6 页
Fig. 3 | Trophocyte-like CAFs at the invasive front. a, scRNA-seq-based cell type identification in early-stage CRC TME. b, UMAP of scRNA-seq data from regional biopsies of biobanked CRCs (pt5, pt11, pt13, pt14 and pt16 (Fig. 2b)). Left, cell type annotation. Right, relative contribution of core and invasive front biopsies per cluster. c, Marker gene expression level across fibroblast subtypes from early-stage CRCs and tumour-adjacent normal tissue. Colours, expression level; dot size, percentage of cells expressing transcript. d, TME-HR signature14 scores across TME cell types in early-stage CRCs (n = 1,612 cells; 5 patients). Right panels, cells (black points) with highest TME-HR signature scores among CAFs and trophocytes originate from invasive front biopsies (boxes, interquartile range; black bars, median; whiskers, 1.5× interquartile range); t-test). e, CD8 T cell signature expression in tumours with indicated metastasis status from WTA spatial transcriptomics dataset of early-stage CRC (Fig. 1) (n = 9 patients; boxes, interquartile range; black bars, median; whiskers, 1.5× interquartile range; ANOVA P = 0.0015, Tukey’s HSD test). f, Disease-free survival of patients with CMS4 (ref. 49) stratified by low or mid (bottom 66%) versus high (top 33%) expression of indicated fibroblast subtype signatures (top 100 region-specific markers, Supplementary Table 5) (log-rank test). g, scRNA-seq cell–cell correlation matrix of fibroblasts from core and invasive front biopsies. Three CAF subtypes (green shades) can be recognized within the FAP+ CAF cluster. Colour scale represents cell–cell transcriptome similarity (Pearson correlation coefficient calculated over the 8,000 most variable genes). Bottom tracks, telocyte and trophocyte signature scores for each cell. h, Expression level of markers among fibroblast subtypes. Colours, expression level; dot size, percentage of cells expressing transcripts. Benjamini–Hochberg. i, GSEA of GeoMx (WTA; n = 9 T1 CRCs; permutation test with FDR) bulk expression profiles between tumour core and invasive front using cell type- specific signatures from scRNA-seq. Lollypop length, normalized enrichment score; dot size, nominal probability (−log[P]). j, Immunofluorescence for trophocyte marker SFRP2 (magenta) at the invasive front of early-stage CRC (n = 4 tumours). Tumour cells in green (PanCK+), nuclei in blue (SYTO13). Top panels show zoom-ins of indicated regions. The dashed line shows the tumour border. k, Immunofluorescence against FAP (purple) and HRC marker LAMC2 (red) at the invasive front of early-stage CRC (n = 3 tumours). Tumour cells in green (PanCK), nuclei in grey (SYTO13). Costaining of PanCK and LAMC2 is shown in yellow. The white dashed line shows the tumour border. l, Single-cell spatial transcriptomics of T1 CRC specimen showing oncofetal cells (high expressors of High Relapse signature, bright green)14 and WNT-driven cancer (stem) cells (dark green)29 The dashed line shows the tumour border. m, As in l, but showing trophocytes (orange) and telocytes (yellow). The dashed line shows the tumour border. n, As in l, but showing FAP + CAF subtypes. B, B cell; IQR, interquartile range; lympho.prolif, proliferative lymphocytes; MΦ, macrophage; myo, myofibroblast; NES, normalized enrichment score; NS, not significant; onf, oncofetal; S1, stromal 1; SMC, smooth muscle cell; TCD8+, CD8+ T cell; TCD4+, CD4+ T cell; transcr., transcriptomics; Treg, regulatory T cell. Scale bars, 200 μm (j,k); 1 mm (l–n).
Fig. 4 · PDF 第 8 页
Fig. 4 | Trophocyte-like CAFs induce oncofetal plasticity to EMP1+ tumour cell states. a, Schematic of coculture experiment. b, GSEA of coreHRC signature in organoids across culture conditions (permutation test with FDR). Left, 2D (n = 6) versus monoculture (n = 7). Right, 3D (n = 6) versus 2D (n = 6). c, The log2 fold change of differentially expressed genes in coculture. Oncofetal markers annotated. d, 3D fibroblasts signature (top 100 differentially expressed genes ranked by log2 fold change, Padj < 0.01) expression in GeoMx regions (WTA; n = 9 patients). Boxes, interquartile range; black bars, median; whiskers, 1.5× interquartile range; t-test). e, Differentially expressed genes in 3D (n = 6) versus 2D (n = 6) cocultured fibroblasts. Ligand-mediated signalling genes are annotated (Wald test with Benjamini–Hochberg correction). f, Top, EMP1 reporter knock-in schematic. Bottom, fluorescence image of EMP1 reporter organoid. g, Organoid-based screen for inducers of oncofetal state. h, Top, fold change in EMP1-mNeon+ cells (%) versus control. Data points, independent experiments (exact n shown by number of data points; error bars, s.e.m.). Bottom, scRNA-seq dot plot of screened ligands in invasive front biopsies (Fig. 3) (PGE2, PTGES; PGD2, PTGDS). i, Percentage of EMP1-mNeon+ cells across conditions. Prostaglandin, PGD2 + PGE2. TGFβ, TGFβ1 + TGFβ3 (n = 5; mean + s.d.; ANOVA, Bonferroni correction). j, GSEA of oncofetal and CSC signatures in organoids treated with TGFβ (TGFβ1 + TGFβ3) and prostaglandins (PGD2 + PGE2) (n = 2 patients; 3 replicates; permutation-based test, Benjamini– Hochberg corrected). k, Like j, but relative expression of coreHRC signature genes. l, qPCR of oncofetal markers and LGR5, following 24 h of treatment with PGD2, PGE2, TGFβ1 and TGFβ3 in 7 independent organoid lines from 4 early- stage CRCs. Values normalized to DMSO, mean + s.d. Points, independent measurements (n = 3; *P < 0.05, ratio paired t-test). Illustration in g adapted from NIH BioArt (https://bioart.niaid.nih.gov/bioart/160); illustration in l reproduced from NIH BioArt (https://bioart.niaid.nih.gov/bioart/661). DMSO, dimethylsulfoxide; IRES, internal ribosomal entry site, mono, monoculture; NLS, nuclear localization signal; pA, polyA; PuroR, Puromycin Resistance cassette. Scale bar, 20 μm (f).
Fig. 5 · PDF 第 9 页
Fig. 5 | Trophocyte-like CAFs and oncofetal plasticity co-emerge at the birth of malignancy. a, Pseudo-longitudinal single-cell spatial transcriptomics of 11 early-stage CRCs (CosMx; 6,000 probe panel). b, UMAP of epithelial (left) and microenvironmental (right) compartments. c, Relative abundance (%) of tumour cell types and fibroblasts in single-cell spatial transcriptomics of intramucosal (n = 3), T1 sm1 (n = 5) and T1 sm3 (n = 3) specimens. d, Single-cell spatial plots showing localization of WNT-driven cancer (stem) cells (CSC, dark green), oncofetal cells (bright green, HRC signature), trophocytes (orange) and trophocyte-like CAFs (purple) in representative intramucosal, T1 sm1 and T1 sm3 specimens. e, Percentage of LAMC2+ oncofetal tumour cells (within PanCK+ epithelium) and FAP+ CAFs (within PanCK− stroma) just before (intramucosal carcinoma, n = 3) and shortly after (T1 sm1 n = 3 and T1 sm3 n = 3) malignant transformation. f, Immunofluorescence of tumour specimens just before and after malignant transformation. Nuclei (grey, SYTO13), epithelial cells (green, PanCK), oncofetal tumour cells (red, LAMC2) and CAFs (purple, FAP) are stained. Orange, PanCK and LAMC2 co-expression. White dashed line, muscularis mucosae. g, Differential cell type composition of oncofetal and CSC neighbourhoods (50 µm radius; n = 11 patients). Whiskers, 95% credible interval, coloured by significance (FDR < 0.05). h, ssGSEA scores for TGFβ and prostaglandin signalling in stromal neighbourhoods of oncofetal and CSC tumour cells per tumour stage (n = 11 patients; boxes, interquartile range; grey bars, median; whiskers, 1.5× interquartile range). i, UMAP of integrated CRC TME scRNA-seq datasets45,54,55 (n = 110 patients). Left, unsupervised clustering and cell type annotations. Right, zoom-in of fibroblasts, split over normal and tumour tissue. j, UMAP of fibroblasts from integrated scRNA-seq with streamlines showing inferred trajectories of Monocle, Slingshot and CytoTRACE pseudotime. k, Relative contribution of fibroblast subtypes to total fibroblast compartment in normal tissue, and early (stage I–II) and advanced (stage III–IV) CRCs. Im, intramucosal; MM, muscularis mucosae. Scale bars, 1 mm (d); 200 μm (f).
完整阅读记录与证据表
文献卡:Emergence of oncofetal plasticity is ubiquitous in early colorectal cancers
- Paper ID:p-0005-art-emergence-oncofetal-plasticity
- 分析日期:2026-09-08;技能:article-read + morning-report
- 原文类型:Article;期刊:Nature
- 阅读覆盖:PDF 共34页。第1–10页正文与主图图注、第12–16页方法及数据声明已读;图1、4、5(PDF第3、8、9页)已视觉查看,图2–3仅正文/图注。第11页参考文献未逐条核查;第17–29页扩展数据未逐页研读;第30页报告摘要已视觉查看,第31–34页未核查。独立补充表未提供。正文与方法研读已完成,扩展证据待补,因此为partial,不称34页全文精读。
- 人工核对:pending(待核对)
- 本卡页码均为从1开始的PDF页序。
一句话结论
作者在人早期结直肠癌发现,侵袭前沿很早出现肿瘤胎儿样状态,并以区域类器官及成纤维细胞共培养支持微环境诱导机制;这种状态的出现不等于必然转移,CAFs细胞来源仍主要由空间与拟时序证据推断(PDF第2–10页,图1–5)。
研究问题与背景
具有转移相关特征的细胞究竟何时出现,来自新增驱动突变还是局部环境?研究聚焦穿过黏膜肌层、侵入黏膜下层的早期CRC,把肿瘤核心与侵袭前沿并列比较(第1–2页)。T1表示浸润深度,不等于所有病例均为无淋巴结转移的临床I期。
贡献与比较对象
同一肿瘤不同区域的组织组学与配对类器官衔接,减少只比较不同患者时的遗传背景混杂。再由空间关联推进到共培养和候选信号刺激的功能验证,但没有因此完成在人体内的直接谱系追踪(第2–9页)。
方法与验证
- GeoMx分区域并区分上皮/基质;TMA独立队列验证LAMC2与FAP分布(第2–3、12页)。
- 16位患者建立区域类器官库;部分患者做WGS及生长因子依赖实验,比较核心与前沿(第2、4–5、13页)。
- 单细胞及CosMx定位trophocyte-like CAF、肿瘤胎儿样细胞;进一步分析跨浸润亚阶段的独立病例,构成拟纵向而非真正随访的组织序列(第5–9、14页)。
- 共培养区分2D/3D成纤维细胞;EMP1报告器、RNA-seq、qPCR和LAMC2验证信号诱导。Transwell实验提供旁分泌支持,不等同于完整体内微环境(第5–8、14–15页)。
核心证据
| 主张或结果 | 数字、单位、条件 | PDF页序/图表 | 依据类型 | 核对状态 |
|---|---|---|---|---|
| 早期侵袭前沿出现HRC/oncofetal特征 | 19例T1;CTA 10例、WTA 9例;不是19个细胞 | 第2–3页图1,第12页 | 正文+图1已查看 | 待人工核对 |
| 标记阳性不等于成功转移 | TMA质控后232例:175 N0M0、44 N+、13 M+;有5年随访 | 第3页图1j–k,第12页 | 正文+图表已查看 | 选择性病例队列,不用于估计人群发生率 |
| 区域类器官配对支持非新驱动解释 | 16患者、73条类器官系;8患者WGS,未发现前沿相对核心新增已识别驱动 | 第2、4–5页图2 | 正文/图注,图2未视觉核对 | 不能说排除全部遗传/表观遗传因素 |
| trophocyte-like CAF与前沿共定位 | 图3单细胞分区来自5例;单例CosMx约63万细胞 | 第5–7页图3 | 正文/图注,图3未视觉核对 | 细胞数不是患者数 |
| 共培养增强HRC程序 | 图4b:2D n=6对单培养n=7;3D n=6对2D n=6,n指实验样本 | 第8页图4b | 正文+图表已查看 | 待人工核对 |
| TGFβ与前列腺素共同增强EMP1+比例 | 图4i n=5;TGFβ1+TGFβ3、PGD2+PGE2;24小时读出 | 第6、8页图4i,第15页 | 正文+图表已查看 | 是短期状态诱导,非转移终点 |
| 同一诱导可作用于核心和前沿类器官 | 4患者、7独立类器官系,qPCR每组n=3独立测量 | 第8页图4l | 正文+图表已查看 | 不把测量数当患者数 |
| 侵袭发生与CAF/oncofetal增加伴随 | 11例:黏膜内3、T1 sm1 5、T1 sm3 3;约125万细胞 | 第7、9页图5 | 正文+图表已查看 | 拟纵向设计 |
| CAF起源于trophocyte是支持性推断 | 另整合110例scRNA-seq,使用多种轨迹算法 | 第9页图5i–j,第15页 | 图表+方法 | 非直接谱系追踪 |
局限
作者明确指出
免疫逃逸如何获得、胎儿样细胞比例增加是否由TME演变或细胞敏感性改变导致、晚期是否维持同一CAF空间格局均需进一步研究(第7–10页)。统计部分称假设正态但未正式检验;GSEA使用与普通检验不同的阈值,需按具体图理解(第15页)。
AI 推断与理由
- 组织区域代表肿瘤进展阶段的设计不是同一人的纵向采样;不能写成实时追踪了每个细胞的转变(第7、9页)。
- 未找到新增已知驱动,加上体外共同可诱导,支持环境影响,但未排除低频亚克隆、培养选择或表观遗传差异(第2、4–5、13页)。
- 单细胞空间分析和RNA轨迹不能替代谱系追踪;“trophocyte是首批CAF来源”仍有推断性质(第7、9–10页)。
- TGFβ/前列腺素短期诱导证明充分性的一部分,不证明它们在患者体内是唯一、必需信号,也不证明阻断即可避免转移(第6–8、15页)。
- TMA存在结局富集抽样,不能用44+13除以232作为一般T1 CRC的转移率(第12页)。
待核对问题与后续阅读
- 图5c/d正文强调黏膜内缺乏oncofetal状态,但图5c仍标注约1.0%的相关分类比例、图5e LAMC2阳性约0.6%;不要将“未形成显著状态群”写成绝对零表达,需核对分类阈值与单细胞注释。
- 第12页方法中提及排除被归为T3的pt17,而第2页总述为T1设计;各分析实际分母需结合补充表1逐项核对。
- 图3生存分析与免疫相关分析属关联;“免疫逃逸是额外瓶颈”并非在本研究中完整功能验证。
- 扩展图及图注第17–29页、报告摘要第31–34页和外部补充表仍待核查;优先扩展图3、8、9、10。
- 优先追读 Cañellas-Socias et al., Metastatic recurrence in colorectal cancer arises from residual EMP1+ cells(Nature 2022;第10页ref.14)以及 McCarthy et al., Distinct mesenchymal cell populations generate the essential intestinal BMP signaling gradient(2020;第10页ref.46)。均未直接核查。
人工补充
待人工填写;本次未创建或覆盖 discussion.md。