两次报告的关系
两篇来自同一项III期随机试验NCT04592913,ITT均为474对474例。NEJM报告主要EFS结果和中期OS;Lancet增加最终OS及按病理反应分层的探索性EFS。两次报告随访同一948例人群,2026报告的安全性沿用此前的数据截止。
| 项目 | NEJM 2025 | Lancet 2026 |
|---|---|---|
| 报告重点 | EFS、pCR、中期OS | 最终OS、病理反应分层EFS |
| 数据截止 | EFS/中期OS:2024-12-20 | 最终OS:2025-09-01;病理分层EFS/安全性仍为2024-12-20 |
| 主要结论 | EFS达标;中期OS未达预设界值 | 最终OS达到预设界值 |
| pCR分母 | 全体ITT,缺失或无可评估标本按无反应 | 中央病理可评估子集,另列术后淋巴结分析集 |
来源:NEJM PDF第3–5、7页;Lancet PDF第5–7、9、11页。以下页码均指各自PDF页序。
研究设计
| 项目 | 设置 |
|---|---|
| 人群 | II–IVA期可切除胃或胃食管交界部腺癌,ECOG 0–1;排除远处转移及腹膜播散 |
| 随机比较 | 度伐利尤单抗+FLOT,对安慰剂+FLOT;双盲,147中心、20国 |
| 术前 | 2个28天联合周期,每周期第1、15天给FLOT;免疫药/安慰剂每4周一次 |
| 手术及术后 | 手术后再2个联合周期,随后10周期免疫药/安慰剂;全程共8次FLOT给药 |
| 主要终点 | EFS从随机化起算,覆盖阻止手术或需方案外治疗的进展、术后进展/复发及死亡 |
| 关键次要终点 | OS;pCR要求原发灶与切除淋巴结均无存活肿瘤 |
FLOT为氟尿嘧啶、亚叶酸、奥沙利铂和多西他赛。亚洲地区入组180/948例(19%),未在中国入组。研究评价整个围手术期策略(NEJM第2–5、13页;Lancet第3–7、14页)。
2025:EFS与pCR
EFS事件为167/474对218/474,HR 0.71(95% CI 0.58–0.86),P<0.001,达到当次0.0239的显著性界值。24个月EFS为67.4%对58.5%,绝对相差8.9个百分点;中位EFS为未达到对32.8个月。HR描述事件瞬时风险的相对比较(NEJM第4–5页、图1)。
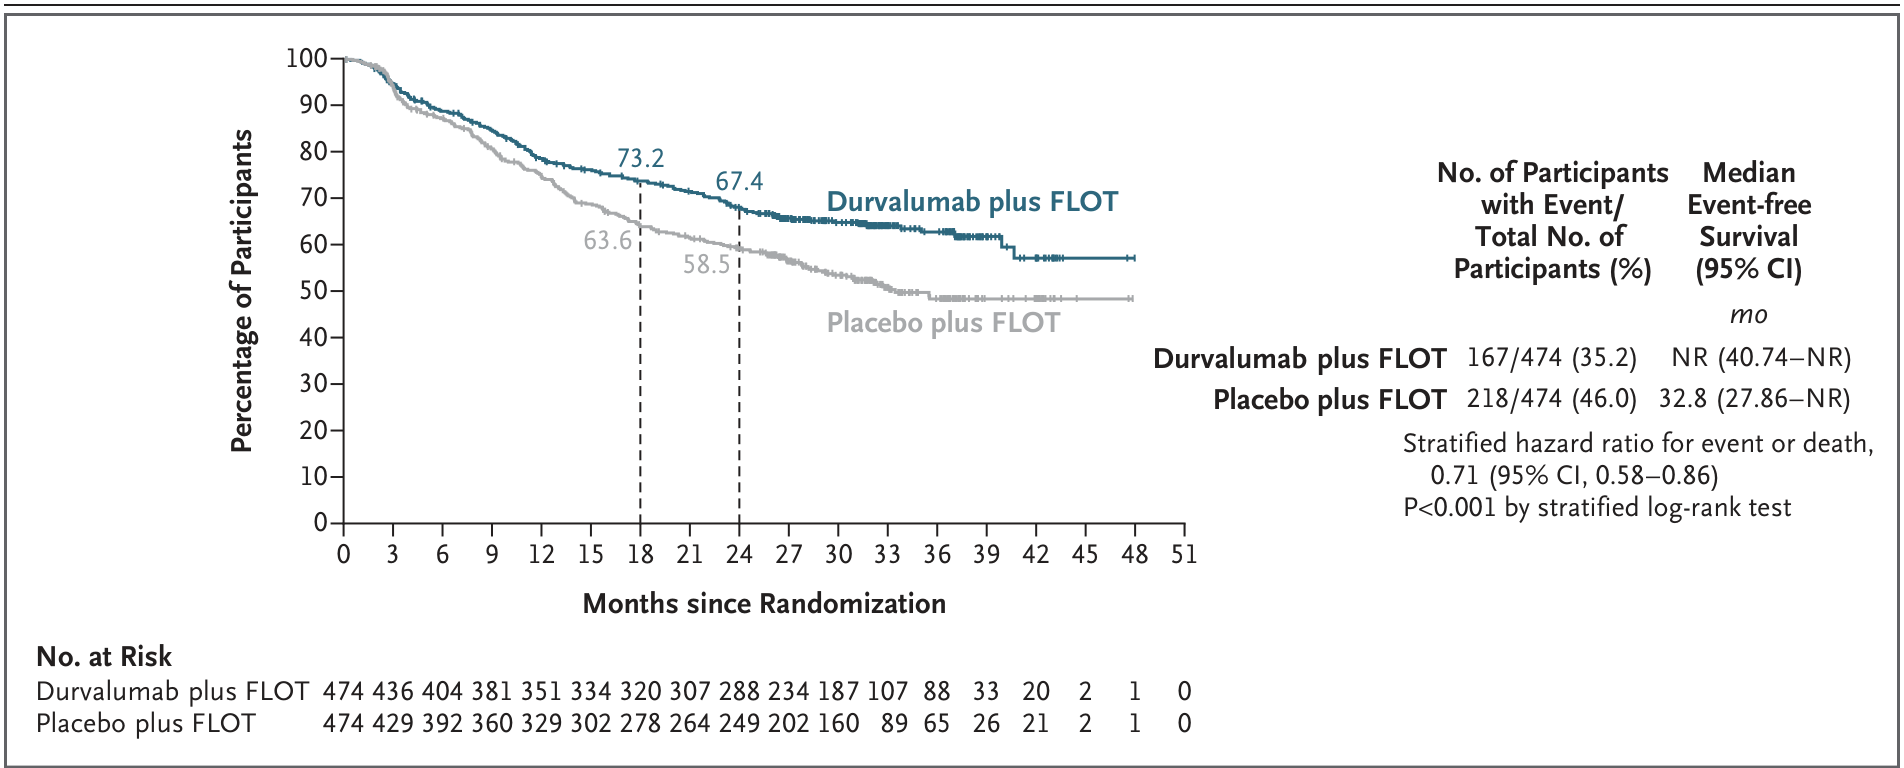
NEJM图1 · PDF第8页。
pCR为19.2%对7.2%,调整后的RR为2.69(95% CI 1.86–3.90)。该结果以全部随机患者为分母,未手术、缺失或无法评估标本均按未缓解处理(NEJM第3–5、7、10页)。
中期OS与最终OS
| 指标 | NEJM 2025中期OS | Lancet 2026最终OS |
|---|---|---|
| 死亡事件(度伐利尤单抗/安慰剂) | 145/176 | 160/192 |
| 24个月OS | 75.7%/70.4% | 76%/70% |
| 36个月OS | 本次主报告未列此固定时点 | 69%/62% |
| 效应量 | 0–12月HR 0.99(0.70–1.39);12月以后0.67(0.50–0.90) | 总体HR 0.78(0.63–0.96) |
| P值与当次界值 | P=0.03,须<0.0001,未达标 | P=0.021,须<0.0499,达标 |
来源:NEJM第7、10页;Lancet第7–9、11页。HR括号内均为95% CI;NEJM使用用户提供的2025年6月27日更新版。
这项试验采用多终点及分次检验。中期OS仅分配0.0001的显著性额度,最终OS使用剩余0.0499,两次检验分别按对应界值判断。NEJM更新版报告OS比例风险假设不满足,因此给出分段HR;Lancet最终报告的假设检验P=0.15,未见违背证据,采用总体HR。两种结果应保留各自时间点和分析方法。
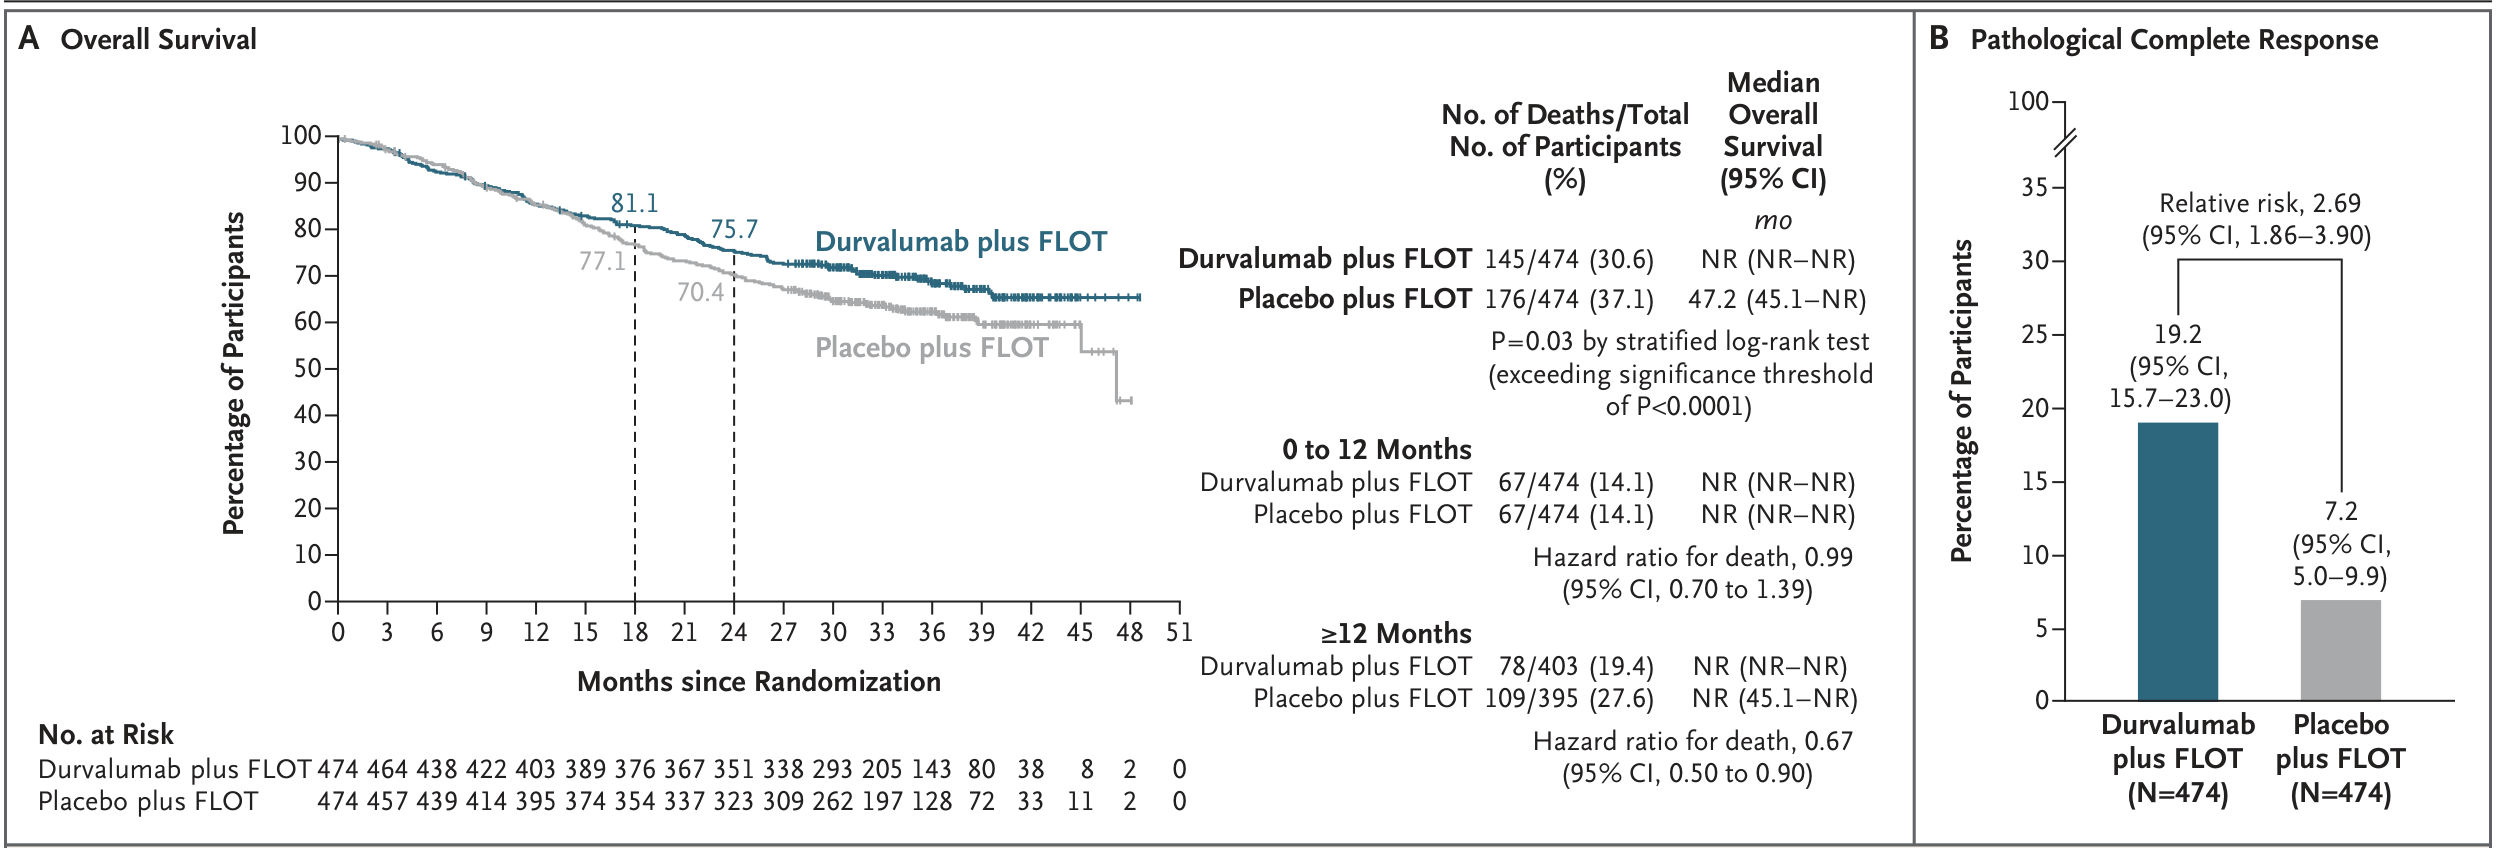
NEJM图3A–B · PDF第10页;横置原图已转正。
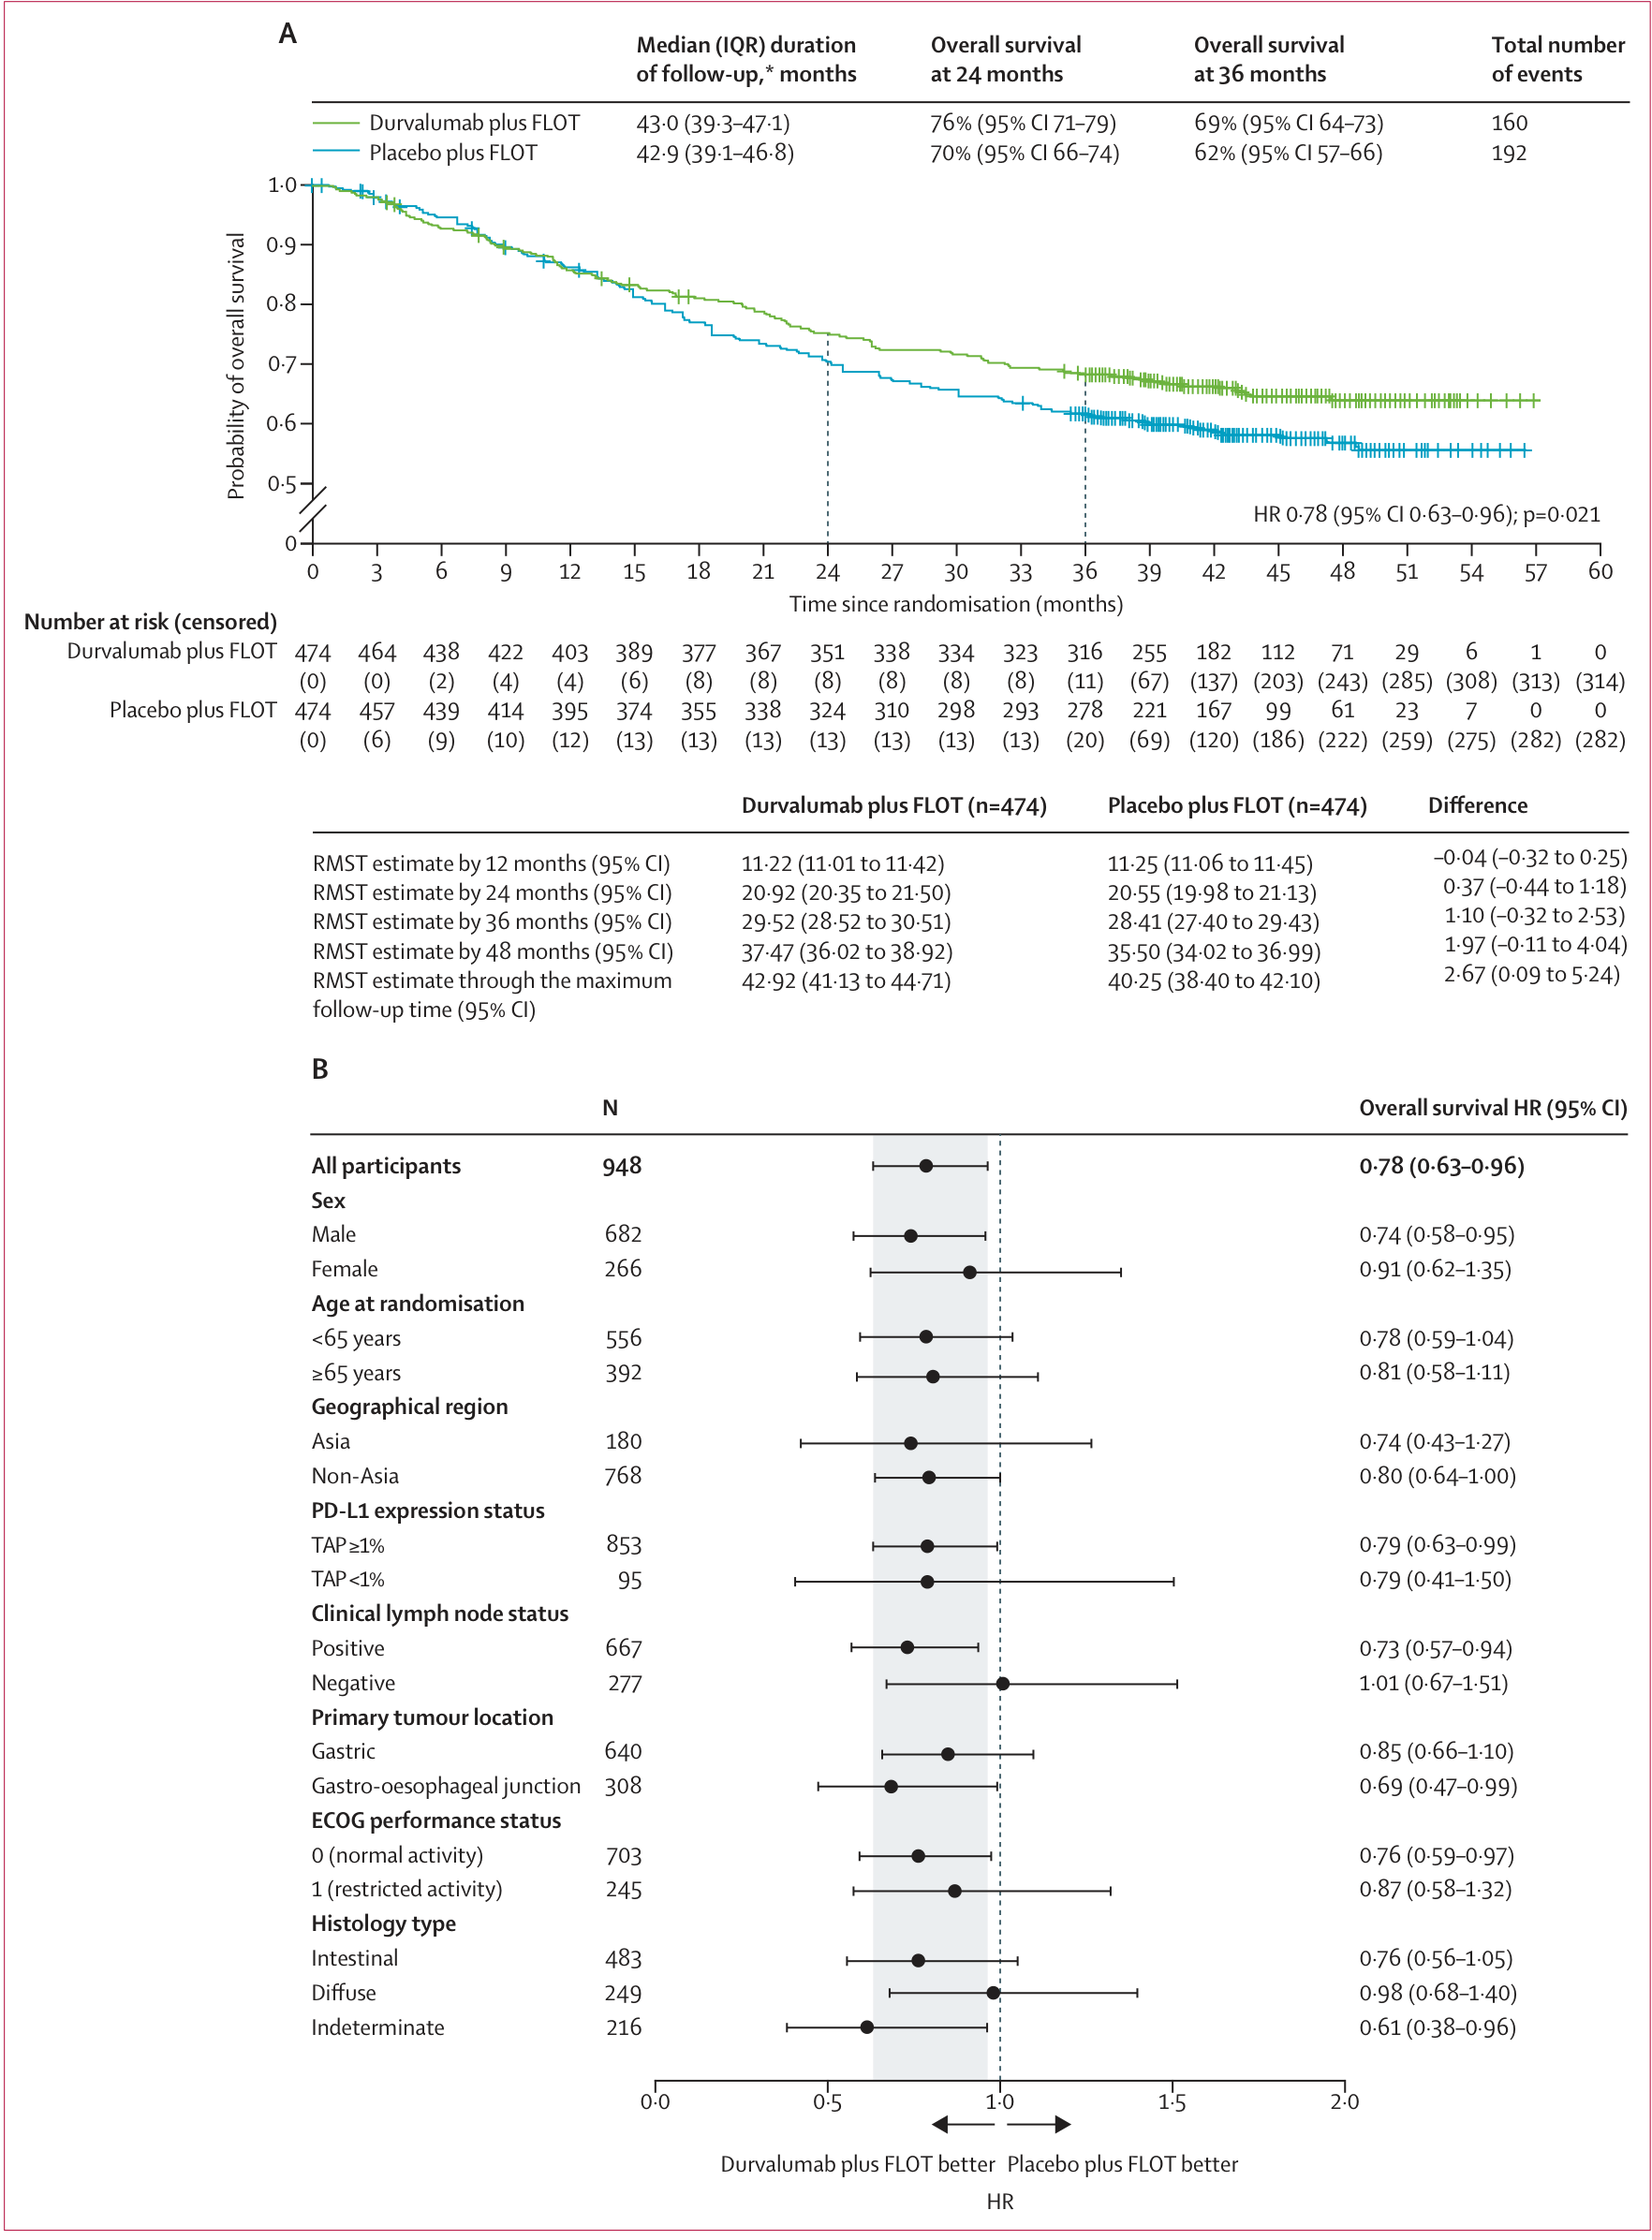
Lancet图2A–B · PDF第8页。
最终OS事件成熟度为37%,两组中位OS均未达到;图中的43.0与42.9个月是删失患者的中位随访时间。36个月生存率相差约7个百分点;48个月限制平均生存时间差的区间跨0(Lancet第8–9、11页)。
2026:病理缓解与后续结局
中央病理可评估人群中,pCR为91/385(24%)对34/372(9%)。2025年ITT报告的比例为19.2%对7.2%;两次报告分别使用全部随机患者与中央病理可评估子集作为分母。主要病理缓解(MPR)按改良Ryan评分0或1定义,其中包含pCR(Lancet第6–7、11页)。
| 图3子图 | 分析人群(两组人数) | EFS HR(95% CI) |
|---|---|---|
| A | pCR(91/34) | 0.29(0.08–0.96) |
| B | 未达pCR(294/338) | 0.82(0.63–1.05) |
| C | MPR(127/68) | 0.32(0.15–0.68) |
| D | 任意病理缓解(346/313) | 0.60(0.46–0.79) |
| E | 术后无淋巴结受累(239/179) | 0.74(0.46–1.18) |
| F | 术后有淋巴结受累(172/221) | 0.77(0.58–1.02) |
来源:Lancet图3,第10–11页。组序均为度伐利尤单抗/安慰剂;数据截止2024-12-20。
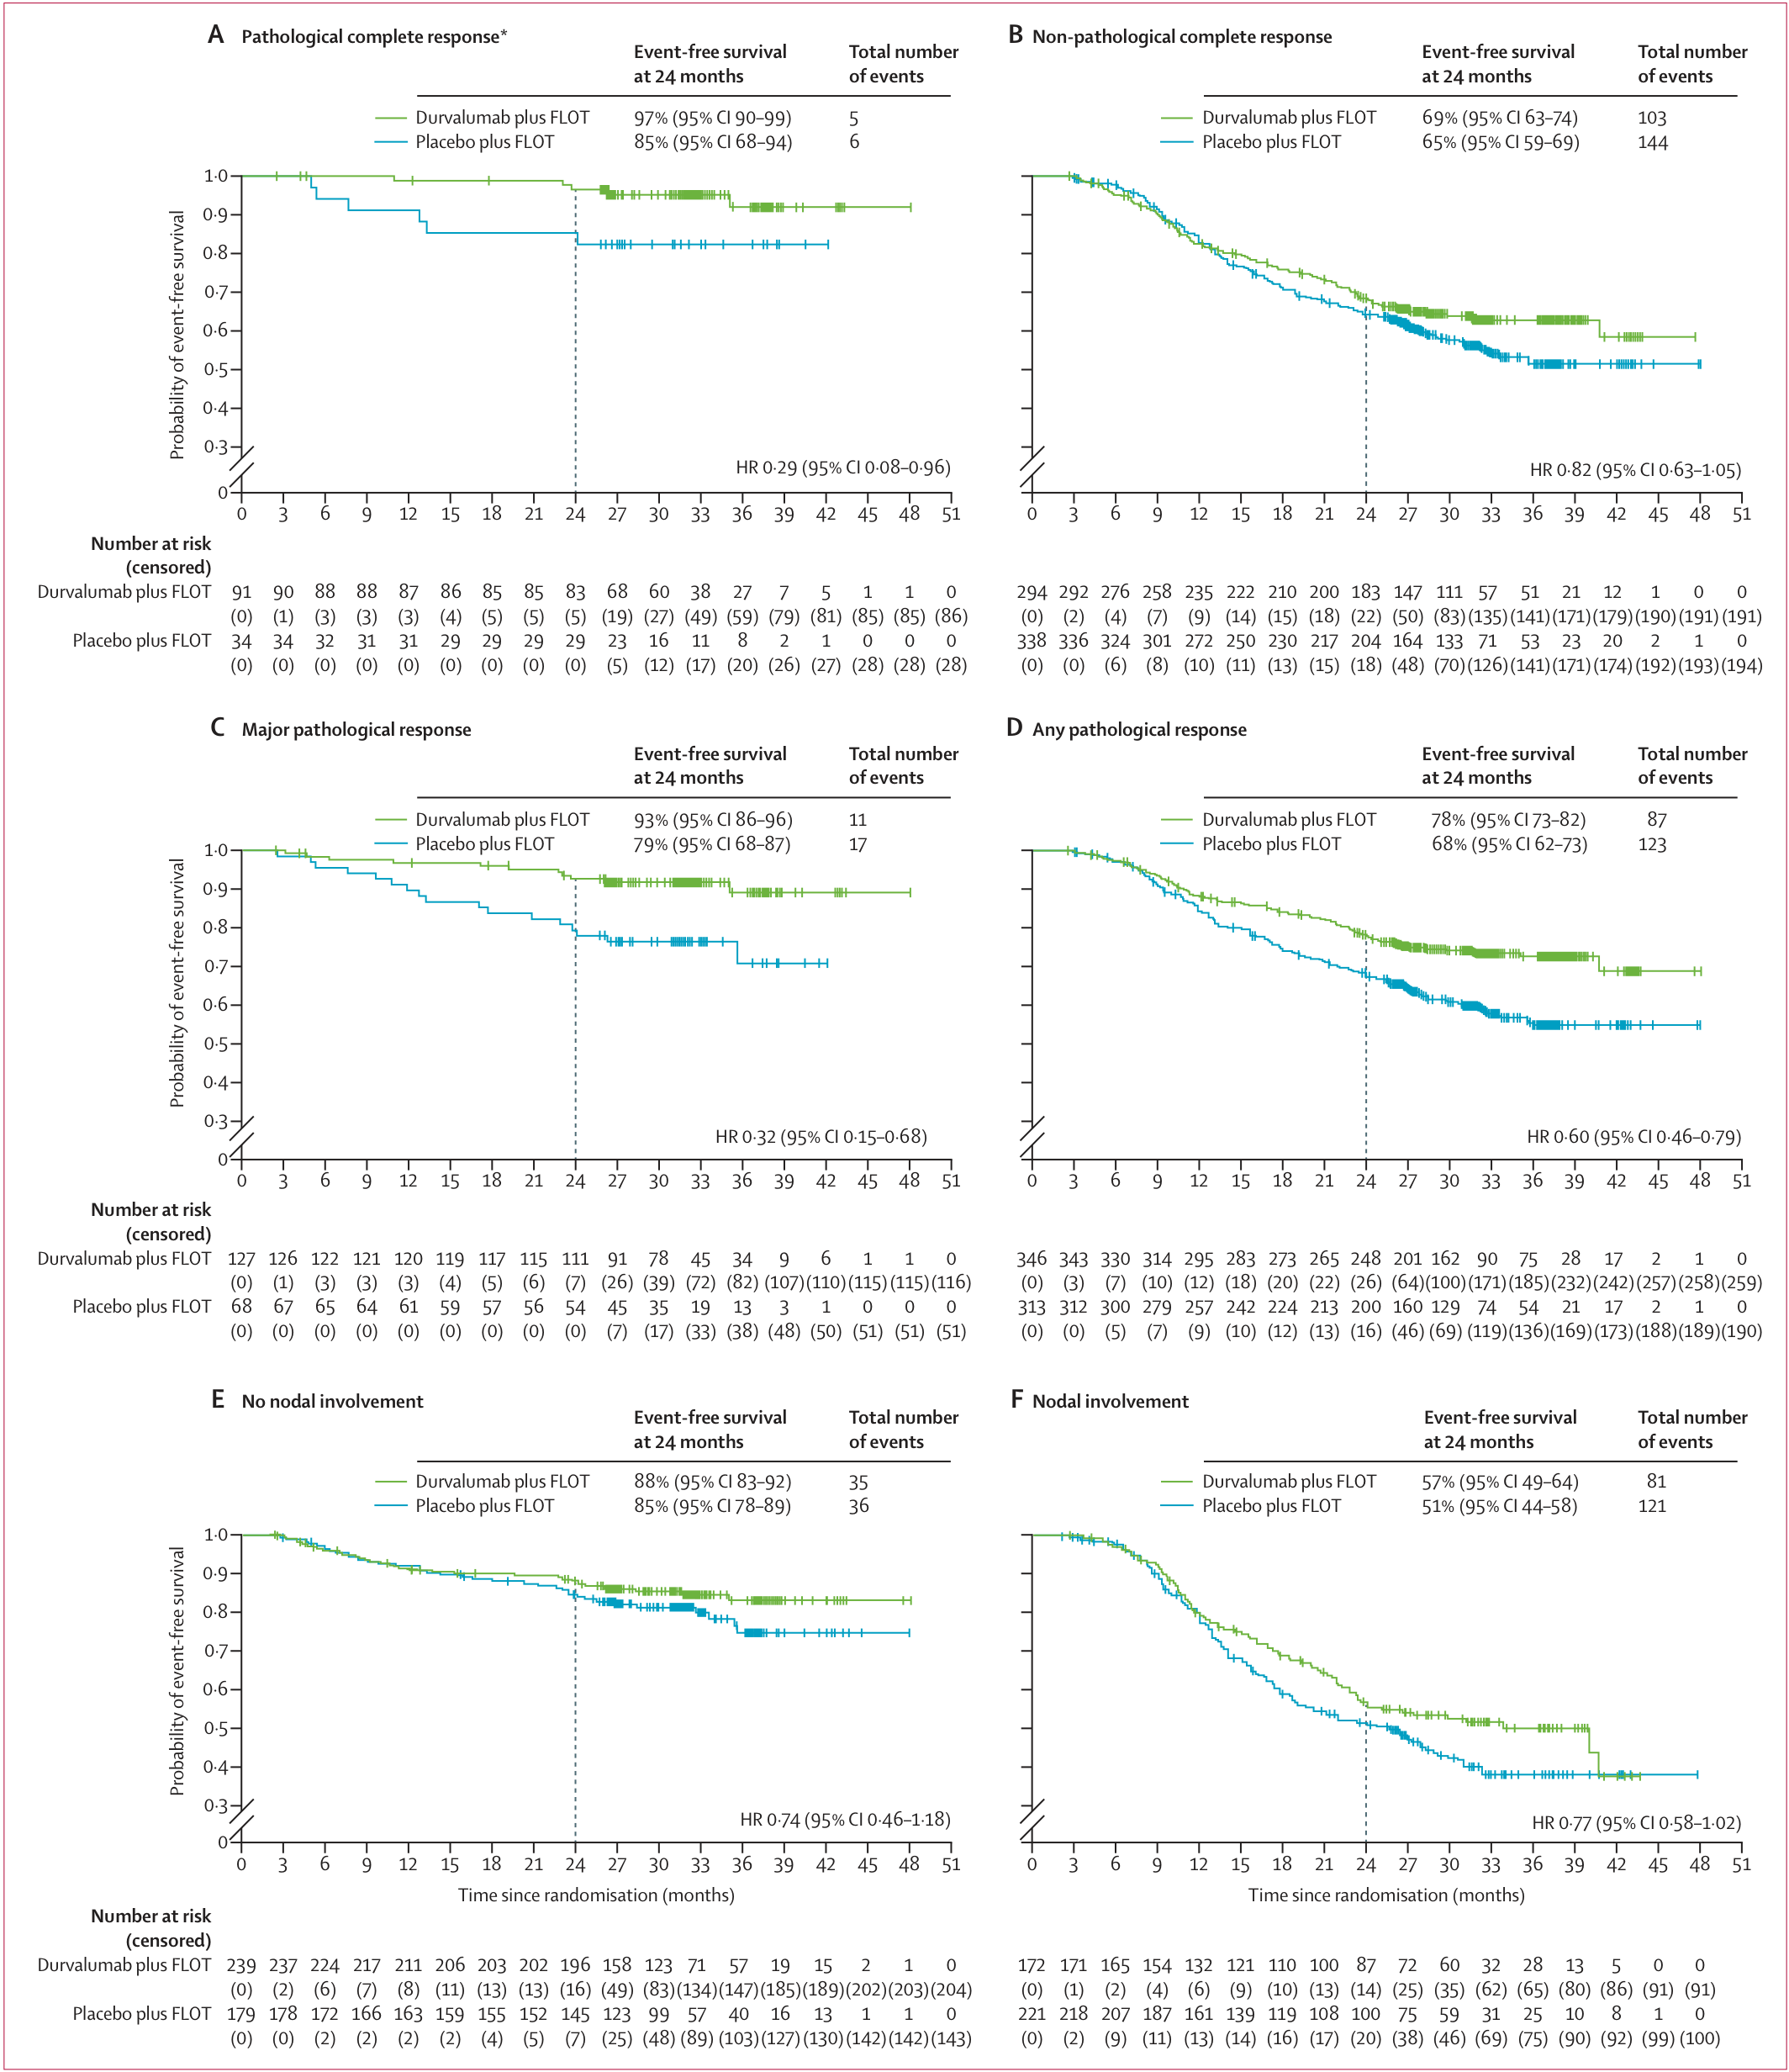
Lancet图3 · PDF第10页,图注见第11页。
这些事后探索分析纳入完成手术且具有可评估标本者。pCR组有11个EFS事件;未出现任何病理缓解者HR为1.27(0.71–2.25)。各病理层次的估计精度和统计显著性存在差异。
亚组与适用范围
PD-L1使用TAP评分。TAP≥1%占90%,最终OS HR为0.79(0.63–0.99);TAP<1%仅95例,HR同为0.79,但区间为0.41–1.50,精度明显不同(Lancet图2C–D,第9、11页)。
基线淋巴结阳性与阴性的最终OS HR为0.73与1.01,但交互检验P=0.19,尚未检出明确的组间效应差异。MSI-H仅49例,另有较多未测或不可评估者;排除已知MSI-H后的敏感性分析仍包含状态未明确者。组织学亚组为事后分析,且无中央确认(NEJM表1、图2;Lancet第6–8、11、14页)。
安全性与治疗完成
| 指标 | 度伐利尤单抗+FLOT(n=475) | 安慰剂+FLOT(n=469) |
|---|---|---|
| 最高3或4级不良事件 | 340(71.6%) | 334(71.2%) |
| 严重不良事件 | 229(48.2%) | 207(44.1%) |
| 导致任一试验治疗停用的不良事件 | 142(29.9%) | 107(22.8%) |
| 任意级别免疫介导不良事件 | 110(23.2%) | 34(7.2%) |
| 3或4级免疫介导不良事件 | 34(7.2%) | 17(3.6%) |
来源:NEJM表2,第12页;Lancet表2,第12–13页重报同一截止日期的数据,并增加部分细目。安全性按实际用药分组,一位安慰剂分组患者实际接受过一次度伐利尤单抗,因此不同于ITT的474/474。
总体3/4级事件比例接近,免疫介导事件与停药比例较高。Lancet表2另列可能与任一试验治疗相关的致死事件6对2例;各药物归因可以重叠。
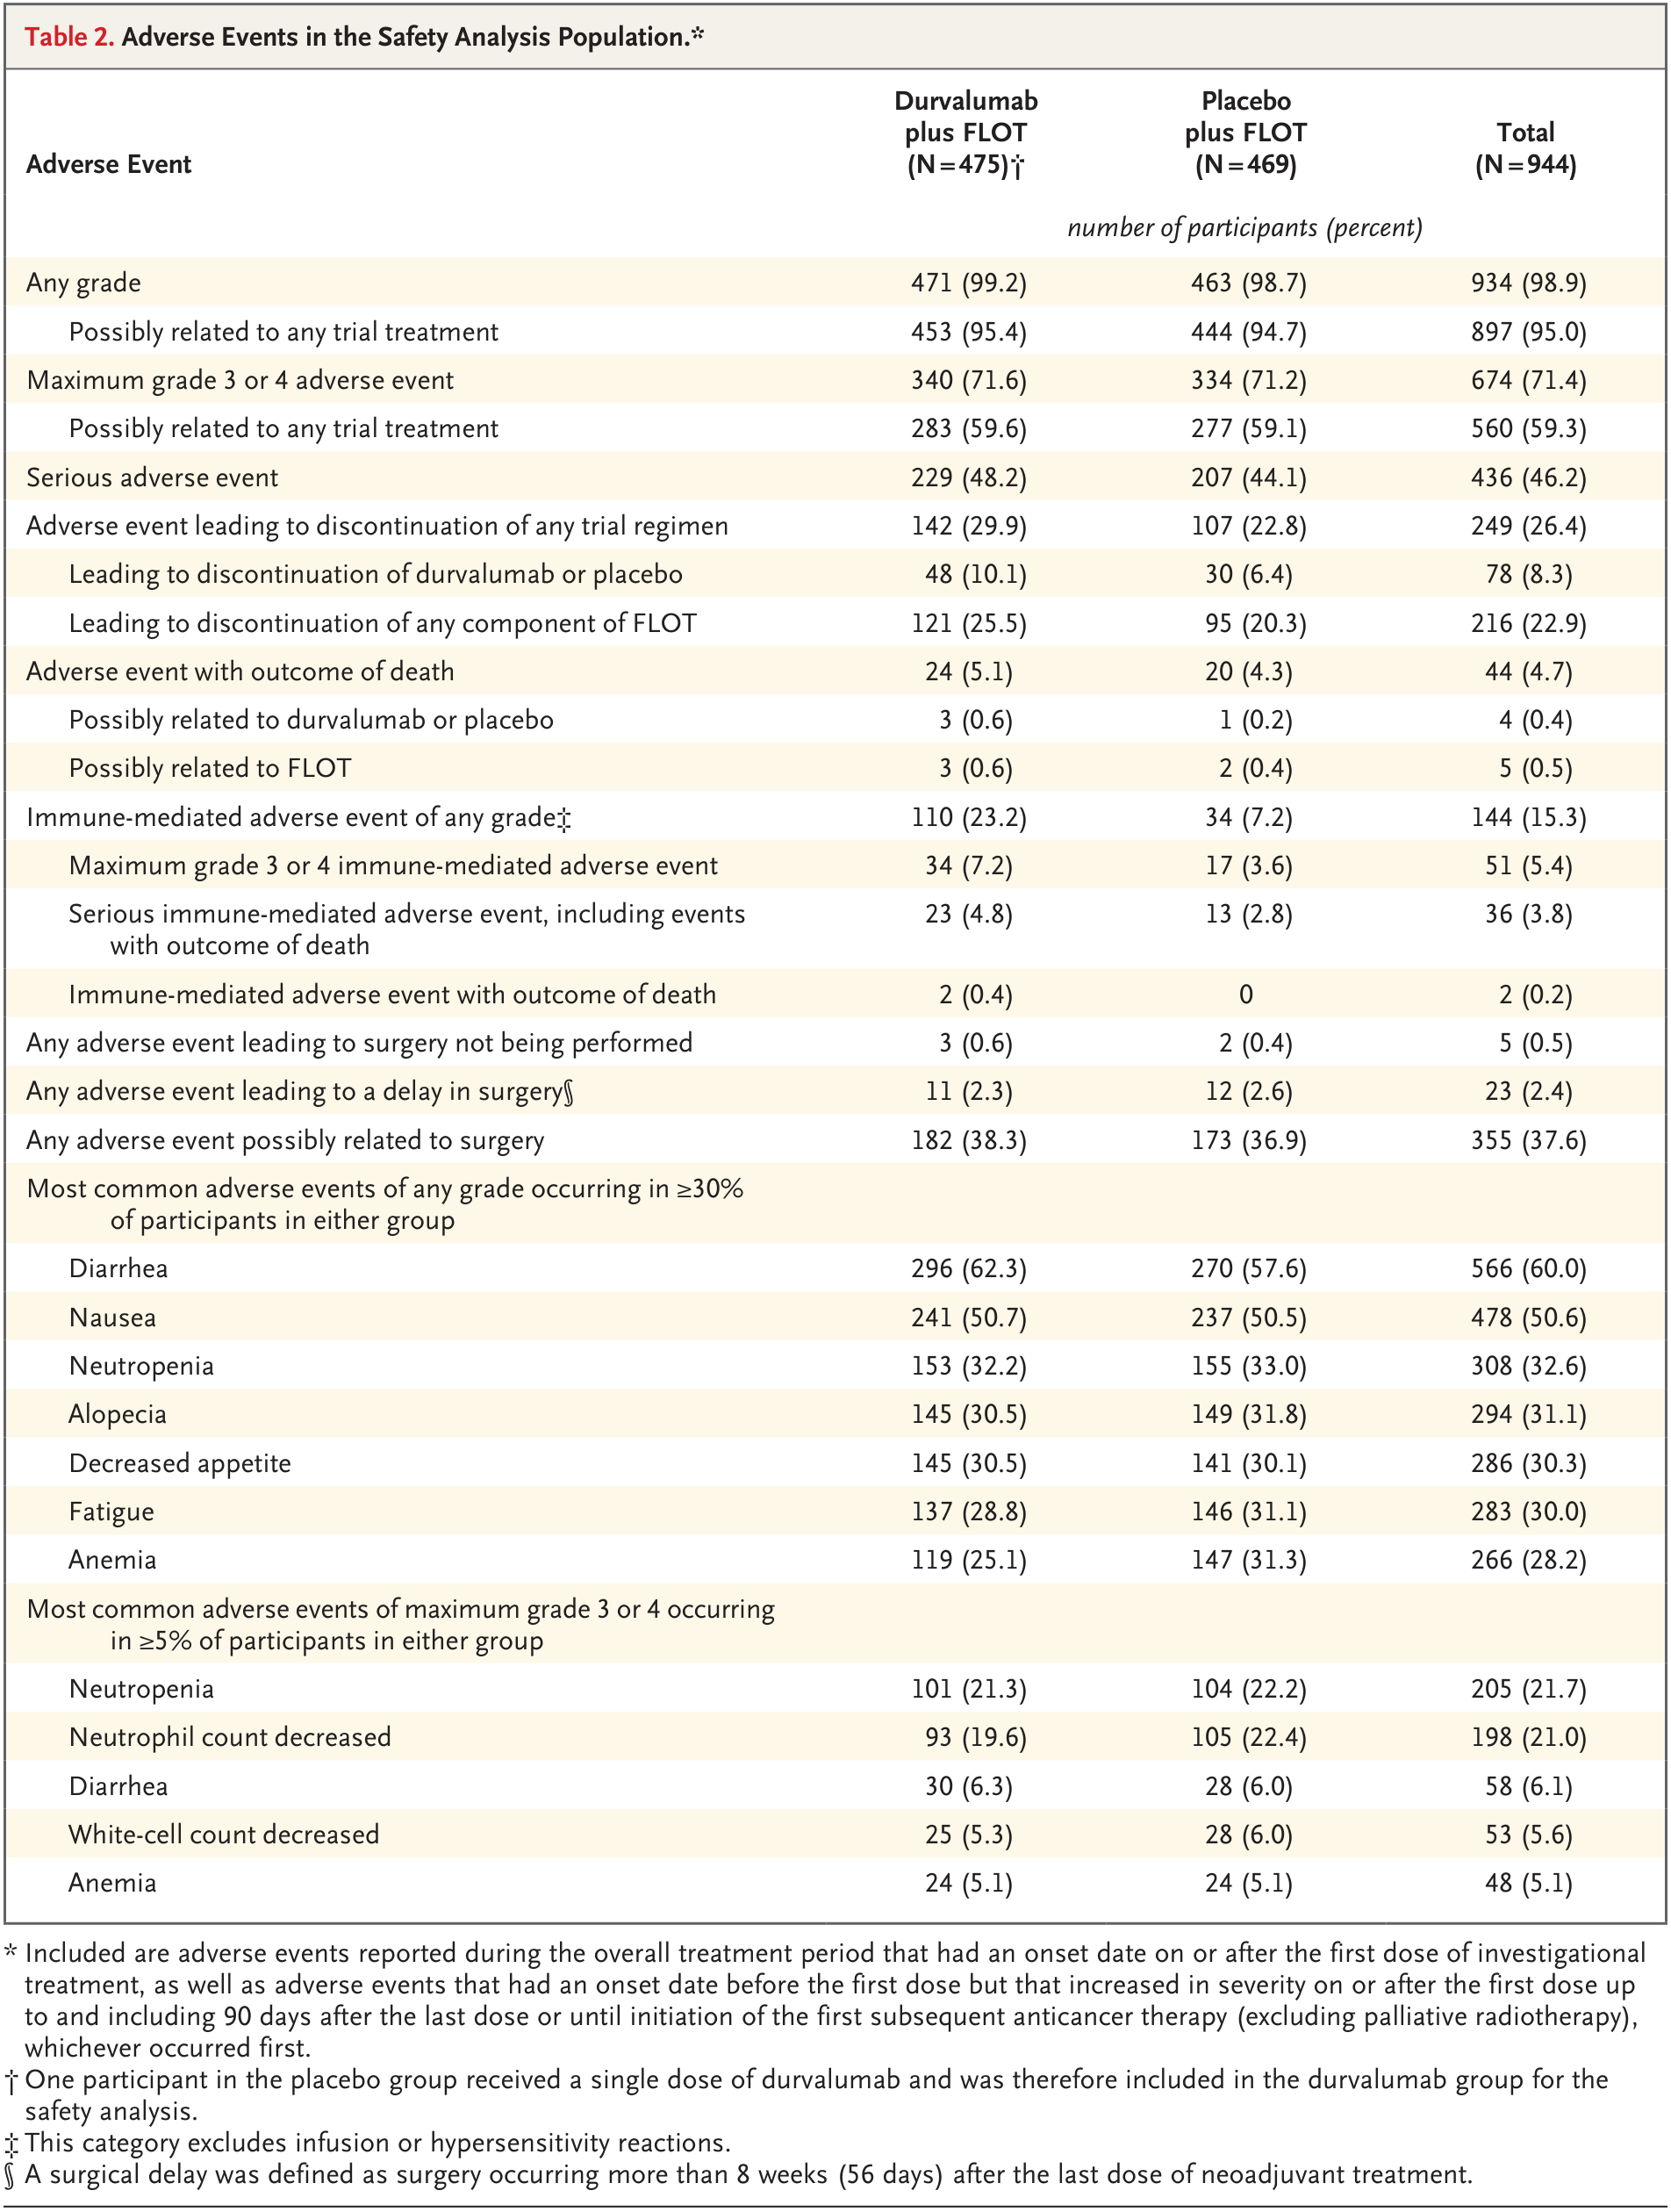
NEJM表2 · PDF第12页。
完成手术为412/474(86.9%)对400/474(84.4%);R0切除率91.5%对92.3%的分母是完成手术者。全部术后免疫/安慰剂完成248/474(52.3%)对245/474(51.7%)。EFS/OS结果采用包括未完成疗程患者在内的随机分组比较(NEJM第5、8页)。
结论、局限与未解决问题
两次报告共同支持完整围手术期度伐利尤单抗+FLOT方案改善EFS、pCR和最终OS。术前与术后的各自贡献、最小有效疗程仍待专门比较。
病理分层发生在治疗后,可评估患者的选择影响组间可比性,pCR亚组事件数也较少。病理缓解作为OS替代终点、据此省略术后治疗或缩短疗程的策略均需专门检验。PD-L1低表达和MSI-H等亚组样本有限,尚缺足够精确的效应估计(NEJM第3–5、7页;Lancet第6–11、14页)。
两篇均由AstraZeneca资助,资助方参与设计、分析和写作。2026论文关于“KEYNOTE-585未使用FLOT”的概括过宽:其最终报告摘要列有804例主队列及203例FLOT队列。不同试验还存在人群、设计与治疗安排差异,FLOT对免疫联合获益的独立贡献仍需直接比较。
本次已核读NEJM 14页及Lancet 15页主文和全部主图表;独立附录、实施版方案/SAP未取得。具体版本差异与待核对问题保留在下方阅读记录。
主图与表格 · 15 张
2025 · Figure 1: Event-free survival · PDF 第 8 页
Figure 1. Kaplan–Meier Estimates of Event-free Survival (Full Analysis Population). The threshold of significance for this analysis was 0.0239. The analysis was based on blinded independent central review assessments, on local pathological testing (if it was clinically required), or both. The hazard ratio and corresponding confidence interval were estimated from a Cox proportional-hazards model, with adjustments for geographic region, clinical lymph-node status, and programmed death ligand 1 (PD-L1) expression. The confidence interval for the hazard ratio was calculated with the use of a profile likelihood approach. A hazard ratio of less than 1 favored durvalumab. A two-sided P value was calculated with a stratified log-rank test with adjustments for geographic region, clinical lymph-node status, and PD-L1 expression. At the data-cutoff date, in the event-free survival analysis, data from three participants (0.6%) in the durvalumab group and seven participants (1.5%) in the placebo group were censored at the ran domization date because of a missing disease assessment before or after the start of neoadjuvant treatment (surgery was not attempt ed, and they did not die or have a non-RECIST progression); data from three participants (0.6%) and six participants (1.3%), respective ly, were censored at the surgery date because of a missing adjuvant postsurgery baseline assessment; and data from eight participants (1.7%) and six participants (1.3%) who withdrew consent were censored at the last disease assessment available before withdrawal from the trial (Table S6). Tick marks indicate censored observations. CI denotes confidence interval, FLOT fluorouracil, leucovorin, oxaliplatin, and docetaxel, and NR not reached.
2025 · Figure 2: EFS subgroups · PDF 第 9 页
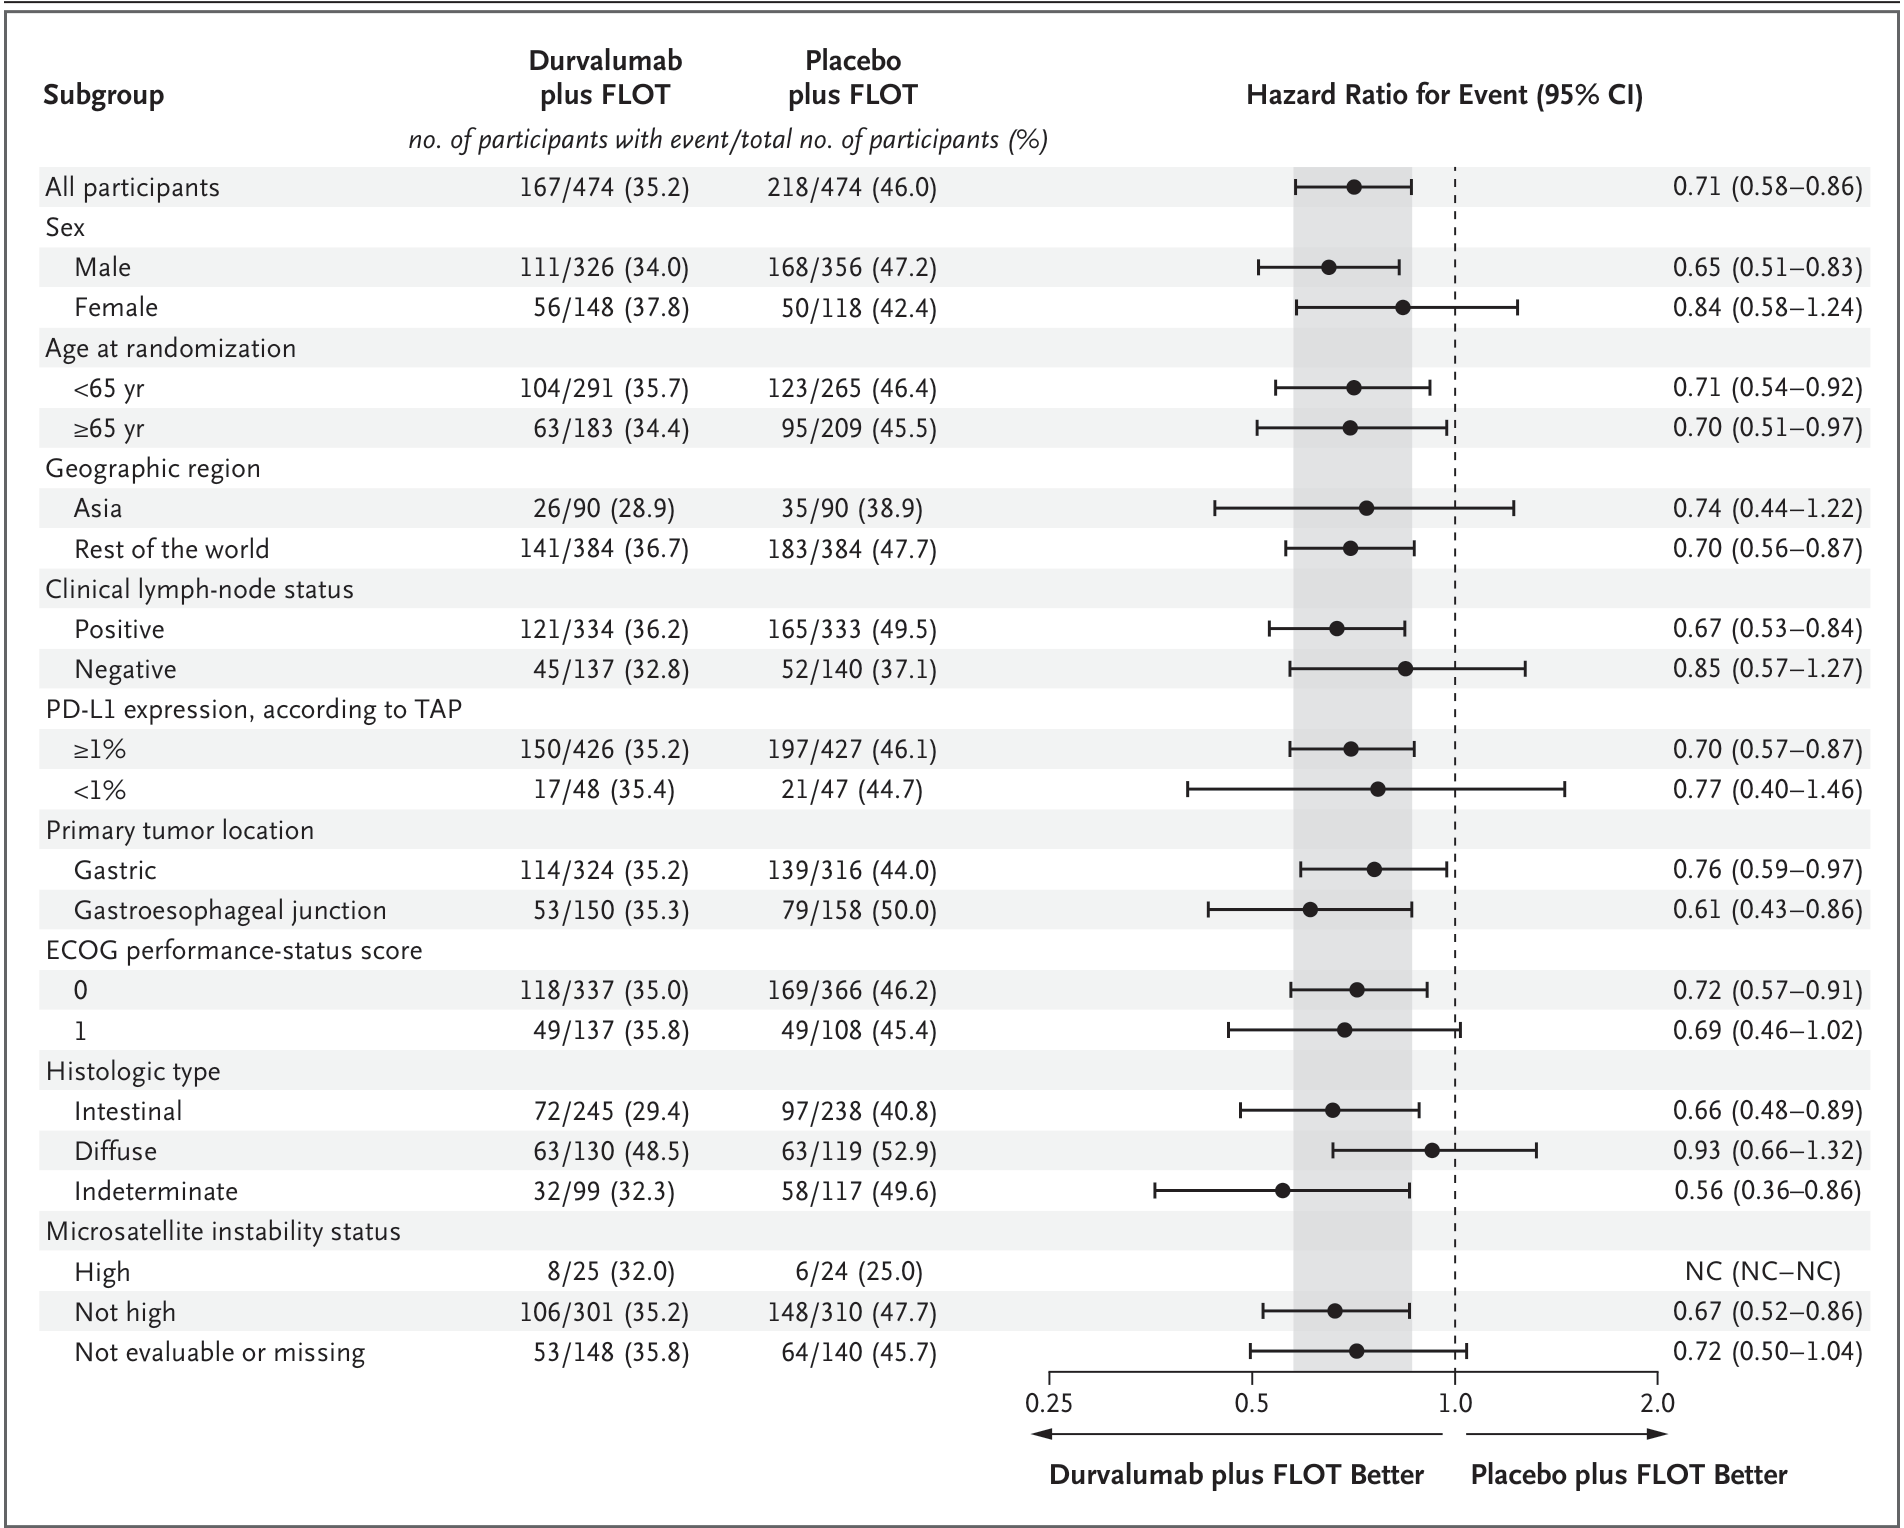
Figure 2. Event-free Survival in Participant Subgroups (Full Analysis Population). Subgroups defined according to sex, age at randomization, geographic region, clinical lymph-node status, PD-L1 expression, tumor lo cation, and Eastern Cooperative Oncology Group (ECOG) performance-status score were prespecified in the protocol. ECOG performance- status scores range from 0 to 5, with higher scores indicating greater disability. The analysis was performed with a Cox proportional- hazards model with treatment as the only covariate. A hazard ratio of less than 1 favored durvalumab. The confidence interval was cal culated with the use of a profile likelihood approach. Because event-free survival, overall survival, and pathological complete response were the only end points that were part of the multiple testing procedure, the widths of the confidence intervals for other end points or subgroups have not been adjusted for multiplicity and may not be used in place of hypothesis testing. The gray band represents the 95% confidence interval for the hazard ratio calculated for all participants. The analysis was based on blinded independent central review assessment, on local pathological testing (if clinically required), or both. The proportional-hazards assumption that included the interac tion of time by treatment in general was tested and was satisfied for most event-free survival subgroups (see Fig. S5 in the Supplemen tary Appendix). PD-L1 expression was assessed according to the Tumor Area Positivity (TAP) score,19 which is determined by visual aggregation and estimation of the area covered by PD-L1 positive tumor cells and tumor-associated immune cells relative to the total tumor area on the immunohistochemical slide. NC denotes not calculable.
2025 · Figure 3: Interim overall survival and pCR · PDF 第 10 页
Figure 3. Kaplan–Meier Estimates of Overall Survival and Pathological Complete Response (Full Analysis Population). Panel A shows Kaplan–Meier estimates of overall survival calculated with an unstratified Cox proportional-hazards model. A hazard ratio of less than 1 favors durvalumab plus FLOT. The threshold of significance for this analysis was P<0.0001. Tick marks indicate censored observations. The two-sided P value was calculated with a stratified log-rank test with adjustments for geographic region, clinical lymph-node status, and PD-L1 expression. Data from 9 participants (1.9%) in the durvalumab group and 17 participants (3.6%) in the placebo group were censored because the participants withdrew from the trial before death; the data were censored at the last date at which the participants were known to be alive (Table S6). Some of these participants were able to be followed for survival status after having withdrawn from the trial; if not, where applicable, survival status was checked from publicly available death registries. Panel B shows the percentages of participants in each group who had a pathological complete response. The threshold of significance for this analysis was P = 0.001 . The analysis for relative risk was performed with a log-binomial regression model with adjustment for stratification factors, which included geographic region, clinical lymph-node status, and PD-L1 expression at randomization. For pathological complete response, 43 participants (9.1%) in the durvalumab group and 46 participants (9.7%) in the placebo group did not have surgery attempted and did not provide a surgical specimen for central assessment of pathological response and were classified as not having had a response; 19 participants (4.0%) and 28 participants (5.9%) in the durvalumab and placebo groups, respectively, had surgery attempted but had a missing sample; and 24 participants (5.1%) and 24 participants (5.1%) had surgery attempted but did not have evaluable samples and were classified as not having had a response (Table S7).
2025 · Table 1, part 1: Baseline characteristics · PDF 第 6 页
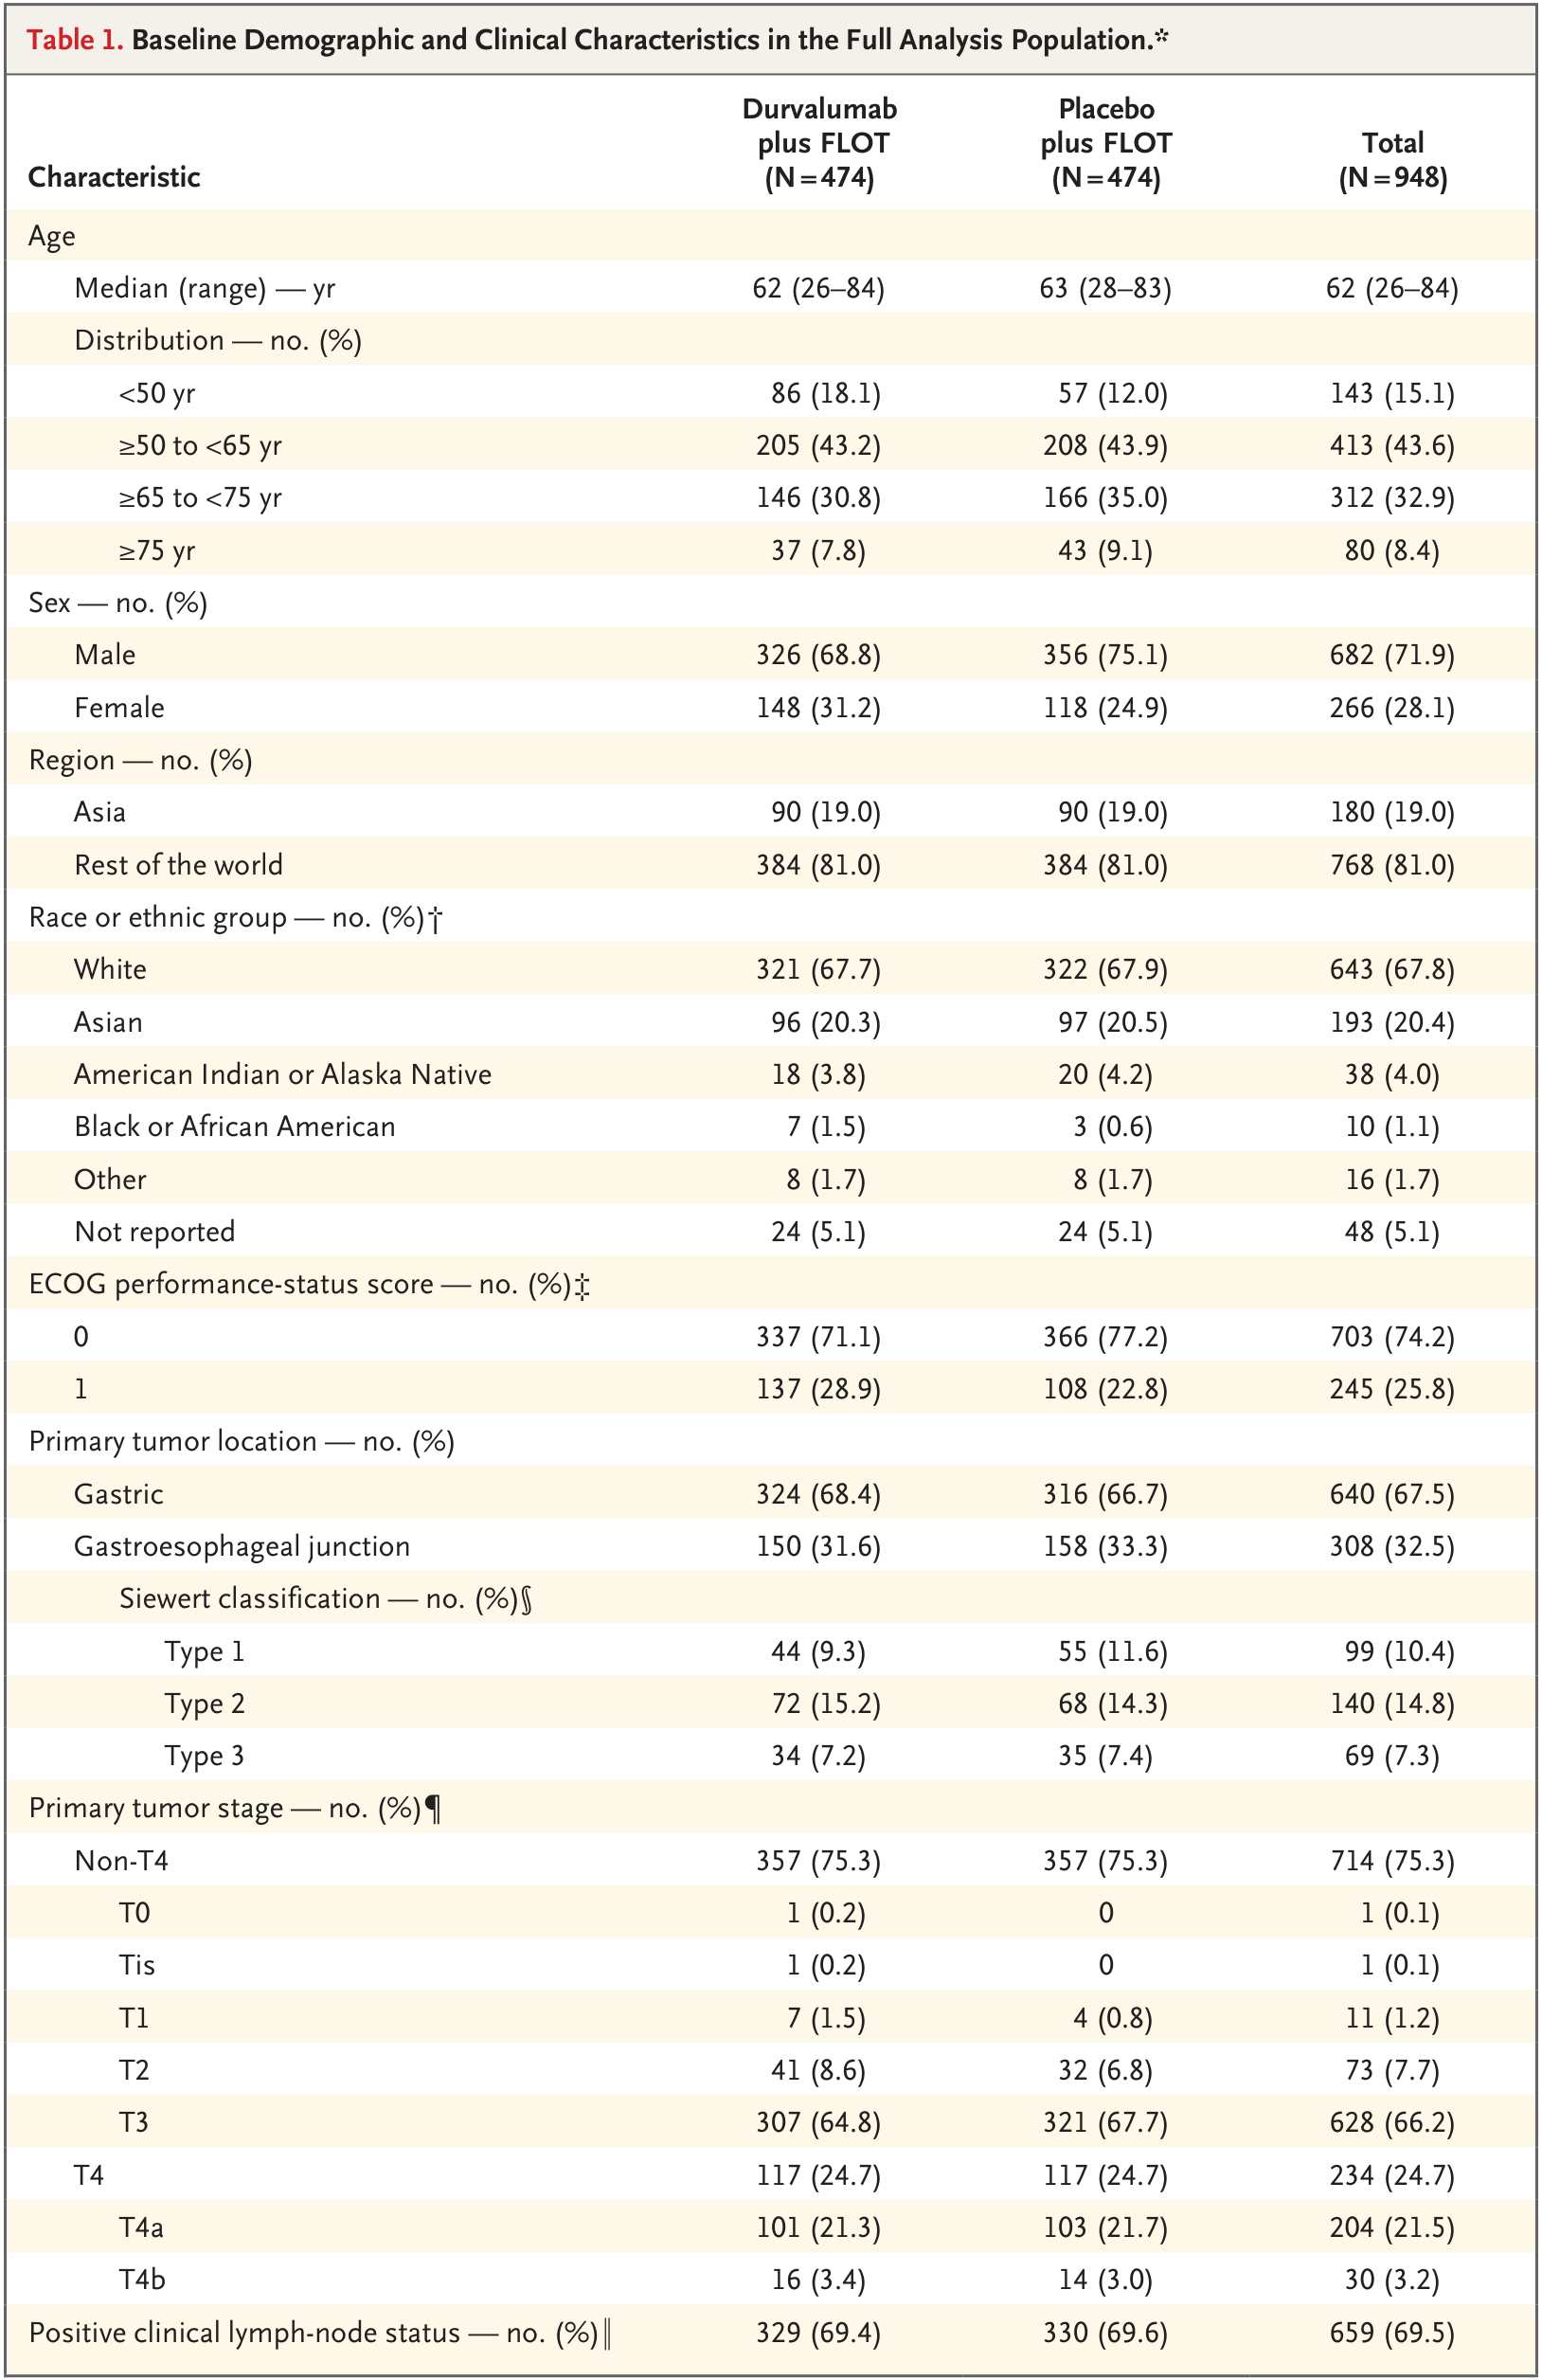
Table 1. Baseline Demographic and Clinical Characteristics in the Full Analysis Population.*
2025 · Table 1, part 2: Baseline characteristics and footnotes · PDF 第 7 页
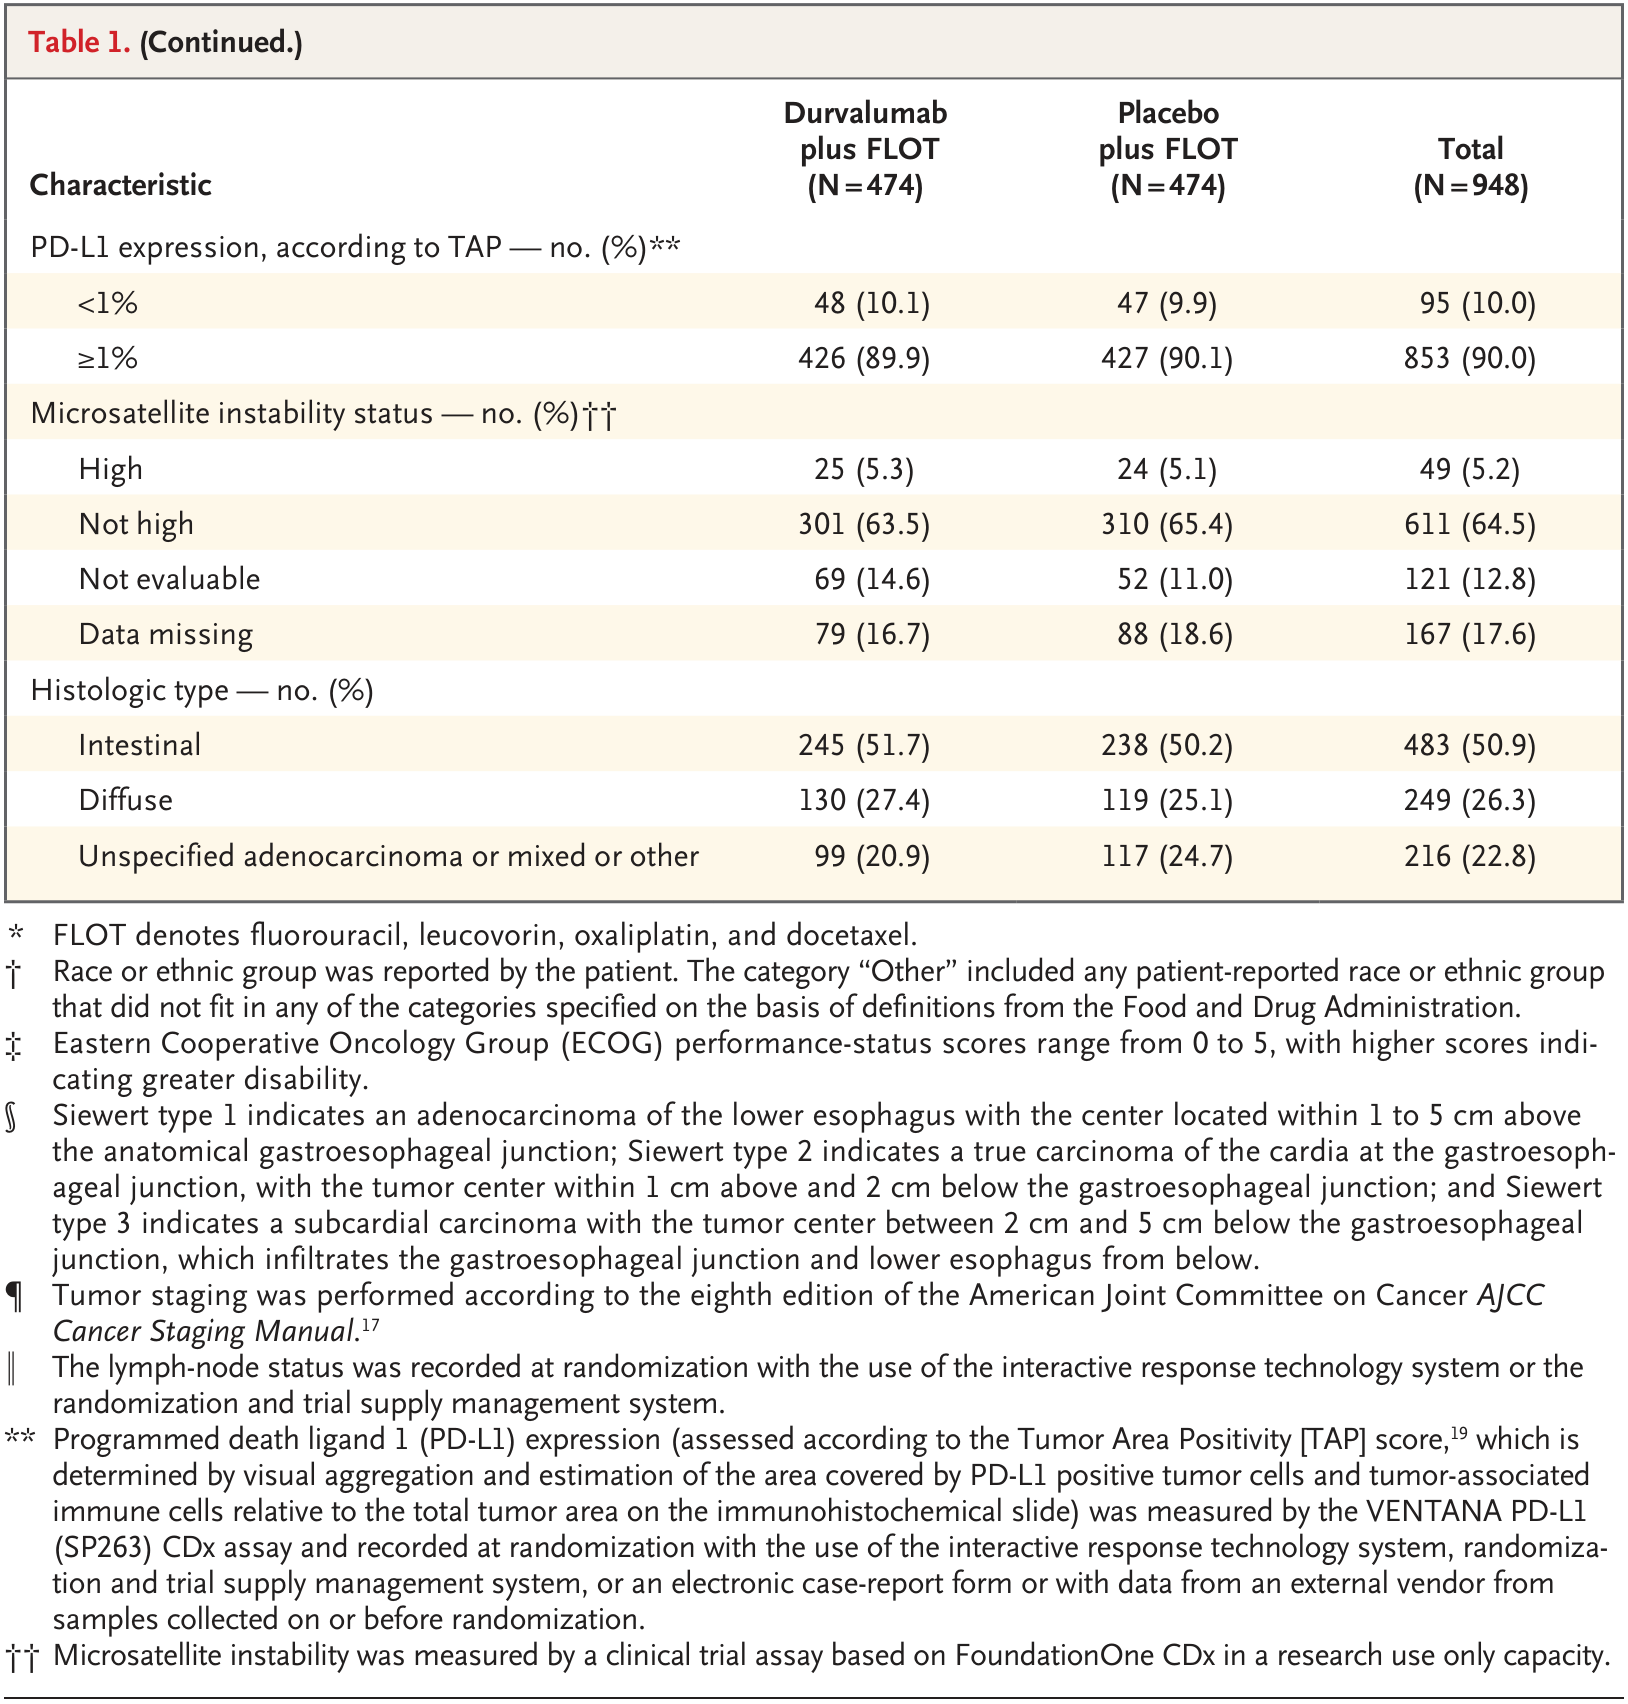
* FLOT denotes fluorouracil, leucovorin, oxaliplatin, and docetaxel. † Race or ethnic group was reported by the patient. The category “Other” included any patient-reported race or ethnic group that did not fit in any of the categories specified on the basis of definitions from the Food and Drug Administration. ‡ Eastern Cooperative Oncology Group (ECOG) performance-status scores range from 0 to 5, with higher scores indi cating greater disability. § Siewert type 1 indicates an adenocarcinoma of the lower esophagus with the center located within 1 to 5 cm above the anatomical gastroesophageal junction; Siewert type 2 indicates a true carcinoma of the cardia at the gastroesoph ageal junction, with the tumor center within 1 cm above and 2 cm below the gastroesophageal junction; and Siewert type 3 indicates a subcardial carcinoma with the tumor center between 2 cm and 5 cm below the gastroesophageal junction, which infiltrates the gastroesophageal junction and lower esophagus from below. ¶ Tumor staging was performed according to the eighth edition of the American Joint Committee on Cancer AJCC Cancer Staging Manual.17 ‖ The lymph-node status was recorded at randomization with the use of the interactive response technology system or the randomization and trial supply management system. ** Programmed death ligand 1 (PD-L1) expression (assessed according to the Tumor Area Positivity [TAP] score,19 which is determined by visual aggregation and estimation of the area covered by PD-L1 positive tumor cells and tumor-associated immune cells relative to the total tumor area on the immunohistochemical slide) was measured by the VENTANA PD-L1 (SP263) CDx assay and recorded at randomization with the use of the interactive response technology system, randomiza tion and trial supply management system, or an electronic case-report form or with data from an external vendor from samples collected on or before randomization. †† Microsatellite instability was measured by a clinical trial assay based on FoundationOne CDx in a research use only capacity.
2025 · Table 2: Adverse events · PDF 第 12 页
* Included are adverse events reported during the overall treatment period that had an onset date on or after the first dose of investigational treatment, as well as adverse events that had an onset date before the first dose but that increased in severity on or after the first dose up to and including 90 days after the last dose or until initiation of the first subsequent anticancer therapy (excluding palliative radiotherapy), whichever occurred first. † One participant in the placebo group received a single dose of durvalumab and was therefore included in the durvalumab group for the safety analysis. ‡ This category excludes infusion or hypersensitivity reactions. § A surgical delay was defined as surgery occurring more than 8 weeks (56 days) after the last dose of neoadjuvant treatment.
2026 · Figure 1, part 1 · PDF 第 4 页
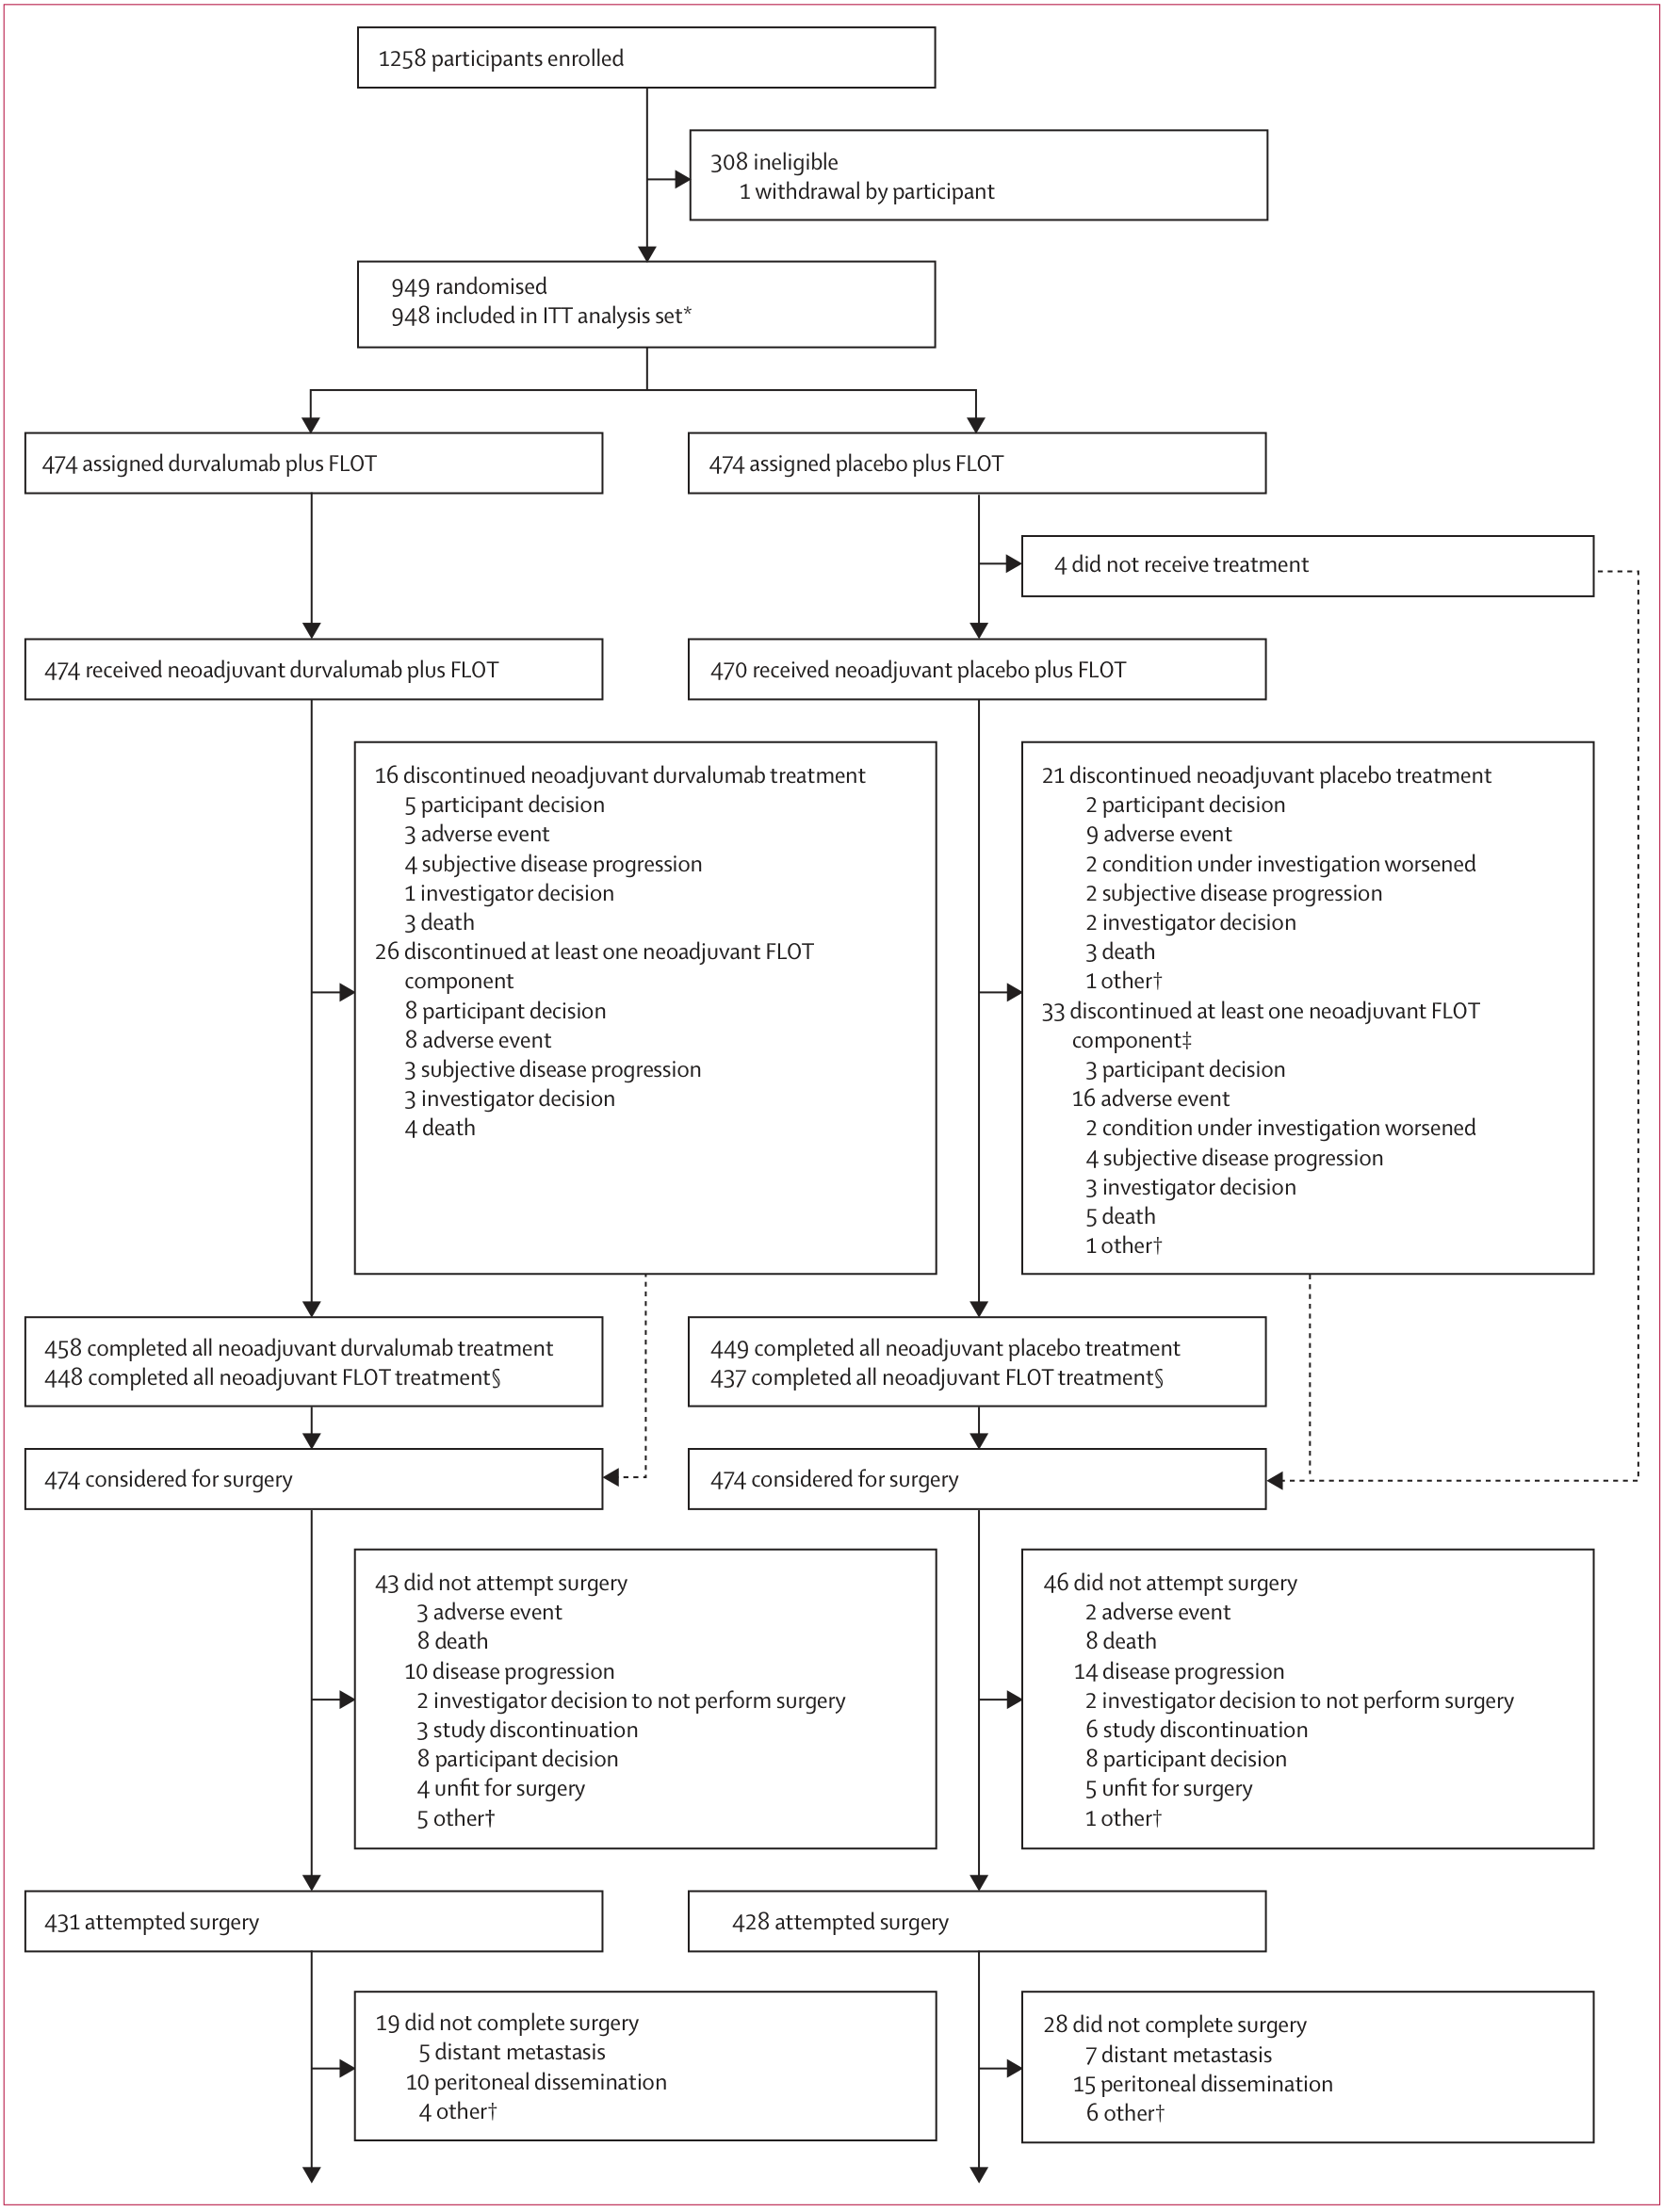
Figure 1: Trial profile Data cutoff: Dec 20, 2024. From The New England Journal of Medicine, Janjigian YY, Al-Batran SE, Wainberg ZA, Muro K, Molena D, Van Cutsem E, Hyung WJ, Wyrwicz L, Oh DY, Omori T, Moehler M, Garrido M, Oliveira SCS, Liberman M, Oliden VC, Smyth EC, Stein A, Bilici M, Alvarenga ML, Kozlov V, Rivera F, Kawazoe A, Serrano O, Heilbron E, Negro A, Kurland JF, Tabernero J, for the MATTERHORN Investigators, Perioperative Durvalumab in Gastric and Gastroesophageal Junction Cancer, 393, 217–230, Copyright © 2025, Massachusetts Medical Society. Reprinted with permission from Massachusetts Medical Society. FLOT=fluorouracil, leucovorin, oxaliplatin, and docetaxel. ITT=intention-to-treat. *One participant was randomised twice in error and excluded at the level of the ITT analysis set. †Reasons are provided in the appendix (pp 8–9). ‡Reasons were not mutually exclusive for participants with multiple reasons, although these were only counted once per category. §Completed all cycles with all FLOT components.
2026 · Figure 1, part 2 · PDF 第 5 页
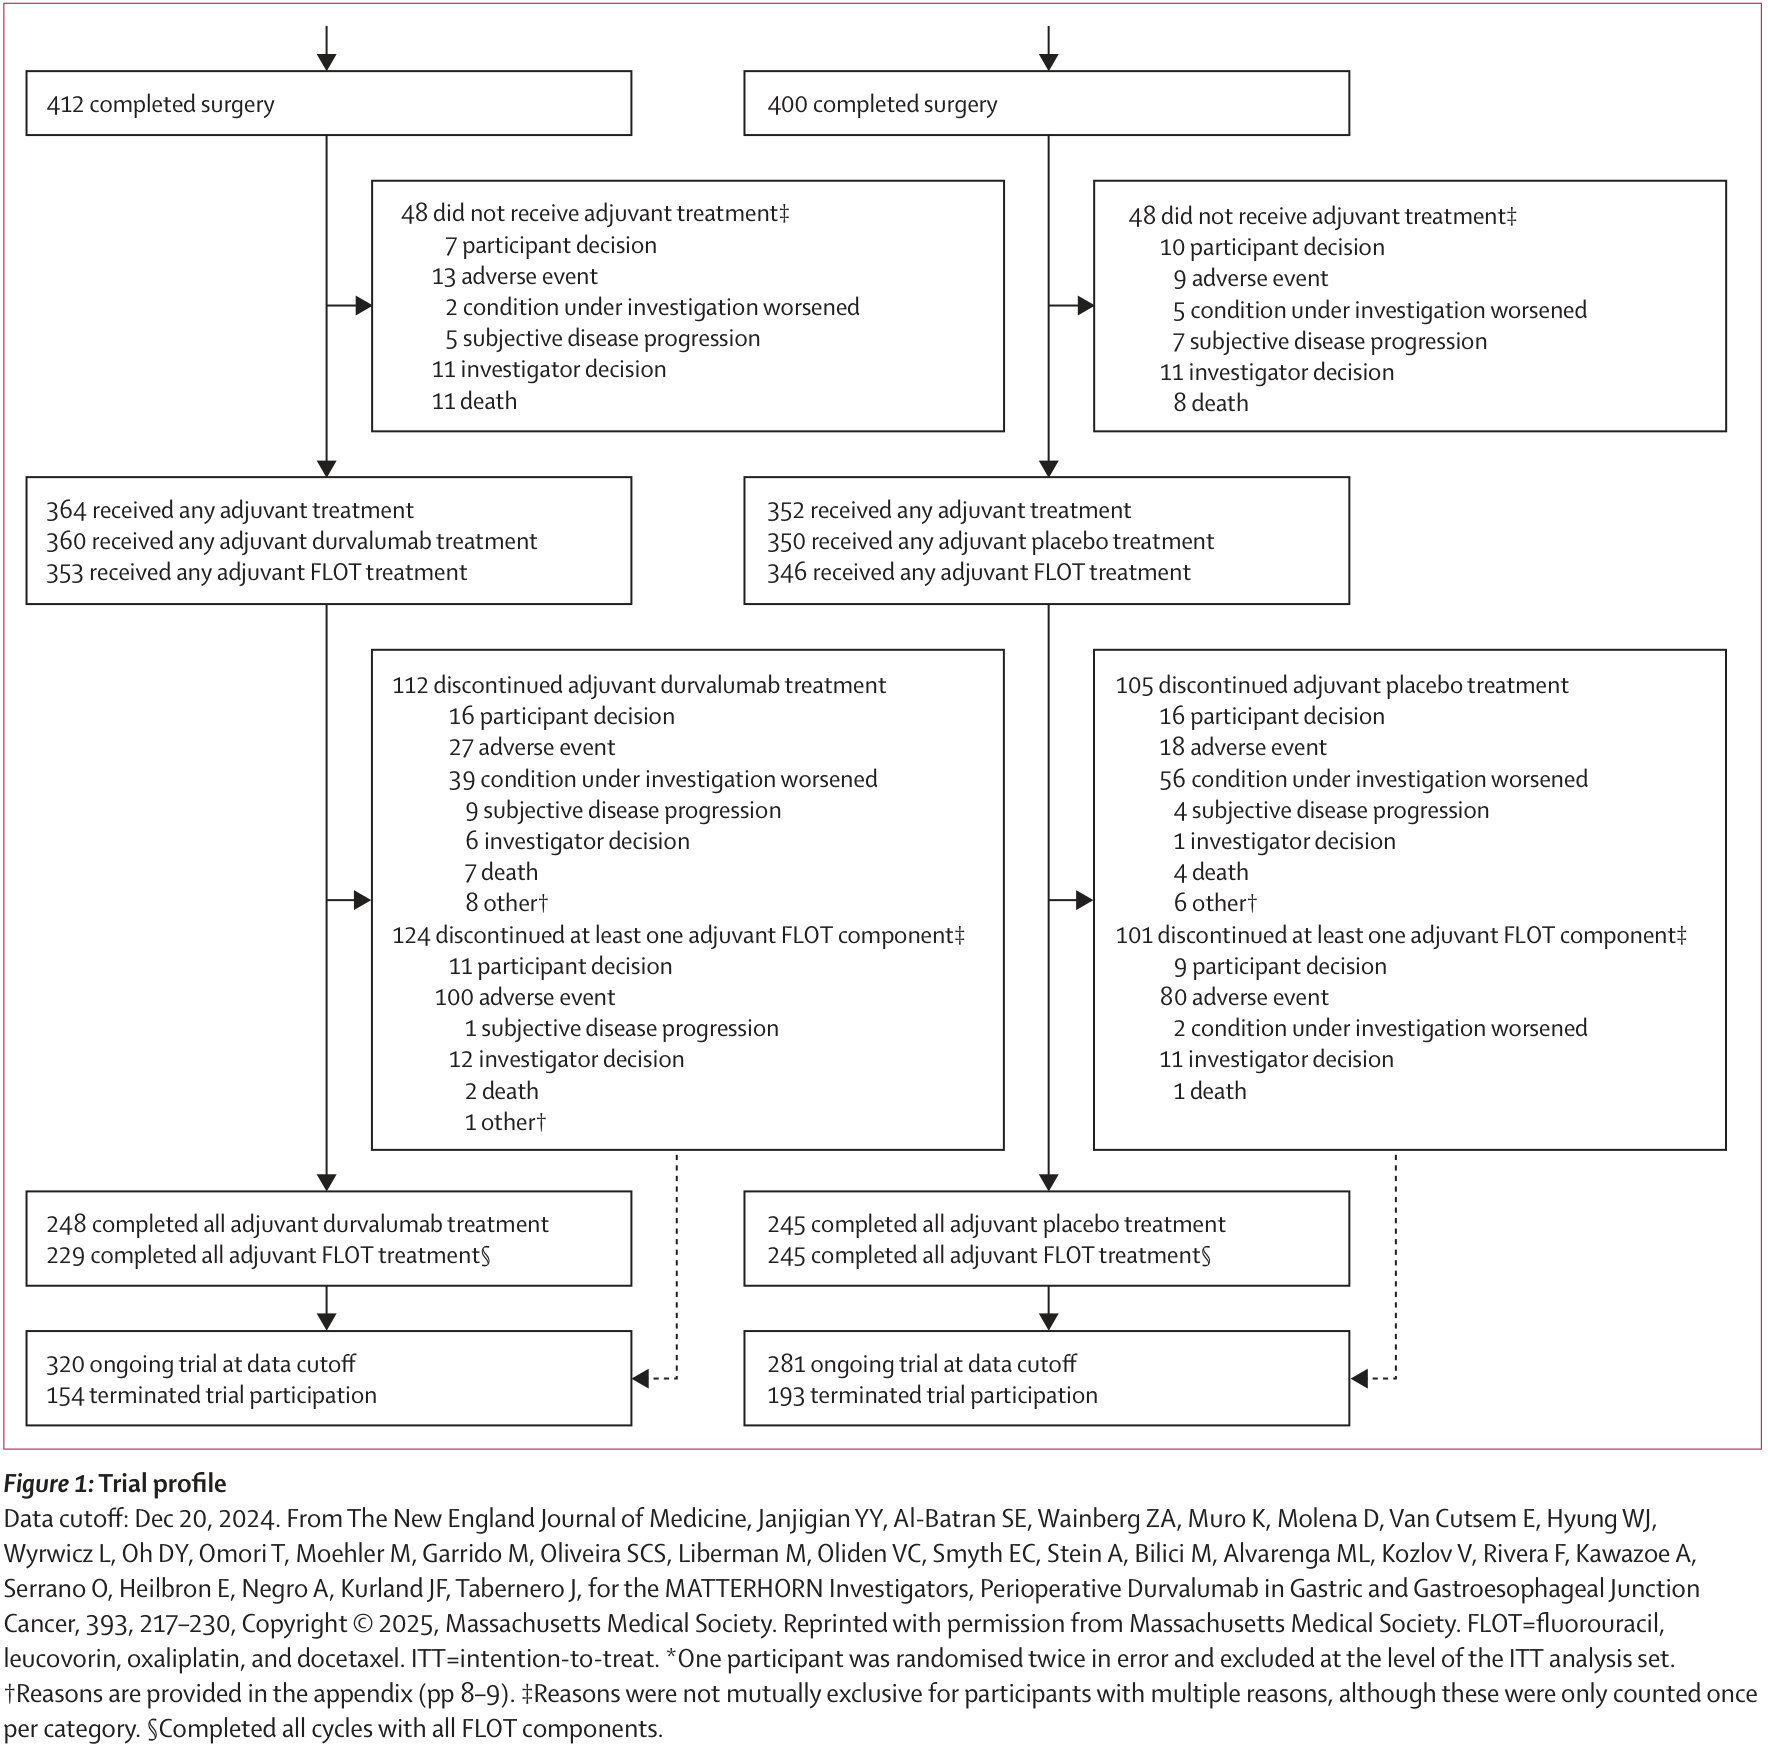
Figure 1: Trial profile Data cutoff: Dec 20, 2024. From The New England Journal of Medicine, Janjigian YY, Al-Batran SE, Wainberg ZA, Muro K, Molena D, Van Cutsem E, Hyung WJ, Wyrwicz L, Oh DY, Omori T, Moehler M, Garrido M, Oliveira SCS, Liberman M, Oliden VC, Smyth EC, Stein A, Bilici M, Alvarenga ML, Kozlov V, Rivera F, Kawazoe A, Serrano O, Heilbron E, Negro A, Kurland JF, Tabernero J, for the MATTERHORN Investigators, Perioperative Durvalumab in Gastric and Gastroesophageal Junction Cancer, 393, 217–230, Copyright © 2025, Massachusetts Medical Society. Reprinted with permission from Massachusetts Medical Society. FLOT=fluorouracil, leucovorin, oxaliplatin, and docetaxel. ITT=intention-to-treat. *One participant was randomised twice in error and excluded at the level of the ITT analysis set. †Reasons are provided in the appendix (pp 8–9). ‡Reasons were not mutually exclusive for participants with multiple reasons, although these were only counted once per category. §Completed all cycles with all FLOT components.
2026 · Figure 2, part 1 · PDF 第 8 页
Figure 2: Overall survival and overall survival among participant subgroups, including participants with PD-L1 TAP ≥1% or <1%, in the durvalumab plus FLOT group versus the placebo plus FLOT group in the ITT population Overall survival (A), subgroup analysis of overall survival (B), and overall survival among participants with PD-L1 TAP ≥1% (C) and PD-L1 TAP <1% (D) in the durvalumab plus FLOT group versus the placebo plus FLOT group. Data cutoff: Sept 1, 2025. An HR of <1 favours durvalumab plus FLOT. (A) Overall survival maturity was 37%. Median overall survival was NR (95% CI NR–NR) in either treatment group. (B) The grey band represents the 95% CI for the HR for the ITT population. (C) Median overall survival was NR (95% CI NR–NR) in either treatment group. (D) Median overall survival in months was NR (95% CI 43·66–NR) with durvalumab plus FLOT and NR (95% CI 21·72–NR) with placebo plus FLOT. ECOG=Eastern Cooperative Oncology Group. FLOT=fluorouracil, leucovorin, oxaliplatin, and docetaxel. HR=hazard ratio. ITT=intention-to-treat. NR=not reached. RMST=restricted mean survival time. TAP=tumour area positivity. *In censored participants.
2026 · Figure 2, part 2 · PDF 第 9 页
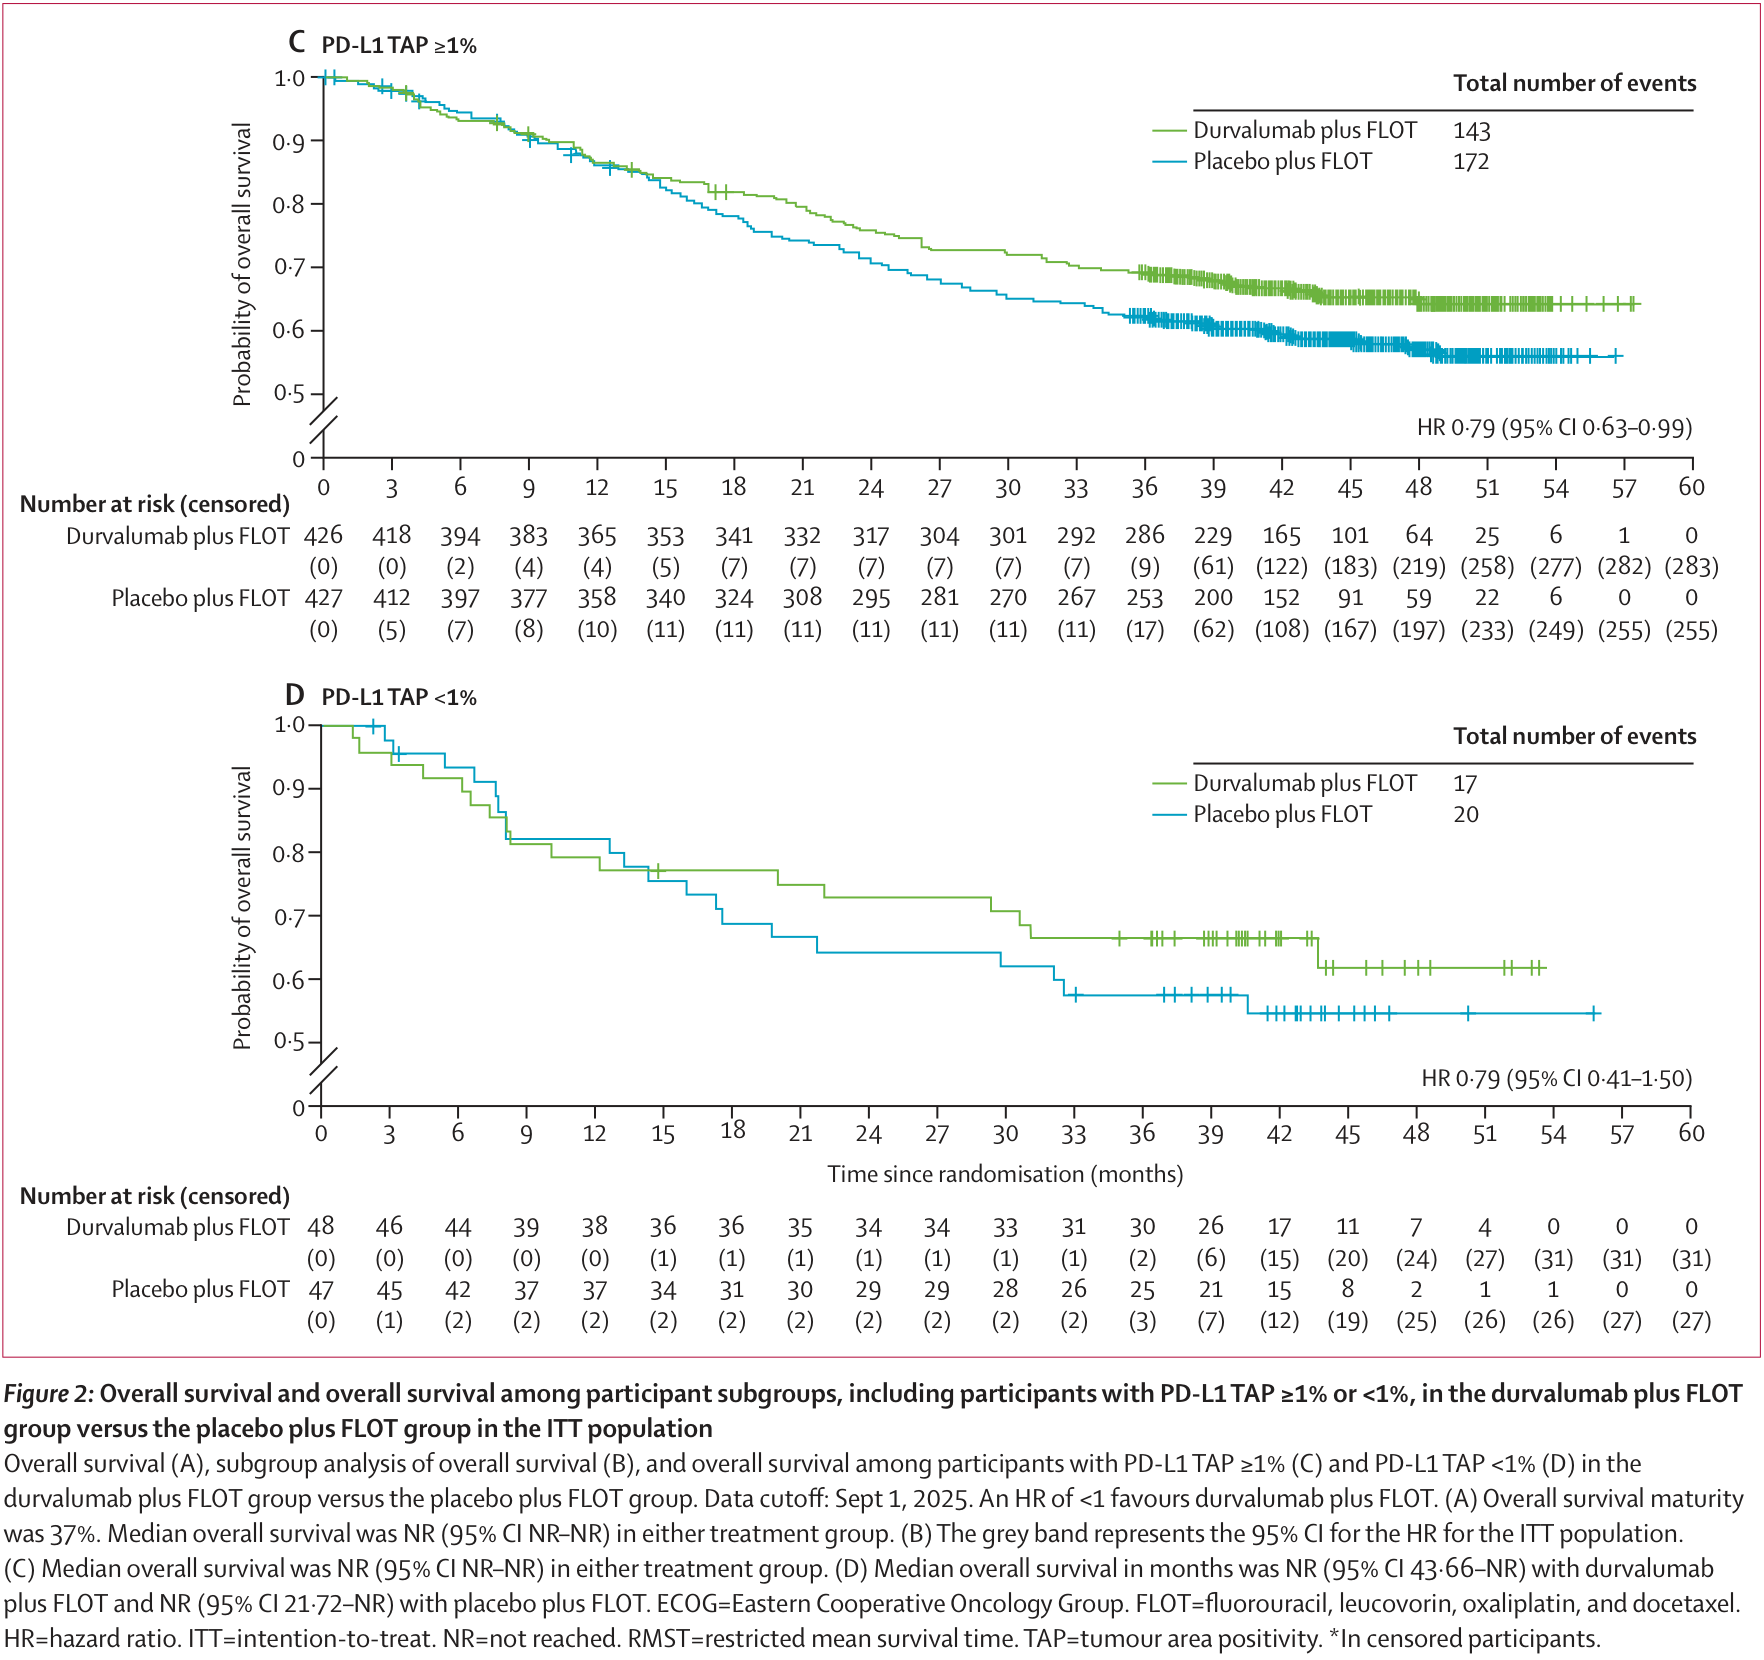
Figure 2: Overall survival and overall survival among participant subgroups, including participants with PD-L1 TAP ≥1% or <1%, in the durvalumab plus FLOT group versus the placebo plus FLOT group in the ITT population Overall survival (A), subgroup analysis of overall survival (B), and overall survival among participants with PD-L1 TAP ≥1% (C) and PD-L1 TAP <1% (D) in the durvalumab plus FLOT group versus the placebo plus FLOT group. Data cutoff: Sept 1, 2025. An HR of <1 favours durvalumab plus FLOT. (A) Overall survival maturity was 37%. Median overall survival was NR (95% CI NR–NR) in either treatment group. (B) The grey band represents the 95% CI for the HR for the ITT population. (C) Median overall survival was NR (95% CI NR–NR) in either treatment group. (D) Median overall survival in months was NR (95% CI 43·66–NR) with durvalumab plus FLOT and NR (95% CI 21·72–NR) with placebo plus FLOT. ECOG=Eastern Cooperative Oncology Group. FLOT=fluorouracil, leucovorin, oxaliplatin, and docetaxel. HR=hazard ratio. ITT=intention-to-treat. NR=not reached. RMST=restricted mean survival time. TAP=tumour area positivity. *In censored participants.
2026 · Figure 3 · PDF 第 10 页
Figure 3: Event-free survival by pathological outcomes and nodal staging in the durvalumab plus FLOT group versus the placebo plus FLOT group in the central pathology analysis set and nodal involvement evaluable analysis set Event-free survival among participants who reached pathological complete response (A), non-pathological complete response (B), major pathological response (C), any pathological response (D), with no nodal involvement (E), and with nodal involvement (F) in the durvalumab plus FLOT group versus the placebo plus FLOT group. Data cutoff: Dec 20, 2024. (A) Median event-free survival was NR (95% CI NR–NR) in either treatment group. (B) Median event- free survival in months was NR (95% CI 40·74–NR) with durvalumab plus FLOT and NR (95% CI 32·20–NR) with placebo plus FLOT. (C) Median event-free survival was NR (95% CI NR–NR) in either treatment group. (D) Median event- free survival in months was NR (95% CI NR–NR) with durvalumab plus FLOT and NR (95% CI 35·65–NR) with placebo plus FLOT. (E) Median event-free survival was NR (95% CI NR–NR) in either treatment group. (F) Median event-free survival in months was 33·84 (95% CI 23·33–NR) with durvalumab plus FLOT and 25·56 (95% CI 18·83–29·14) with placebo plus FLOT. FLOT=fluorouracil, leucovorin, oxaliplatin, and docetaxel. HR=hazard ratio. NR=not reached. *Analysis based on a total of 11 events.
2026 · Table 1, part 1 · PDF 第 6 页
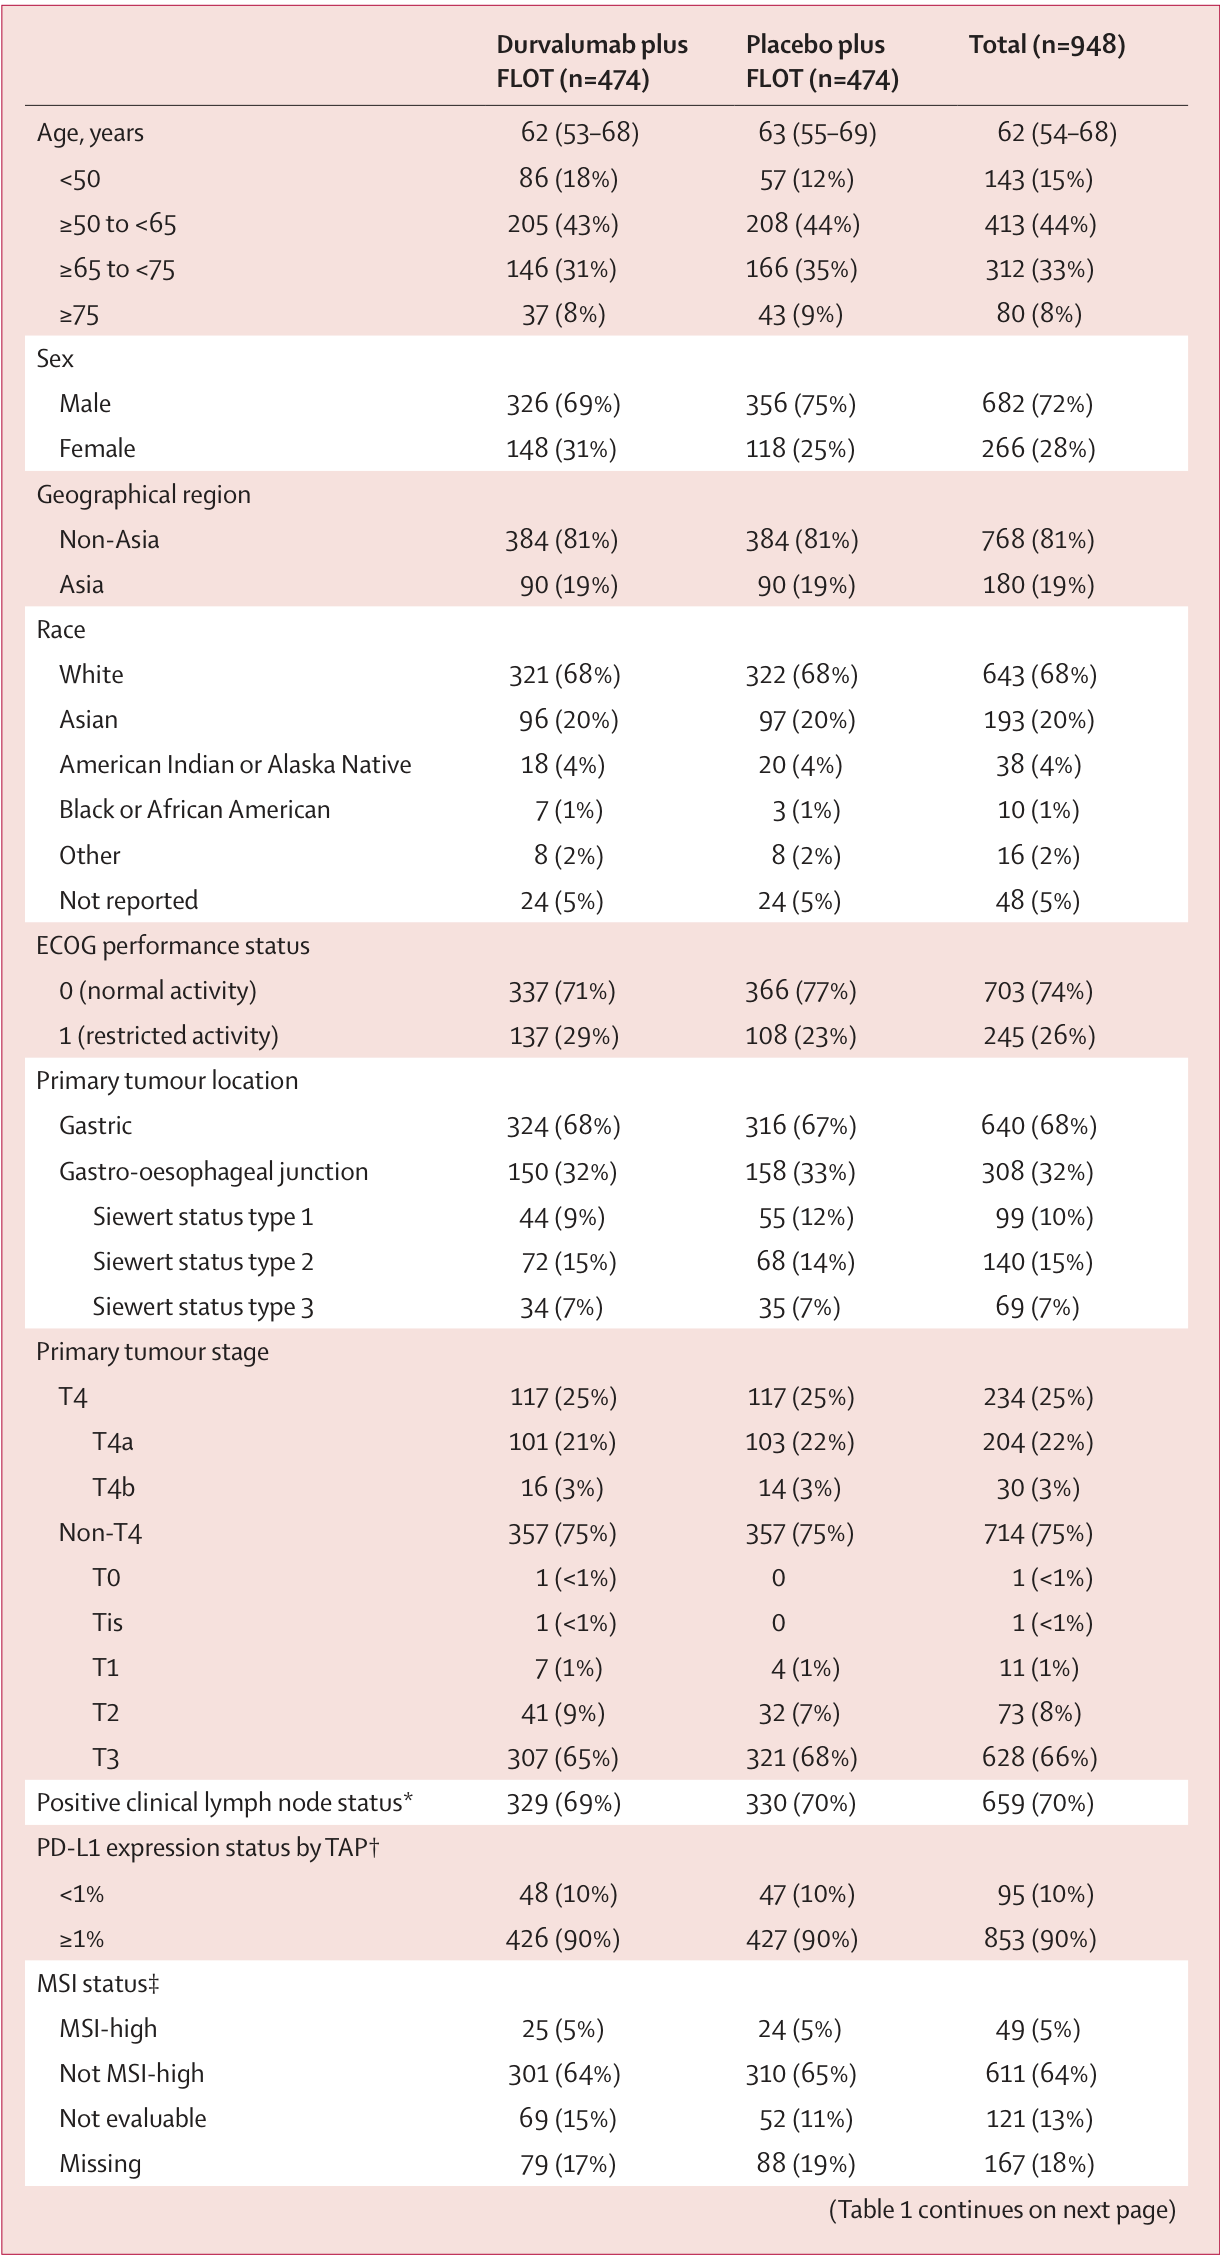
Baseline demographics and clinical characteristics, ITT population. Full table and footnotes span PDF pages 6–7.
2026 · Table 1, part 2 · PDF 第 7 页
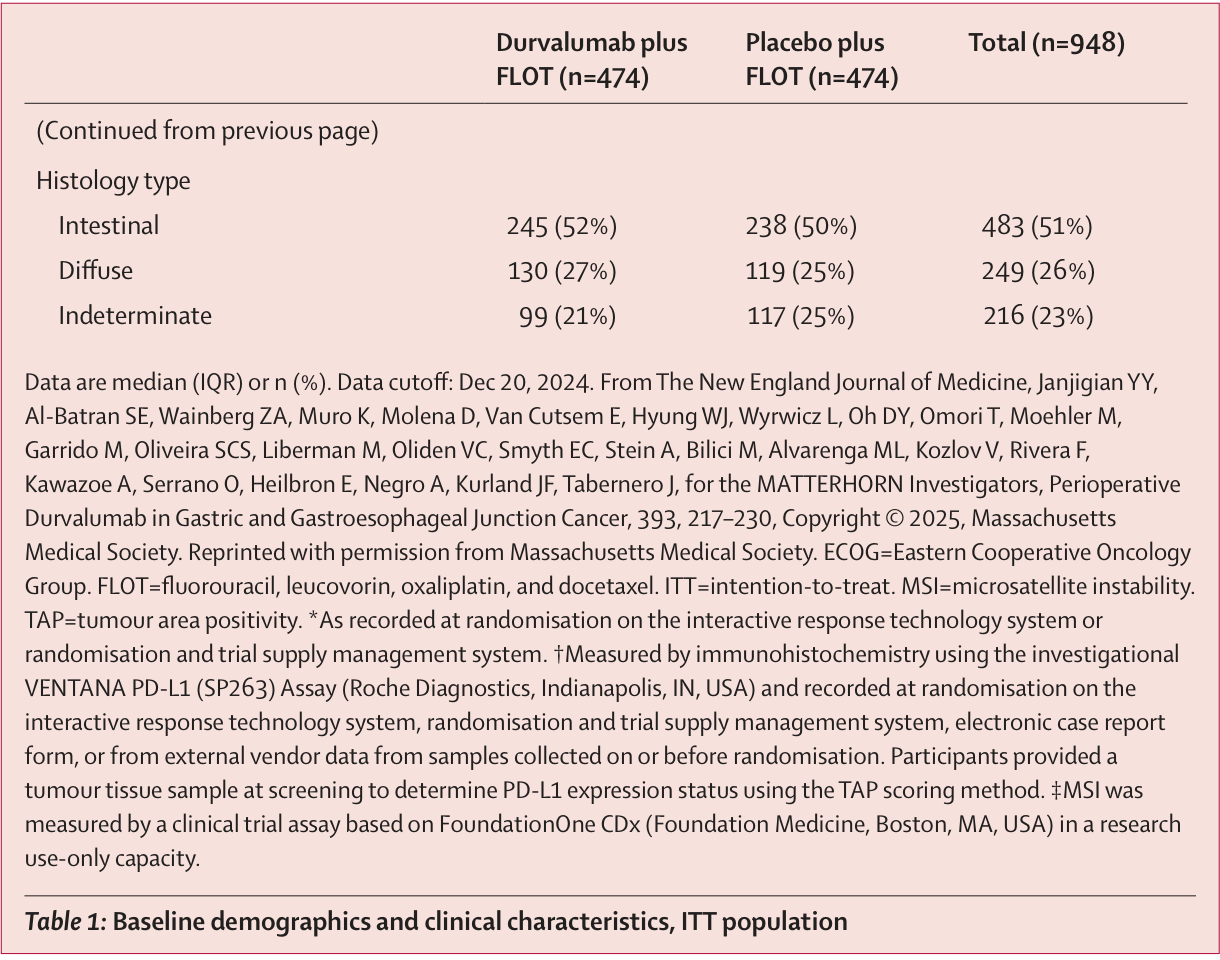
Baseline demographics and clinical characteristics, ITT population. Full table and footnotes span PDF pages 6–7.
2026 · Table 2, part 1 · PDF 第 12 页
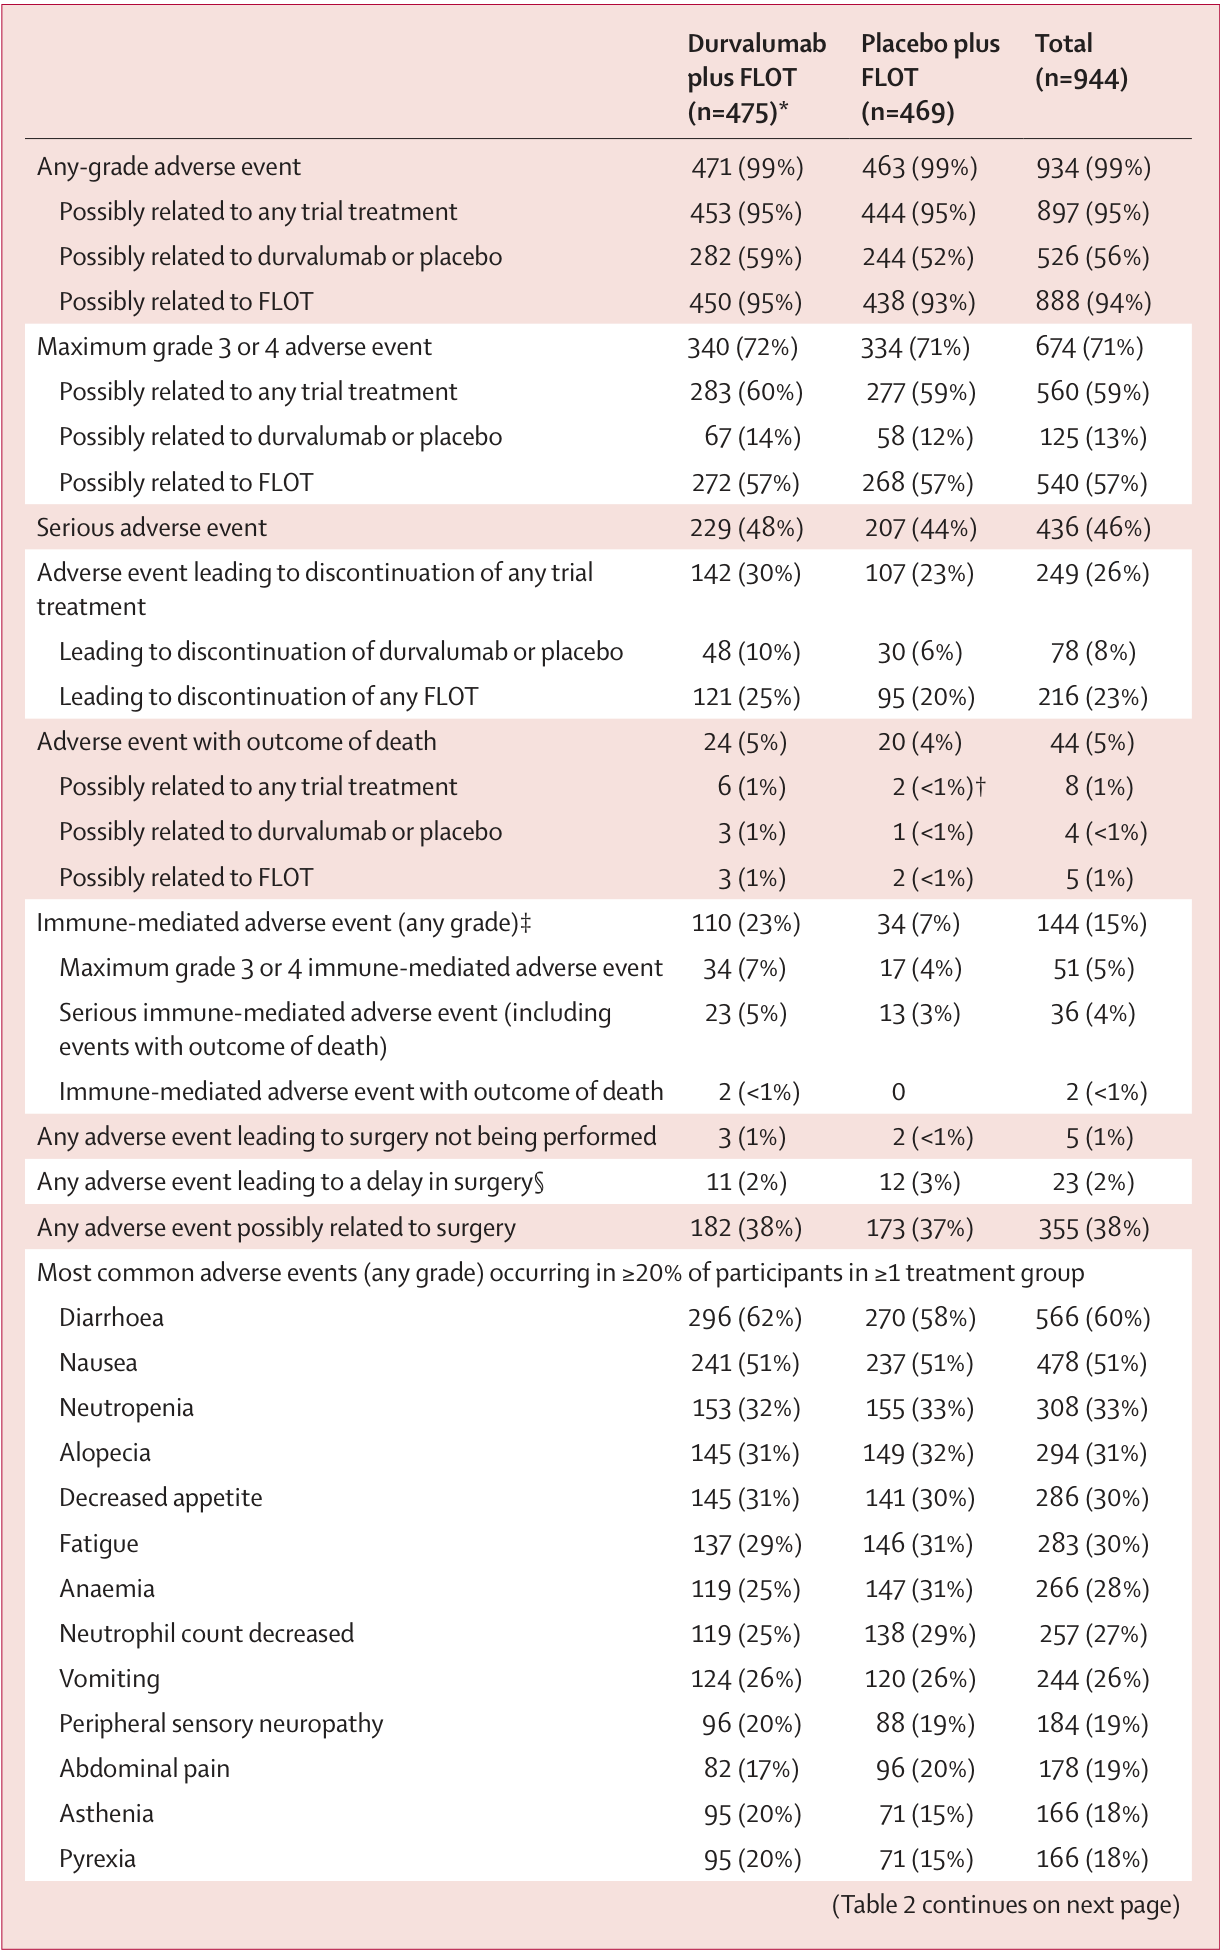
Adverse event summary, safety analysis set. Full table and footnotes span PDF pages 12–13.
2026 · Table 2, part 2 · PDF 第 13 页
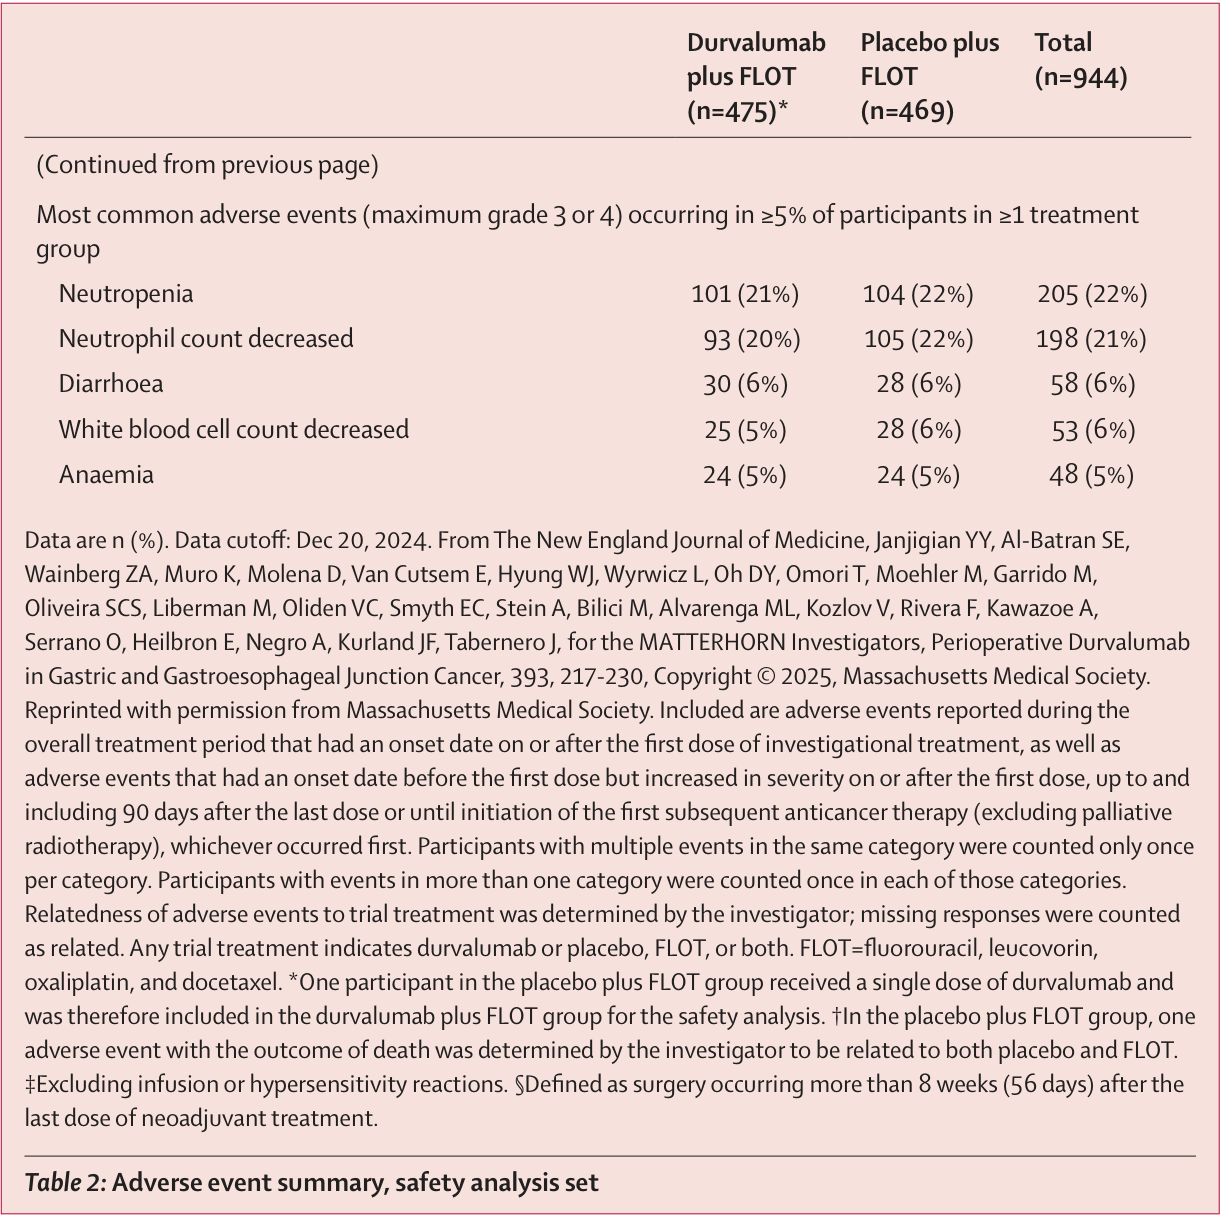
Adverse event summary, safety analysis set. Full table and footnotes span PDF pages 12–13.
完整阅读记录与证据表
文献卡:MATTERHORN主要结果(NEJM 2025)
- Paper ID:p-0016-art-perioperative-durvalumab-gastric
- 分析日期:2026-09-19;晨会日期:2026-09-20。
- 技能:article-read / morning-report / web-publish。
- 阅读范围:用户提供2025-06-27更新版主PDF的14页,全文、方法、3主图、2表(表1跨页)均已读取;图表逐张视觉核对并完整归档为6 PNG。PDF页序1–14,未用期刊最终印刷页217–230替代本文件页序。
- 未取得:独立Supplementary Appendix、protocol/SAP及利益披露附件。正文引用的补充图表仅按正文转述,不算已独立读图。
- 人工核对:pending;图表清单:figures/README.md,无超长表豁免。
一句话结论
在948例可切除胃或胃食管交界部腺癌患者中,围手术期度伐利尤单抗联合FLOT改善EFS与pCR;本报告的中期OS尚未达到预设显著性界值。2026年最终OS报告另存p-0008,两篇报告来自同一项948例试验。
研究问题与设计
多国147中心、双盲、安慰剂对照III期随机试验NCT04592913;随机1:1,每组474例。纳入II–IVA期、可根治手术、ECOG 0–1的腺癌;排除腹膜播散与远处转移(PDF第2–5页)。比较完整围手术期durvalumab+FLOT与placebo+FLOT,未拆分术前/术后贡献。
术前和术后各2个28天联合周期,每周期第1、15天给FLOT;免疫药/安慰剂1500 mg每4周一次,联合后继续10周期。4个联合周期共含8次FLOT给药(第2页)。
EFS从随机化起算,包含阻止手术或需方案外治疗的进展、术后进展/复发及死亡,具体影像/病理判定见第3页;其分析起点为术前随机化,涵盖术前和术后事件。pCR要求原发灶和切除淋巴结均无存活肿瘤,未手术、缺失或无法评估标本按无缓解计入全分析集(第3–5、10页)。
核心证据
| 主张 | 数字、条件与方向(度伐利尤单抗/安慰剂) | PDF页序/图表 | 依据 |
|---|---|---|---|
| 同一随机队列 | 948人,474/474,147中心20国 | 2–5;表1 | 正文/表 |
| EFS主要终点达标 | 167/218事件;HR 0.71(95% CI 0.58–0.86),P<0.001,界值0.0239 | 4–5、8;图1 | 正文/原图 |
| 24月EFS绝对差 | 67.4%/58.5%,相差8.9个百分点;中位EFS未达到/32.8月 | 5、8;图1 | 正文/原图 |
| EFS数据截止及随访 | 2024-12-20;中位随访31.5月(IQR 26.7–36.6) | 4–5 | 正文 |
| 中期OS未正式阳性 | 145/176死亡;24月OS 75.7%/70.4%;P=0.03,界值P<0.0001 | 5、7、10;图3A | 正文/原图 |
| 中期OS非比例风险 | 0–12月HR 0.99(0.70–1.39);12月以后HR 0.67(0.50–0.90) | 7、10;图3A | 正文/原图;假设检验补图未取得 |
| pCR提升 | ITT 19.2%/7.2%;调整RR 2.69(1.86–3.90) | 7、10;图3B | 正文/原图 |
| pCR缺失计无反应 | 未尝试手术43/46;尝试但缺样19/28;不可评估24/24 | 10;图3图注 | 图注;本篇全分析集的缺失处理规则 |
| 亚组精度有限 | TAP<1%仅48/47人,EFS HR 0.77(0.40–1.46);MSI-H 25/24人,HR标NC | 7、9;表1、图2 | 原图/表 |
| 安全性归组 | n=475/469,一位安慰剂分组患者实际接受一次度伐利尤单抗 | 8、12;表2脚注 | 正文/表 |
| 总体与免疫毒性应分开 | 最高3/4级AE 340/475(71.6%)对334/469(71.2%);免疫介导AE 110/475(23.2%)对34/469(7.2%) | 8–9、12;表2 | 正文/表 |
| 严重事件与停药 | 严重AE 229/207;任一治疗停用142/107;AE致死24/20 | 12;表2 | 原表,非全因死亡人数 |
| 手术和完成治疗 | 完成手术412/400;R0 377/412(91.5%)对369/400(92.3%);全部术后免疫/安慰剂完成248/245 | 5、8 | 正文 |
| 手术延迟的分母 | 全分析人群所有原因延迟48/474(10.1%)对51/474(10.8%);因AE延迟另为11/475对12/469 | 5、9、12 | 正文/表;按各自原因与分析集分别记录 |
上述“已核”均为AI对照正文和图表;人工核对状态为pending。
作者结论、局限与待解问题
作者结论:EFS改善,支持将该方案作为潜在围手术期治疗选择;OS需要更长随访。作者明确局限包括:未分离术前/术后贡献,手术及术后管理差异,未强制诊断腹腔镜,中国等高发地区未入组、黑人代表性不足(第11、13页)。
AI评价:HR 0.71描述事件瞬时风险的相对比较,固定时点生存率另行报告。pCR作为OS替代终点及术后停药依据的有效性仍待验证。亚组区间未经多重校正,区间跨1反映估计的不确定性;组间效应差异需依据交互检验。作者基于跨试验比较推测FLOT骨架可能关键,其独立贡献仍需不同化疗骨架间的随机比较。
两次报告的衔接与待核对项
- 2026报告p-0008:最终OS数据截止2025-09-01,HR 0.78(0.63–0.96),P=0.021<0.0499;病理分层EFS和安全性仍截止2024-12-20。其24%/9%来自中央病理可评估人群,与本篇ITT 19.2%/7.2%的分母不同。
- 用户所给NEJM更新版采用中期OS分段HR;后来论文引言引用会议摘要中的总体HR和P=0.025。合读页按各自报告版本分别记录。
- 本篇图3A安慰剂中位OS为47.2月,2026最终图2A为未达到。两文件确实不同;尾部风险人数很少,中位数估计对数据更新较敏感。原因需实施版SAP和更新数据才能进一步核实,本次未推断为排版错误。
- 两篇统计段均出现“41% of the planned 385 events”,而本篇图1实际事件167+218=385;该句存在数量表述疑点,合读采用可核对实际事件数及明确检验界值,不据此重构信息分数。待查SAP。
- 2025图2临床淋巴结亚组人数与表1随机分层记录不完全一致,原图保留,本次不自行补算或改图;待补充材料核实变量取值时点。
- 本次仅核对两份用户PDF全文;被引研究不视为新近全文精读。独立附录未取得,敏感性、删失细节与补充亚组仍待核对。
文献卡:MATTERHORN最终OS报告
- Paper ID:p-0008-art-perioperative-durvalumab-fluorouracil
- 日期:2026-09-10;article-read / web-publish
- 读取范围:来稿15页,正文、方法、讨论、声明及参考文献已读;图1–3及表1–2逐张视觉核对。参考文献不视为完整精读。独立appendix未取得。
- 人工核对:pending;图表清单:figures/README.md;3图2表分9个PNG,无长表豁免。
一句话结论与贡献
作者的正式结论为围手术期度伐利尤单抗联合FLOT改善OS;本报告补充最终OS和按治疗后病理状态的探索性EFS。整体ITT比较支持OS获益,治疗后病理分层为探索性分析。
方法与验证
全球147中心20国,双盲随机安慰剂对照III期;II–IVa可切除、无远处转移、ECOG0–1。术前/后各2个28天FLOT周期(每周期两次化疗),然后10周期度伐利尤单抗或安慰剂。OS从随机化起算。最终OS使用层级与分次检验剩余alpha .0499;EFS探索分析不替代正式OS检验。
核心证据
| 主张或结果 | 数字与条件 | PDF页序/图表 | 依据类型 | 核对状态 |
|---|---|---|---|---|
| ITT与流图差一条 | 949次记录,一人重复随机,948独立人、474/474 | 4–5,图1 | 正文/图表脚注 | 已核 |
| OS正式阳性 | HR .78(.63–.96),P=.021 < .0499;160/192死亡 | 7–8、11,图2A | 正文/图表 | 已核 |
| 固定时点生存率、中位OS与随访 | 36月69%/62%,中位OS均NR;43.0/42.9是删失者中位随访 | 8–9、11,图2A与脚注 | 图表/正文 | 已核 |
| 时间截点不同 | OS 2025-09-01;病理EFS/安全性2024-12-20 | 5–6、9–13 | 正文/图注 | 已核 |
| 中央病理pCR | 91/385、34/372;与ITT 19%/7%分母不同 | 6–7、11、14 | 正文/图表 | 已核 |
| pCR分层EFS | HR .29(.08–.96),5+6个事件 | 10–11,图3A | 图表/正文 | 已核 |
| 未达pCR与无任何反应不同 | 非pCR HR .82;无任何反应 HR1.27,CI均跨1 | 10–11,图3B及正文 | 图表/正文 | 已核 |
| PD-L1阴性精度不足 | 95人,HR .79(.41–1.50);使用TAP | 6、8–9、11 | 表/图/正文 | 已核 |
| 节点交互未显著 | OS基线节点交互P=.19 | 11 | 正文 | 已核 |
| 安全性归组不同 | 475/469:一位安慰剂分组者实际接受一次度伐利尤单抗,归其安全组 | 12–13,表2脚注 | 图表 | 已核 |
| 免疫与停药负担 | 任意免疫AE23%/7%,任一治疗停药30%/23% | 12–13,表2 | 图表 | 已核 |
| 完整切除率分母 | 377/412、369/400;分母为完成手术者 | 14 | 正文 | 已核 |
MATTERHORN两次报告对照
2025年NEJM主报告对应p-0016,2026年Lancet最终OS报告对应p-0008;下表均采用从1开始的PDF页序。
| 对照点 | 2025证据位置 | 2026证据位置 | 合读结论 |
|---|---|---|---|
| 同一试验 | p-0016第1–5页 | p-0008第1–3、9页 | 同为NCT04592913、474/474,人数不可相加 |
| EFS主要结果 | p-0016第5、8页图1 | p-0008第2页回引 | HR 0.71,24月67.4%/58.5%,2026不是另一次独立重复验证 |
| 中期/最终OS | p-0016第7、10页图3A | p-0008第7–9、11页图2 | 0.0001与0.0499分别为当次界值;更新版中期用分段HR,最终用总体HR |
| 病理缓解分母 | p-0016第3–5、7、10页 | p-0008第6–7、11、14页 | ITT 19.2%/7.2%与病理子集24%/9%不可直接比较疗效增幅 |
| 病理分层局限 | p-0016第13页方案局限 | p-0008第10–11、14页 | 治疗后选择、11个pCR层EFS事件;不能据此省略术后治疗 |
| 安全性 | p-0016第12页表2 | p-0008第12–13页表2 | 同一2024-12-20截止数据,部分细目与百分数精度不同 |
OS中位数版本、事件触发句及淋巴结人数的原文差异见p-0016的analysis.md。独立补充附录及protocol/SAP仍未取得;正文引用的补充结果未记作已逐图核实。
局限与解释
作者指出:手术病理子集存在选择,分析人群与ITT不同;组织学无中央确认;节点由研究者判断;中国未参与,部分人群代表性不足。AI评价:治疗后分层受到选择因素影响;pCR作为OS替代终点的有效性及省略术后免疫的策略尚待随机验证。主要证据针对整套围手术期治疗。MSI未测/不可评估较多,排除已知MSI-H后仍包含MSI状态未知者。
原文疑点及外部核对
第12页称KEYNOTE-585未用FLOT,概括过宽。已核对其2025年原始最终报告摘要(JCO DOI 10.1200/JCO-25-00486,https://pubmed.ncbi.nlm.nih.gov/40829093/):主队列804例,另有FLOT队列203例。网页已纠正,未以该摘要冒充全文精读。其余引用链接与状态见reading.md。新论文DOI、日期与作者来自用户PDF首页;独立网页检索未能重新确认新报告全文,不据此改动来稿或补造appendix。
待核对与后续阅读
取得appendix复核方案偏离、缺失、MSI敏感性及后续治疗;继续追踪OS按病理结果与5年结局。本次未获取独立appendix,绝不将正文转述写成已独立查表。
2026-09-16 全库复核补记
重新对照主 PDF 15 页、主图 1–3 与表 1–2(共 9 PNG)。最终 OS、病理分组 EFS、安全性及各分析集分母与原文一致。导读“亚洲患者占19%”收窄为“亚洲地区入组占19%(180/948)”;表 1 另列 Asian 族群 193/948(20%),两项不同。比例风险假设检验 P=.15(第11页),未发现违背证据;不据曲线晚分离单独否定 HR。未新增临床疗效外推。独立 appendix、研究实施版方案/SAP仍未取得;参考研究未在本轮重新全文核读。
2026-09-19:9月20日晨会合读补记
与新增p-0016(NEJM 2025更新版,14页)合读,统一阅读正文见reading.md,跨篇对照见本文件「MATTERHORN两次报告对照」一节。复核本篇15页和9个图表PNG。旧群分享来源与9.10归档名保留,只补9.20晨会日期。NEJM此前仅核摘要的状态现由全文读取取代;两篇仍为同一948人试验。
2025更新版中期OS为P=0.03、界值0.0001,比例风险假设不满足,图3使用分段HR;本篇引言P=0.025及总体HR引用2025会议摘要(ref.11),合读不以该转述覆盖用户提供的NEJM更新版。最终OS P=0.021、界值0.0499、比例风险检验P=0.15按本篇写明。pCR ITT与中央病理子集分母分别保留。中位OS与事件触发句的原文差异详见p-0016分析,未用不明原因自行解释。
本篇独立appendix/SAP仍未取得,被引研究未在本轮重读全文。已核对正文关键结论、子图、人群、组序、时间点及置信区间;两篇15张图表截图都保存完整来源,人工核对仍pending。