研究概述
一些临床队列发现,高BMI患者接受免疫检查点抑制剂时可能有较好的结局。但BMI同时关联饮食、代谢状态和肠道菌群,很难从这种关联中确定真正起作用的因素。
Desharnais等人比较了 12种小鼠饮食模型,再通过短期换食、菌群移植、单菌补充和代谢物干预拆解机制。主要结果是:抗PD-1效果并不随体重或代谢异常程度简单增加;饮食与菌群的配合,可以在小鼠中改变治疗反应。 主要肿瘤模型是肺癌来源HKP1细胞的皮下移植瘤,另有黑色素瘤和纤维肉瘤模型验证。(PDF第1–2、13–14页)
12种饮食与治疗反应
作者用体重、脂肪量、葡萄糖耐量和胰岛素构建代谢评分,观察到饮食诱导的代谢状态与外周免疫细胞比例相关。例如,代谢评分较高时,血中CD4、CD8 T细胞比例较低,单核细胞比例较高。这里分析的是细胞比例,以及12个饮食组均值之间的相关性。(图1)
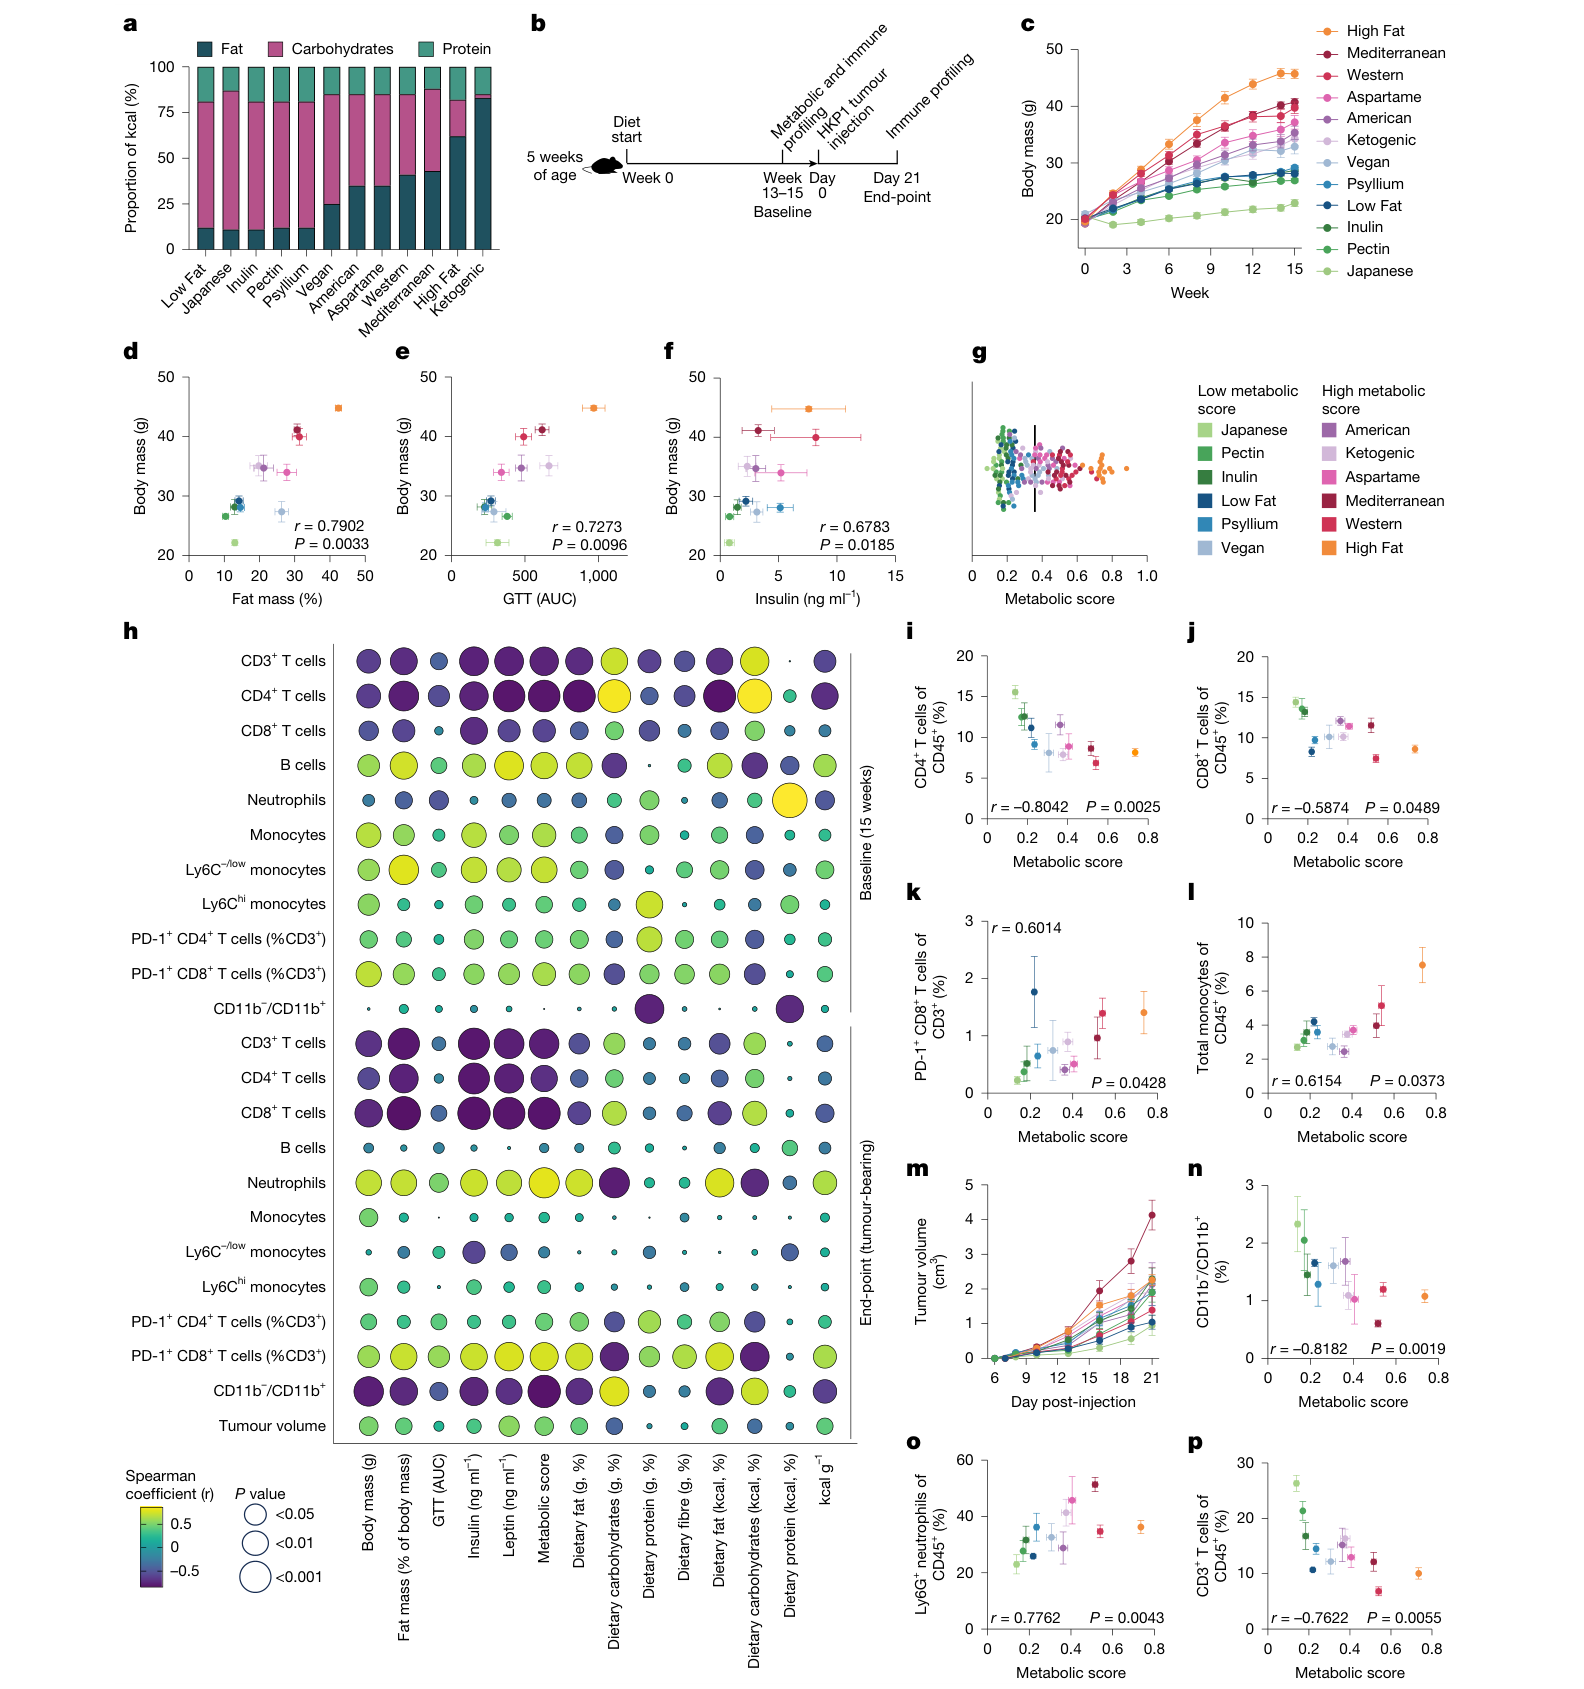
图1|饮食组成、代谢表型、外周免疫与HKP1肿瘤生长。原文PDF第3页。
治疗实验却出现了分离:代谢评分与ICI敏感性评分的相关性未达到统计显著(r=0.3566,P=0.2560)。具体配方呈现不同的代谢与应答组合。(图2;扩展图4)
| 小鼠配方 | 观察 | 对解释的意义 |
|---|---|---|
| High Fat | 代谢评分高,抗PD-1反应较强 | 肥胖与应答可以同时出现 |
| Mediterranean、Ketogenic | 代谢评分高,但治疗反应较弱 | 较高代谢评分与较弱反应并存 |
| Inulin | 代谢评分低,仍有较强治疗反应 | 较强应答不以肥胖为前提 |
| Psyllium | 代谢评分低,反应较弱 | 纤维种类与整体配方共同构成实验条件 |
这些名称指具体实验饲料。High Fat、Mediterranean和Ketogenic的脂肪供能比分别为62%、43%和83%,配方还同时改变了其他营养成分。(补充表1–2)
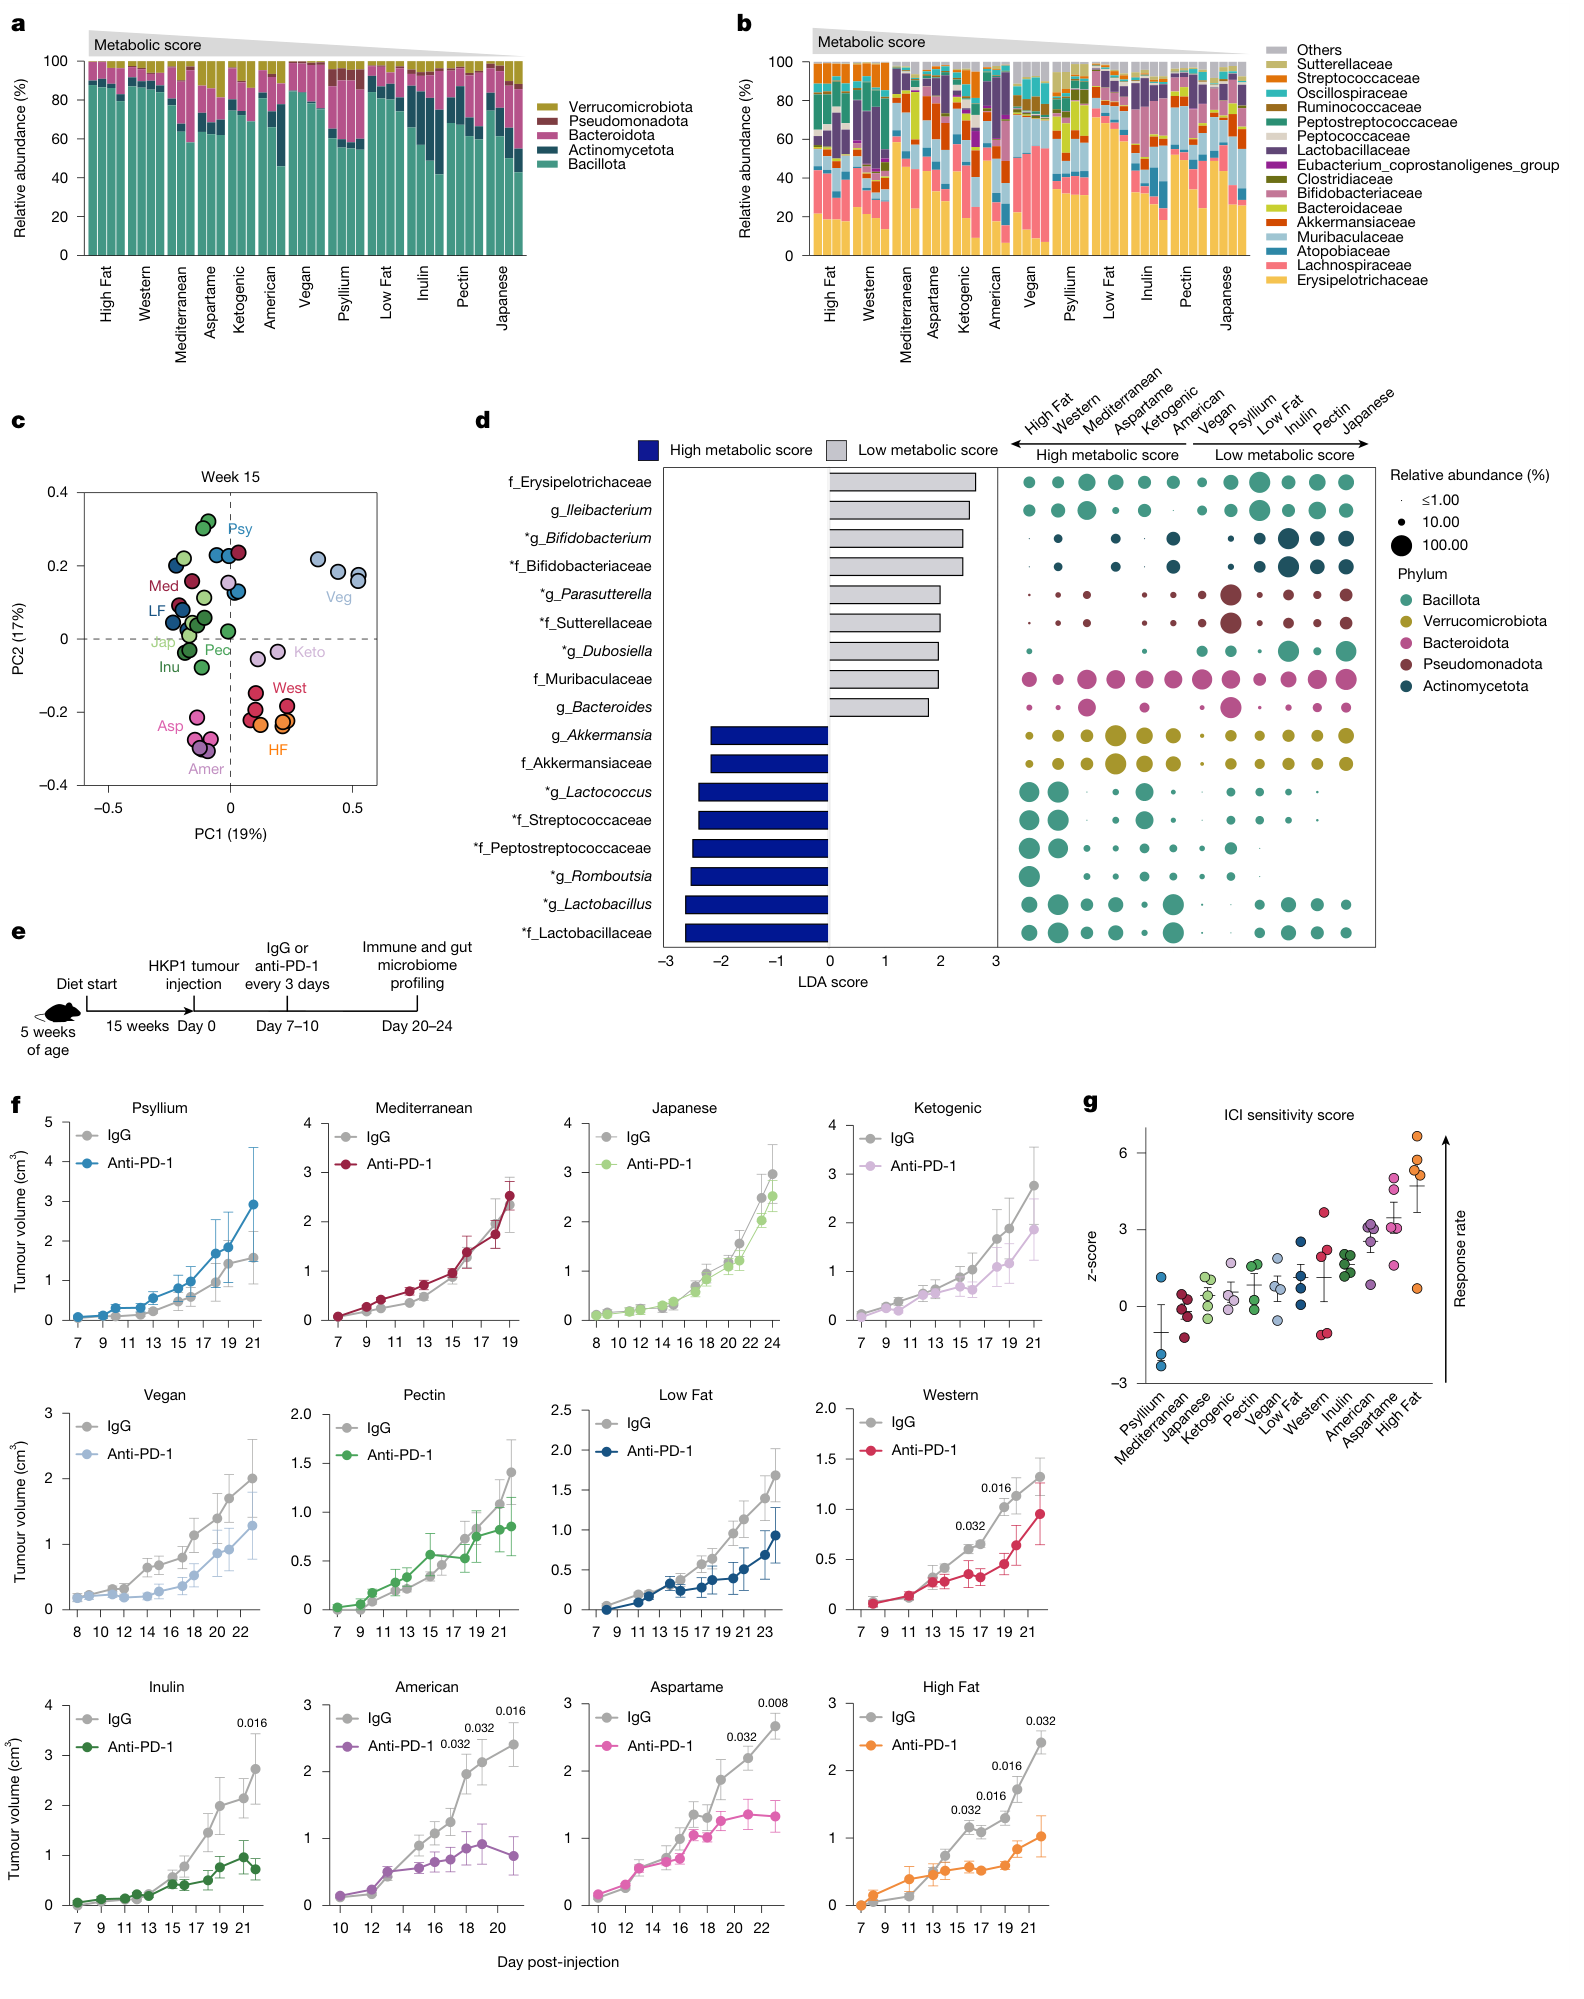
图2|菌群分析、12种饮食下的治疗曲线及ICI敏感性评分。原文PDF第4页,图注第5页。
ICI评分是将治疗组末次肿瘤体积相对各自IgG对照进行标准化的研究指标。文中“66.7%与33.3%”对应两类各6种饮食模型中,被作者归为应答模型的4种与2种,统计单位为饮食模型。(方法第15页;扩展图4h)
菌群变化与体重变化的时序
治疗反应较强的饮食组总体富集乳杆菌属,而拟杆菌属相对较少;肿瘤中T细胞比例较高、中性粒细胞比例较低。不过,Inulin组即使乳杆菌较少仍能应答,提示 存在不止一种有利菌群组合。(图3a–h;扩展图5)
把饮食暴露缩短到3周后,High Fat组仍出现抗PD-1抑瘤作用,Psyllium组则未见同样效果。这说明某些饮食作用可以在长期肥胖充分形成之前出现。3周与15周菌群图上的PERMDISP检验考察组内离散程度。(图3i–m;扩展图6)
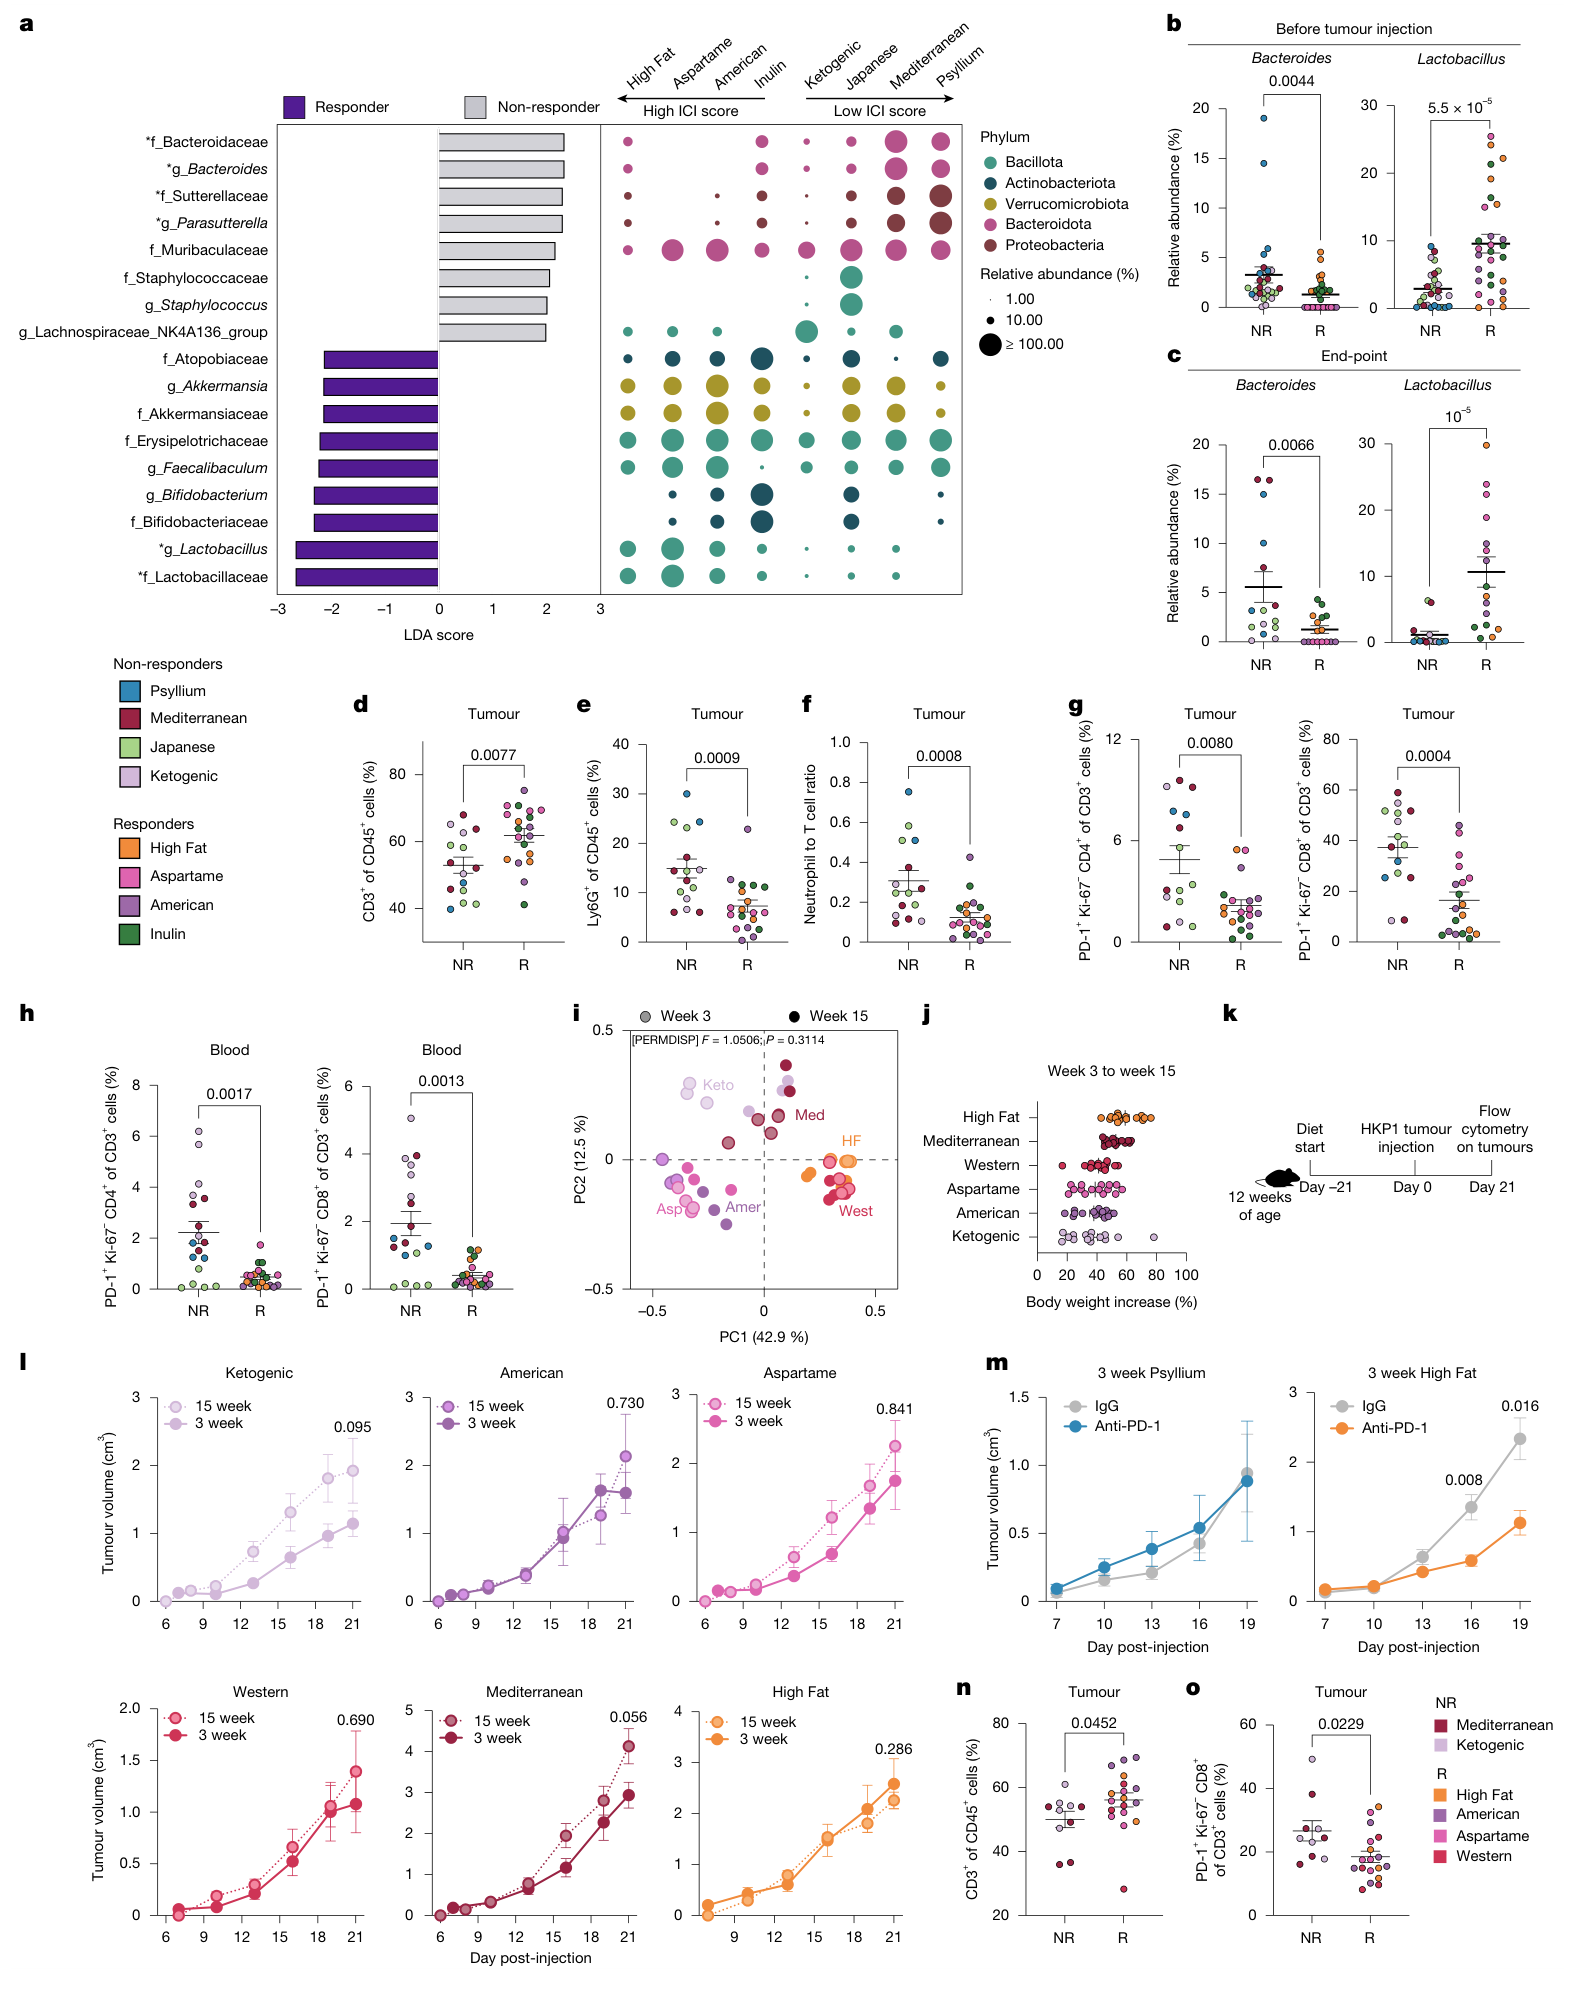
图3|菌群、肿瘤免疫状态,以及3周与15周饮食模型。原文PDF第6页,图注第7页。
图中的PD-1⁺Ki-67⁻ T细胞按表面标志与增殖状态定义。短期模型在YUMM1.7黑色素瘤中也获得支持,但YUMMER1.7末次比较为P=0.056,应保留为趋势。(扩展图6)
换食与菌群移植
在首次抗PD-1治疗前2天,将Psyllium换成High Fat后,小鼠重新出现治疗敏感性;反向换食则未见显著的治疗组与对照组差异。换食48小时后,乳杆菌的变化方向随饮食而改变。Psyllium转High Fat还伴随拟杆菌下降;反向换食中的拟杆菌升高仅为趋势(P=0.0938)。(图4a–k)
肿瘤内CD8 T细胞经刺激后的IFNγ、TNF阳性比例,以及CD44、CD11a阳性比例,在两种换食方向之间有差异;GZMB和PD-1的比较未达到显著。这些读出呈现了T细胞功能状态的具体变化。
更关键的是受体饮食:经抗生素预处理后,即使移入来自Psyllium非应答模型的菌群,只要受体维持High Fat饮食,也可以出现抗PD-1反应;同类移植在Psyllium受体中的效果不同。另一方面,高脂受体在抗生素处理后仅接受PBS并没有同样恢复,支持菌群与受体饮食共同参与效应。(图4l–o;扩展图8)
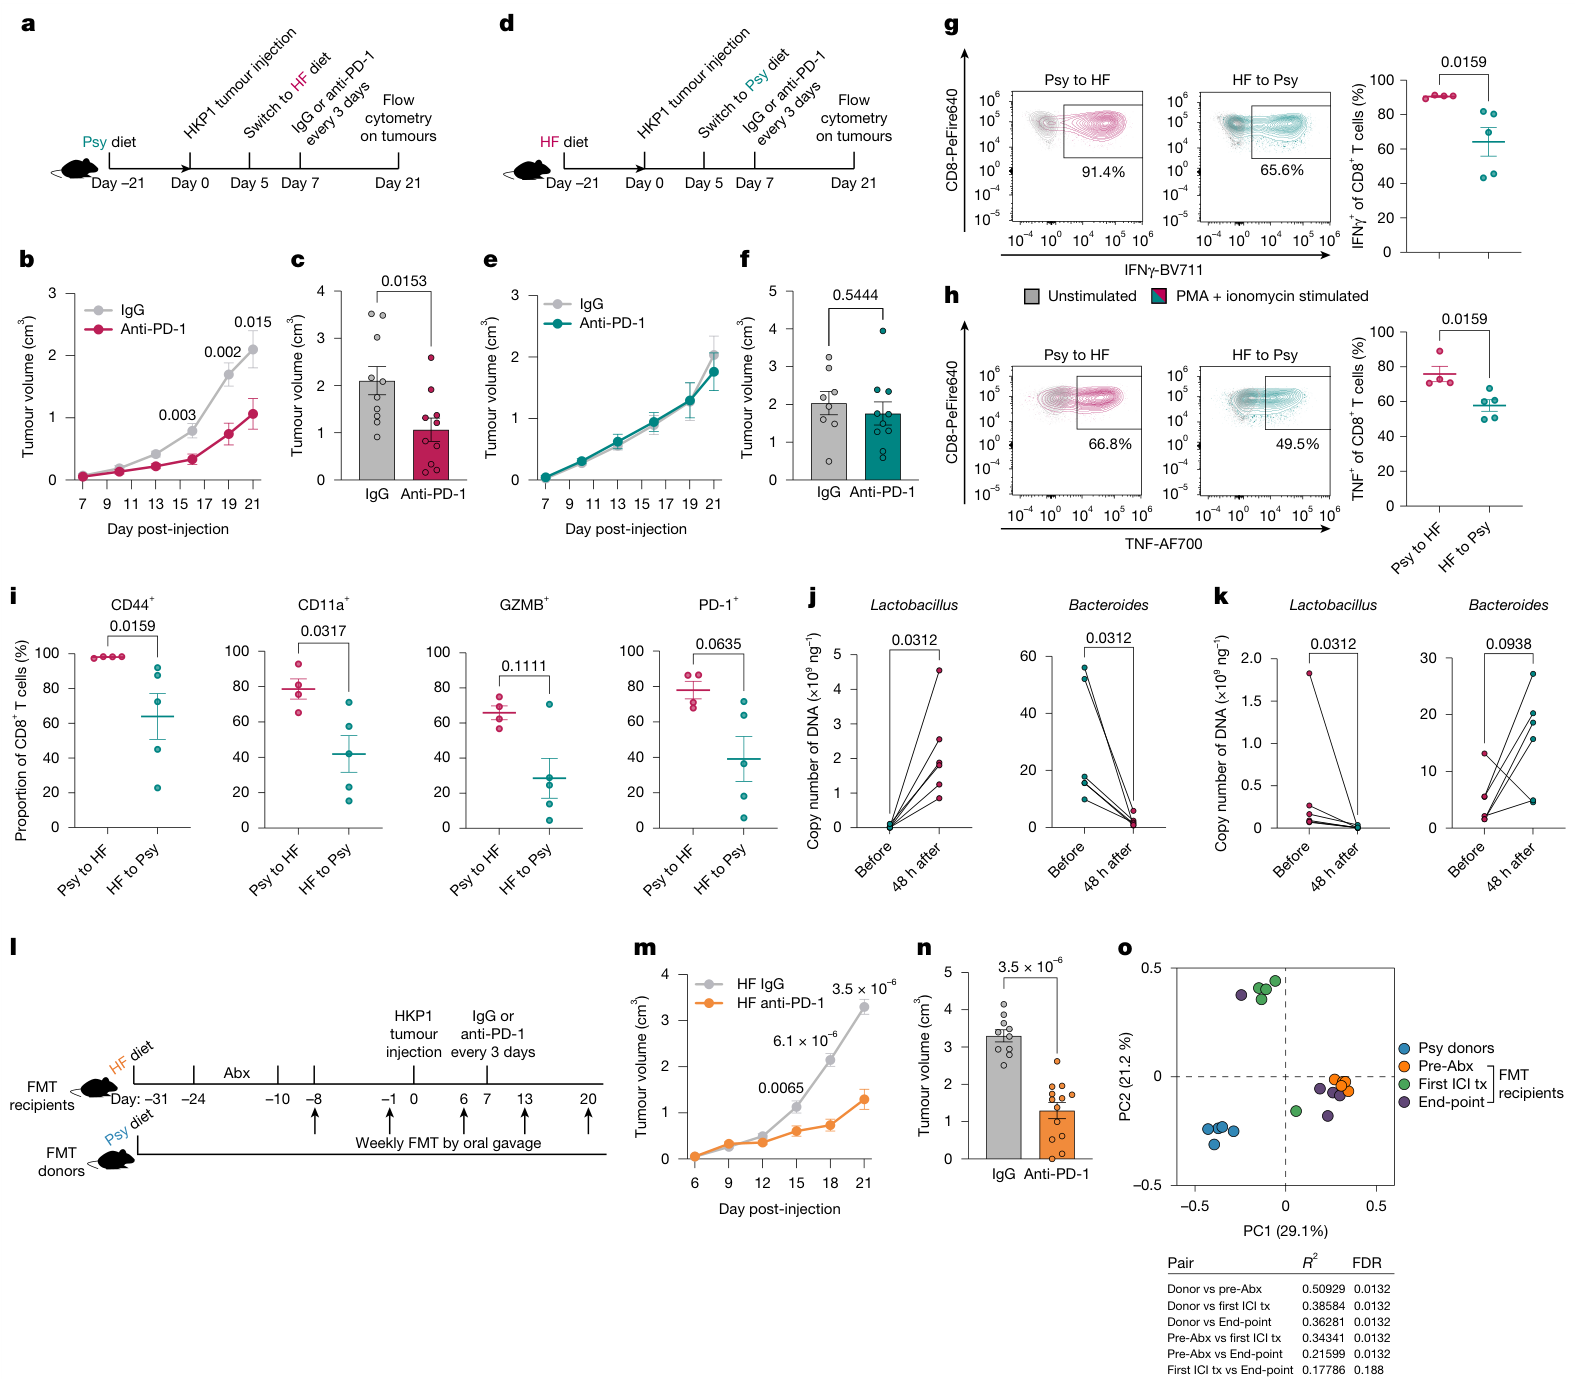
图4|双向换食、T细胞功能、48小时菌群变化及非应答菌群移植。原文PDF第8页。
这些干预支持一种生态学解释:移入什么菌群,与受体提供什么营养环境,要共同考虑。 论文通过组合干预描述饮食与菌群的功能配合。
约氏乳杆菌与氨基酸代谢
宏基因组分析进一步将候选菌缩小到 约氏乳杆菌(Lactobacillus johnsonii,Lj)。在无菌小鼠中,High Fat饮食配合Lj定植,再联合抗PD-1,带来明显的HKP1肿瘤退缩;在经抗生素预处理的常规饲养小鼠中,单菌补充也产生强效应。(图5a–h)
原文将后一组描述为完全应答,但其末次体积表的5只小鼠中,4只记录为0,另1只约为0.0206 cm³。该组结果表现为显著退缩、接近清除。另一个候选菌在部分条件下也有作用。(Source Data Fig. 5h;扩展图9)
代谢组将线索指向芳香族氨基酸代谢。作者重点考察 脱氨酪氨酸(desaminotyrosine,DAT):在应答相关饮食、Lj与High Fat组合,以及活菌培养上清中,作者标作DAT的代谢信号升高;外加DAT可改变T细胞功能,并在Psyllium饮食小鼠中增强抗PD-1抑瘤作用。DAT单独使用没有同样的抑瘤效果。(图5m–v)
外加DAT的干预支持其调节免疫治疗反应的功能;内源性代谢峰的身份与Lj合成路径则是进一步机制研究的重点。
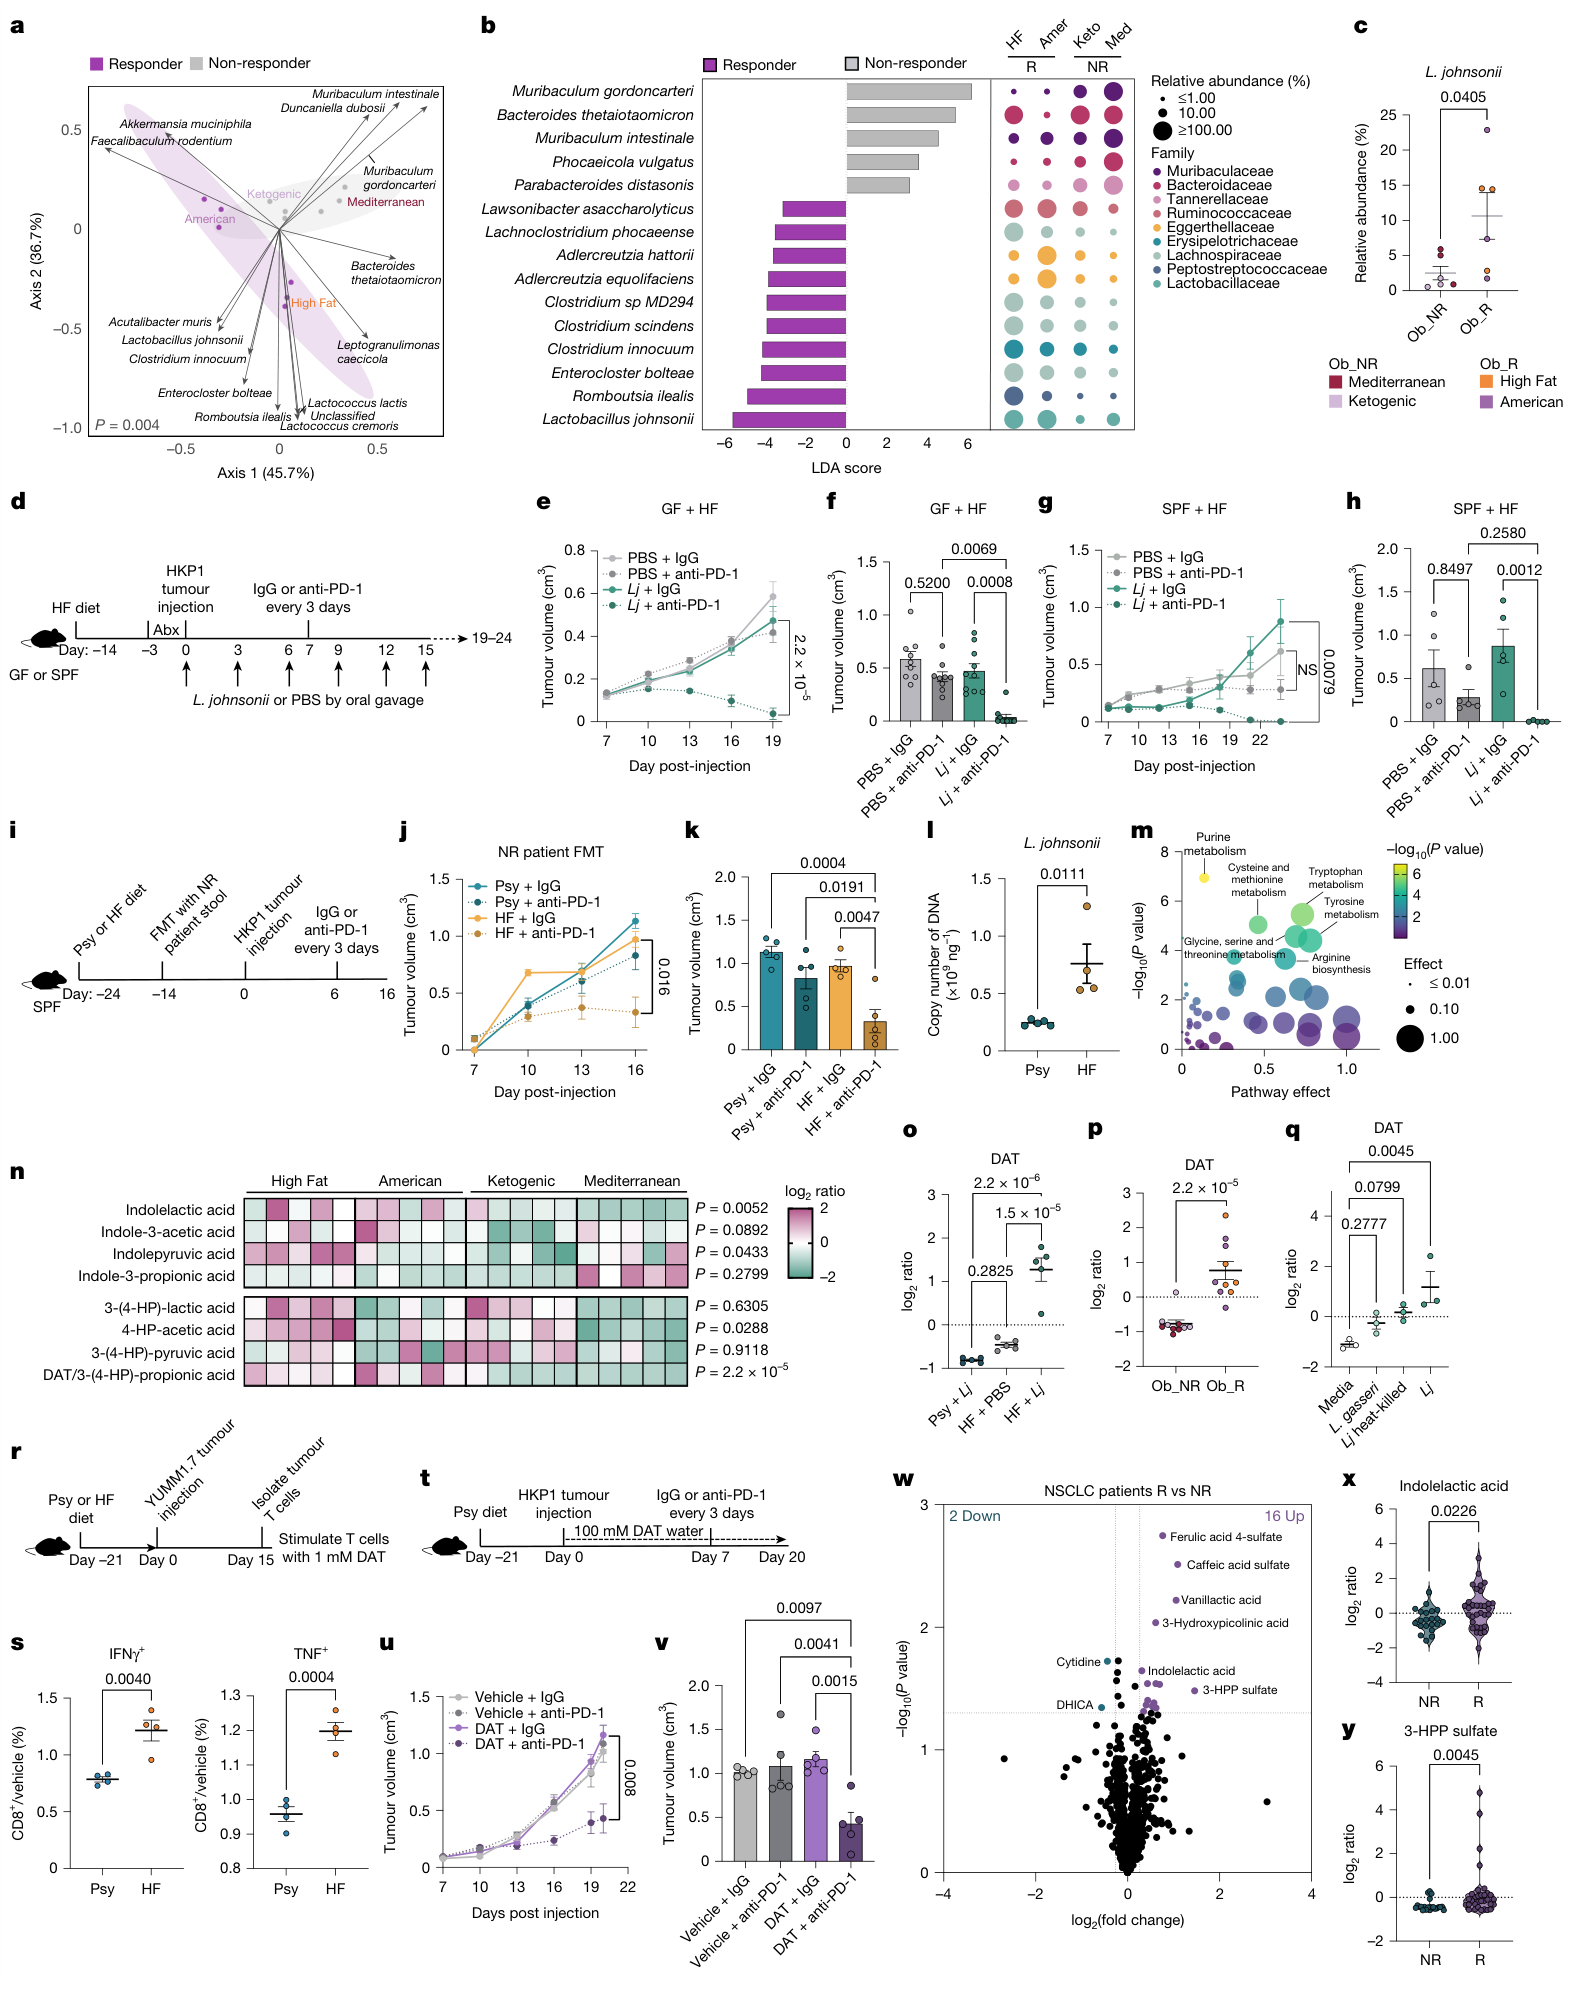
图5|单菌、患者菌群移植、DAT功能干预与患者血浆代谢组。原文PDF第9页,图注第10页。
另一候选代谢物是吲哚乳酸(ILA)。它在部分应答相关样本中升高,但在本文Lj单菌定植代谢组中未检出;其离体筛选中不同T细胞功能读出的变化也有差异。(补充表5;扩展图10c)
人体探索性结果
本文的人体相关证据来自三个实验,分别连接供者样本、代谢物与受体小鼠反应。
| 证据来源 | 结果与样本条件 |
|---|---|
| 1名后续对ICI不应答的肺癌患者供粪 | 移入小鼠后,受体High Fat饮食可改善小鼠的抗PD-1反应。粪样在患者治疗前采集 |
| 53名NSCLC患者血浆 | 32名应答者、21名非应答者中,ILA和3-HPP sulfate的水平存在差异。48份为治疗前样本,5份为较晚时间点 |
| 按BMI分组的9名患者供粪 | 3名BMI<25、6名BMI≥25供者,移植至普通饲料饲养的MCA205荷瘤小鼠。高BMI供者组内观察到治疗效应 |
(图5i–l、w–y;扩展图10h–i;补充表3、8–9)
3-HPP sulfate与DAT是不同化合物;作者将前者解释为同一代谢轴的下游关联信号,其补充表注释为Tier 2候选鉴定。患者代谢组属于探索性关联,混合了不同治疗方案与采样时间,也没有独立验证队列。BMI移植实验报告了各组内部的治疗比较,组间交互作用仍待检验。
本文最值得追踪的是 饮食可塑造微生物的功能环境,从而改变免疫治疗反应。将它转向临床,还需要确定有利的具体营养成分、可重复的菌株与代谢物效应,以及适用的患者人群。
局限与待解问题
小鼠实验同时改变多种营养成分,配方效应与肥胖程度的贡献仍需细化;尚无患者增重或饮食干预结果。Lj的效应依赖饮食条件,研究尚缺通用于不同组合的交互效应估计,以及长期随访或再挑战验证。PD-1⁺Ki-67⁻群体的耗竭程度还需结合功能测定(图2–5;扩展图4、6、9)。
代谢机制存在两个缺口:补充表4–6相关峰同时列出DAT与另一羟基苯丙酸候选,分子身份仍需确认;Lj合成DAT的特定路径及其必要性尚缺同位素示踪或合成酶干预。人体代谢组混合了治疗方案与采样时点,缺少独立验证,BMI供者移植也尚未完成组间交互检验(补充表3–6、8–9)。
相关研究
- Kennedy等,Nature 2025:Diet outperforms microbial transplant to drive microbiome recovery in mice。在抗生素后菌群恢复的研究中,饮食资源环境影响生态恢复,研究终点为菌群恢复。本次核对正式题录与摘要。
- Joachim等,eBioMedicine 2023:The microbial metabolite desaminotyrosine enhances T-cell priming and cancer immunotherapy with immune checkpoint inhibitors。可沿此追读DAT与T细胞启动的既有研究。本次仅核对题录和研究问题,未完成全文复核。
原文:Desharnais等,Nature 657,505–516(2026)。
主图与表格 · 5 张
fig-1.png · PDF 第 3 页
Fig. 1 | Dietary composition influences metabolic status and peripheral immunity after 15 weeks. a, Proportion of kilocalories from dietary fat, carbohydrates and protein for the experimental diets. b, Schematic of the 15-week diet model corresponding to c–p. c, Body weight over 15 weeks. Japanese: n = 14 mice; all other diets: n = 15 mice; 2 independent cohorts; mean ± s.e.m. d–f, Correlations between average body weight (n = 5 mice per diet) and metabolic assays at baseline, including percentage of fat mass (d; Japanese: n = 9 mice; all other diets: n = 10 mice), glucose tolerance test (GTT) (e; Low Fat, High Fat and Western: n = 10 mice; all other diets: n = 5 mice) and serum insulin (f; Inulin: n = 6 mice; all other diets: n = 5 mice). AUC, area under the curve. g, Diet metabolic score (mean = 0.36 is indicated). Each data point represents one mouse. h, Correlation matrix of blood immune cells, metabolic parameters and nutritional content at baseline (non-tumour-bearing) and end-point (tumour-bearing). Bubble colour represents Spearman correlation coefficient; bubble size indicates the P value. i–l, Correlation between average metabolic score (n = 5 mice per diet) and baseline blood flow cytometry (n = 5 mice per diet) for CD4+ T cells (i), CD8+ T cells (j), PD-1+ CD8+ T cells (k) and monocytes (l). m, HKP1 tumour kinetics by calliper in the 15-week diet model. Pectin, Inulin, American and Vegan: n = 4 mice; all other diets: n = 5 mice; mean ± s.e.m. n–p, Correlation between average metabolic score (n = 5 mice per diet) and end-point blood flow cytometry (Pectin, American and Vegan: n = 4 mice, all other diets: n = 5 mice) for lymphoid:myeloid ratio (n), neutrophils (o) or CD3+ T cells (p). Correlations were calculated using two-tailed Spearman correlation and are presented as mean ± s.e.m. All immune cells are calculated as percentage of CD45+ cells unless otherwise indicated.
fig-2.png · PDF 第 4 页
Fig. 2 | Dietary intake dictates gut microbiome composition and anti-PD-1 response. a,b, 16S rRNA gene sequencing showing taxonomic composition of fecal bacteria at phylum (a) and family (b) levels at baseline. Diets are ordered by decreasing metabolic score, from left to right. Bars represent individual mice. c, PCoA (16S rRNA gene sequencing) using Bray–Curtis distance matrix at the ASV level for fecal bacterial DNA at baseline. d, Linear discriminant analysis effect size (LEfSe) analysis for fecal bacteria associated with high or low metabolic score diets (asterisks indicate P < 0.05, false discovery rate (FDR) < 0.1, linear discriminant analysis (LDA) ≥ 2). Bubble size represents normalized relative abundance of a given family (f_) or genus (g_); bubble colour indicates phylum. Diets are ordered by decreasing metabolic score, from left to right. e, ICI trial schematic corresponding to f. f, HKP1 tumour kinetics by calliper in IgG- or anti-PD-1-treated mice. IgG (Psyllium, Ketogenic, Pectin, Low Fat, American and Aspartame) and anti-PD-1 (Mediterranean, Japanese, Western, Inulin, American, Aspartame and High Fat): n = 5 mice; IgG (Mediterranean, Japanese, Vegan, Western, Inulin and High Fat) and anti-PD-1 (Ketogenic, Vegan, Pectin and Low Fat): n = 4 mice; anti-PD-1 (Psyllium): n = 3 mice. Multiple two-tailed Mann–Whitney tests; mean ± s.e.m. g, Anti-PD-1 sensitivity index calculated from end-point tumour volumes of IgG and anti- PD-1-treated groups as shown in f. Data are mean ± s.e.m.
fig-3.png · PDF 第 6 页
Fig. 3 | Microbial and immune signatures of diet-associated anti-PD-1 efficacy. a, LEfSe analysis for fecal bacteria associated with the top 4 responsive and non-responsive diets (asterisks indicate P < 0.05, FDR < 0.1, LDA ≥ 2). Bubble size indicates normalized relative abundance of a given family (f_) or genus (g_); bubble colour represents phylum. b,c, Bacteroides and Lactobacillus from 16S rRNA gene sequencing on fecal samples before tumour injection (b) and at the end-point (anti-PD-1-treated mice only) (c). Non-responder (NR): n = 27 pre-tumour mice, n = 15 end-point mice; responder (R): n = 29 pre-tumour mice, n = 16 end-point mice. d–h, Flow cytometry analysis of anti-PD-1-treated mice, quantifying intratumoural T cells (d), neutrophils (e), neutrophil:T cell ratio (f) and PD-1+Ki-67− T cells (g), and blood PD-1+Ki-67− T cells (h). Non-responder tumour: n = 15 mice; responder tumour: n = 19 mice; non-responder blood: n = 18 mice; responder blood: n = 20 mice. i, PCoA (16S rRNA gene sequencing) using Bray–Curtis distance matrix at the ASV level for fecal bacterial DNA after 3 and 15 weeks on diet. Homogeneity of group dispersions (PERMDISP) test. j, Body weight increase between 3 and 15 weeks of diet; n = 15 mice per group, 2 independent cohorts. k, Schematic of the 3-week diet model corresponding to l,n,o. l, HKP1 tumour kinetics by calliper comparing 3-week and 15-week models. 3-week, High Fat: n = 4 mice; 3-week, all other groups:, n = 5 mice; 15-week data are from Fig. 1m. m, HKP1 tumour kinetics by calliper in IgG- or anti-PD-1-treated mice in the 3-week diet model. Left, Psyllium diet; right, High Fat diet. n = 5 mice per group. n,o, Intratumoural CD3+ T cells (n) and PD-1+Ki-67−CD8+ T cells (o) in the 3-week model. Non-responders: n = 10 mice; responders: n = 18 mice. Data are mean ± s.e.m. Two-tailed Mann–Whitney test (b,c,e–h,l–n); two-tailed unpaired t-test (d,o).
fig-4.png · PDF 第 8 页
Fig. 4 | Modulation of the food–gut axis to elicit anti-PD-1 sensitivity. a, Psyllium to High Fat (Psy to HF) diet switch trial schematic corresponding to b,c,g–j. b,c, HKP1 tumour kinetics by calliper (b) and end-point tumour volume (c) following a switch from the Psy to HF diet. n = 10 mice per group, 2 independent cohorts. d, High Fat to Psyllium (HF to Psy) diet switch trial schematic corresponding to e–i,k. e,f, HKP1 tumour kinetics by calliper (e) and end-point tumour volume (f) following a switch from HF to Psy diet. IgG: n = 8 mice; anti-PD-1: n = 10 mice; 2 independent cohorts. g–i, Flow cytometry analysis of intratumoural CD8+ T cells from anti-PD-1-treated mice, quantifying production of IFNγ (g) and TNF (h), and expression of CD44, CD11a, GZMB and PD-1 (i). Psy to HF: n = 4 mice; HF to Psy: n = 5 mice. j,k, Quantitative PCR (qPCR) to detect Lactobacillus spp. and Bacteroides spp. in fecal samples from anti-PD-1-treated mice in the Psy to HF diet switch model (j) or the HF to Psy diet switch model (k). n = 6 mice, each with paired stool samples that include one before and one 48 h after the diet switch. l, Psy donor to HF recipient FMT model schematic corresponding to m–o. Abx, antibiotic treatment. m,n, HKP1 tumour kinetics by calliper (m) and end-point tumour volume (n) in the Psy donor to HF recipient FMT model. IgG: n = 10 mice; anti-PD-1: n = 13 mice; 2 independent cohorts. o, PCoA (16S rRNA gene sequencing) using Bray–Curtis distance matrix at the ASV level for fecal bacterial DNA from the FMT trial. permutational multivariate ANOVA (PERMANOVA) test, n = 5 mice per group. Tx, treatment. Data are mean ± s.e.m. Two-tailed Mann–Whitney test (b,c,e–i,m,n), two-tailed Wilcoxon test (j,k).
fig-5.png · PDF 第 9 页
Fig. 5 | L. johnsonii underlies High Fat diet-associated ICI efficacy. a, PCoA (shotgun metagenomics) of Bray–Curtis dissimilarities in fecal microbiome after 3 weeks of obesogenic responder or non-responder diets. Shading shows 95% confidence intervals; vectors represent top 15 species by SIMPER; arrow length indicates magnitude of contribution and direction represents correlation with ordination axes. PERMANOVA test, n = 3 mice per group. b, LEfSe analysis for fecal bacteria species associated with obesogenic responder and non-responder diets (n = 3 mice per diet; top 15 taxa with P < 0.05, FDR < 0.1, LDA ≥ 2). Bubble size represents normalized relative abundance and bubble colour indicates family. Amer, American; Keto, Ketogenic; Med, Mediterranean. c, L. johnsonii abundance from metagenomic data in a,b. Ob_NR, obesogenic non-responder diet; Ob_R, obesogenic responder diet. d, Schematic for monocolonization (germ-free (GF)) and single-strain supplementation (specific pathogen-free (SPF)) models corresponding to e–h. e,f, HKP1 tumour kinetics by calliper (e) and end-point tumour volume (f) in the monocolonization model. L. johnsonii (Lj): n = 10 mice per group; PBS: n = 9 mice per group; 2 independent cohorts. g,h, HKP1 tumour kinetics by calliper (g) and end-point tumour volume (h) in the single-strain supplementation model. n = 5 mice per group. i, Schematic for human-to-mouse FMT from an ICI-refractory donor, corresponding to j–l. j,k, HKP1 tumour kinetics by calliper (j) and end-point tumour volume (k) in FMT recipient mice. High Fat diet plus IgG: n = 4 mice; all other groups: n = 5 mice. l, qPCR for L. johnsonii in faeces from FMT recipients after anti-PD-1 treatment. Psyllium: n = 5 mice; High Fat: n = 4 mice; one stool per mouse. m, Pathway enrichment (serum metabolomics) from obesogenic responder versus non-responder models. Bubble size represents pathway effect; bubble colour indicates significance. n, Normalized concentration (log2(ratio)) of tryptophan-derived (top) and tyrosine-derived (bottom) metabolites in obesogenic responders versus non-responders. HP, hydroxyphenyl. o–q, Normalized concentration (log2(ratio)) of serum DAT in anti-PD-1-treated mice from the monocolonization model (o; n = 5 mice per group), serum DAT in mice on obesogenic responder versus non-responder diets (p; n = 10 mice per group, including 5 mice per diet) and DAT in bacterial supernatants (q; n = 3 independent cultures). r, Schematic for generating diet-conditioned intratumoural T cells, corresponding to s. s, Flow cytometry for IFNγ and TNF from intratumoural CD8+ T cells after DAT stimulation, normalized to vehicle. n = 4 wells per group, with T cells from 5 mice per group. t, DAT supplementation trial schematic, corresponding to u,v. u,v, HKP1 tumour kinetics by calliper (u) and end-point tumour volume (v) in the DAT supplementation trial. n = 5 mice per group. w, Differentially abundant plasma metabolites from ICI responder versus non-responder patients with NSCLC. Fold change threshold = 1.2; P value threshold < 0.05. DHICA, 5,6-dihydroxyindole-2-carboxylic acid. x,y, Normalized concentration (log2(ratio)) of indolelactic acid (x) and 3-hydroxy-3-(3-hydroxyphenyl) propionic acid-O-sulfate (3-HPP sulfate) (y) in plasma of ICI responders (n = 32 patients) and non-responders (n = 21 patients). Data are mean ± s.e.m.; two-tailed unpaired t-test (c,l,s,x), two-tailed Mann–Whitney test (e,g,j,n,p,u,y), one-way ANOVA Kruskal–Wallis test (f,h), one-way ANOVA with Tukey’s multiple comparisons test (k,o,v) and one-way ANOVA with Dunnett’s multiple comparisons test (q). NS, not significant.
完整阅读记录与证据表
文献卡:Diet–microbiome synergy underlies obesity-associated immunotherapy efficacy
- Paper ID:p-0013-art-diet-microbiome-synergy-underlies
- 晨会:2026-09-17;分析日期:2026-09-17。
- 使用技能:article-read、morning-report、web-publish、pdf;代谢组附表用spreadsheets只读核查。
- Desharnais L, Swaby A, Messaoudene M, et al. Nature 657:505–516 (2026)。DOI:10.1038/s41586-026-10750-x;在线2026-07-08。
- 读取范围:主PDF全部36页,含正文、方法、参考文献、5主图、12扩展图及5页报告摘要;补充图PDF11页、补充表PDF11页已读。21份出版社附件均已归档;大型表仅核查结构与关键行,详见coverage.md。
- 人工核对:pending。
- 图表:figures/README.md、captions.md和manifest.json;38 PNG,其中网页选5主图。T4–7、T12及Source Data保留原始XLSX,宽/长表例外不逐页截图。
一句话结论
在所测小鼠肿瘤模型中,饮食与肠道菌群共同影响抗PD-1反应,部分效应可在长期肥胖充分形成前出现;约氏乳杆菌与DAT干预提供机制线索,人体代谢物关联及供者FMT为后续转化研究提供线索。
研究问题与背景
作者从临床高BMI与较好ICI效果的关联出发,追问肥胖、饮食和菌群各自的贡献。既往关联属本文转述,不视为已独立核读所有临床队列。本研究通过多个小鼠饮食模型与可逆干预分析这些因素的贡献。(PDF第1–2页)
贡献与比较对象
12种配方覆盖不同代谢表型,再比较同一饮食下IgG与抗PD-1、两个方向换食、不同受体饮食下FMT,以及有/无Lj或DAT的组合。High Fat、Ketogenic和Mediterranean分别为本文定义的小鼠配方,包含多种成分差异。(图1–5;补充表1–2)
方法与验证
| 环节 | 实验单位与条件 | 方法/来源 |
|---|---|---|
| 12饮食表型 | 5周龄雄性C57BL/6小鼠起始,主要15周模型;体重共两队列,多数饮食n=15、Japanese n=14 | PDF第13、15页;图1;补充表12 |
| 代谢评分 | 体重30%、脂肪量30%、GTT 20%、胰岛素20%;各指标归一化,缺值以组均值补齐;不含瘦素 | 第15页;扩展图1k |
| 跨饮食ICI比较 | 主要为HKP1肺癌来源细胞皮下移植瘤;每饮食治疗/对照约3–5鼠,具体分析集可不同 | 第13–15页;图2;T12 |
| ICI评分 | (同饮食IgG末次体积均值-治疗鼠末次体积)/IgG标准差 | 第15页;标准化肿瘤体积评分;对照小样本方差影响评分 |
| 菌群 | 16S、宏基因组、qPCR;测序子集不一定等于全部荷瘤鼠;宏基因组4饮食各3鼠 | 第15–16页;图5a–c |
| 单菌验证 | 雌性GF及经抗生素预处理的SPF鼠;Lj系患者来源的特定分离株 | 第13–16页;图5d–h;扩展图9 |
| DAT离体 | 肿瘤浸润T细胞,4孔/组,细胞来自5鼠/组;归一化至vehicle;不是4个独立患者 | 图5r–s;图注第10页 |
| 代谢组 | 小鼠血清、患者血浆和菌培养上清;化学同位素标记LC–MS,输出归一化比值,不是绝对血药浓度 | 第16–17页;T4–7 |
| 患者 | 53人血浆(R32/NR21);单一NR供者FMT;另9人按BMI分组FMT,三个证据集不混用 | T3、8、9;图5、扩展图10 |
核心证据
下列“已核”表示AI已查看原文图/表及相应文字;人工核对待完成,统计未独立重算。
| 主张或结果 | 数字、条件及比较基线 | 来源 | 类型/核对 |
|---|---|---|---|
| 代谢状态与外周免疫有关 | 12饮食均值:CD4比例r=−0.8042,P=0.0025;CD8 r=−0.5874,P=0.0489;单核r=0.6154,P=0.0373 | PDF3,图1i–l | 图表;已核,比例分母见图 |
| ICI评分不随代谢异常简单增加 | 代谢评分r=0.3566,P=0.2560;体重r=0.3706,P=0.2367 | PDF22,扩展图4 | 图表;所列相关性未达显著性阈值 |
| 66.7%与33.3%为模型占比 | 6种高代谢饮食中4种被作者归R;6种低代谢饮食中2种归R | 扩展图4h | 不是患者/小鼠个体ORR |
| 应答相关菌群 | 乳杆菌属与ICI评分r=0.7552,P=0.0062;Inulin为低乳杆菌仍应答的例外 | PDF23,扩展图5f;图3 | 乳杆菌属水平的相关分析 |
| 短期饮食仍有治疗差异 | 图3m High Fat末次比较P=0.016,倒数第二点P=0.008;Psyllium无同样显著效应 | PDF6,图3m | 两个时间点分别报告P值 |
| 换食恢复治疗反应 | Psy→HF,IgG/抗PD-1各10鼠,末次P=0.0153;HF→Psy,10/8鼠,P=0.5444 | PDF8,图4c、f | 两队列;NS不证明等效 |
| 48小时菌群变化 | 6鼠配对;Psy→HF乳杆菌升、拟杆菌降,均P=0.0312;HF→Psy拟杆菌升P=0.0938 | 图4j–k | 不将反向两菌均称显著 |
| CD8功能状态随换食不同 | IFNγ、TNF P均0.0159;CD44 0.0159、CD11a 0.0317;GZMB 0.1111、PD-1 0.0635 | 图4g–i,4/5鼠 | 刺激后比例,不是所有指标均上升 |
| 非应答菌群仍受受体饮食影响 | Psy供者FMT、HF受体:IgG10鼠/抗PD-1 13鼠,P=3.5×10⁻⁶;PBS+HF恢复对照不显著 | 图4l–o;扩展图8i | 不是FMT或菌群完全不需要 |
| Lj组合引起肿瘤退缩 | GF:Lj各10鼠、PBS各9鼠;Lj+抗PD-1相对Lj+IgG末次P=0.0008 | 图5d–f | 两队列;组合功能支持 |
| SPF组接近清除 | 5鼠/组;5h的Lj+抗PD-1记录0、0.02058419、0、0、0 cm³ | 图5g–h;MOESM13的5h!E4:E8 | 原文“complete”不改写为5/5治愈 |
| 单一NR患者菌群移植 | 1供者;HF+IgG n=4,其他各5;HF治疗比较P=0.0047;Lj qPCR HF4/Psy5,P=0.0111 | 图5i–l;T3 | 改善发生在小鼠,不是供者患者 |
| DAT相关代谢信号 | 肥胖R与NR各10鼠:P=2.2×10⁻⁵;Lj+HF的GF鼠信号升高;培养每条件3份独立培养 | 图5n–q;T4–6 | 需保留混合候选注释 |
| DAT口服配合治疗 | 四组各5鼠;联合相对vehicle+IgG、vehicle+抗PD-1、DAT+IgG分别P=0.0015、0.0041、0.0097 | 图5t–v | 未证明内源DAT必要或患者获益 |
| 人体代谢相关性 | R32/NR21;ILA P=0.0226,3-HPP sulfate P=0.0045;48份治疗前、5份较晚(3R/2NR) | 图5w–y;T7–8 | 探索性、非全基线预测研究 |
| 高BMI供者移植 | 低BMI3人、高BMI6人;MCA205受体普通饲料;每治疗臂分别15/30鼠,总90鼠 | 扩展图10h–i;T9;MOESM21的10i | 人体独立单位仍仅9供者 |
| BMI分层比较 | BMI<25组内治疗P=0.3777,≥25组P=0.0034;未报告正式交互检验 | 扩展图10i | BMI分层间效应差异仍待交互检验 |
局限
作者明确指出
作者不将结果解释为所有致肥胖饮食都有益,指出具体营养成分、菌株差异、宿主环境及性别等问题仍需研究;Lj相关DAT信号也可能与菌株或疾病情境有关。ILA富集并不在本文模型中专门依赖Lactobacillus。(PDF第10–11页)
AI推断与理由
- 12种饮食是有限的组均值样本,相关性不显著不足以排除其他条件下的代谢作用。多个营养成分同时变化,也无法把疗效归因于单一脂肪或纤维因素。
- 实验按笼随机,未盲法;报告摘要未作正式样本量估算,饮食在不同队列分批比较。笼内相关、批次和提前人道终点后的排除可能影响结果,应避免把所有鼠视为完全独立、所有分析共用同一分母。(PDF第17、32–36页;T12)
- T细胞表型需看分母和刺激条件;PD-1⁺Ki-67⁻不等于已经实证耗竭,比例变化不等于细胞绝对数增加。图3按饮食应答类别分组,不是每只鼠单独定义临床式应答。
- 单菌和DAT功能干预支持其贡献,尚未用菌株合成路径缺失、稳定同位素示踪或内源代谢物选择性耗竭闭合必要性证据。本文的化学同位素标记质谱不等于体内代谢通量示踪。
- 53名患者并非全部基线采样,治疗方案和PD-L1等存在差异;图5w使用fold-change与P阈值,未说明该火山图达到全代谢组FDR控制,未报告外部验证。临床应答判定的具体RECIST版本/时间阈值在本次取得的本文方法及T8中未定位,沿用作者R/NR标签。
- BMI≥25包含超重,不能统一写肥胖。9供者FMT重复到90只鼠并不增加人群独立样本量,需考虑供者聚类与年龄、性别、PD-L1等混杂;BMI24.95供者的敏感性亦显示阈值依赖。
代谢组与原文一致性核对
- 代谢物身份:T4行1404、T5行1544、T6行2055的K列均为“Desaminotyrosine/3-(3-Hydroxyphenyl)propionic acid”一类并列注释,J列Tier 1;图5n却简写DAT/3-(4-HP)-propionic acid。保留原文件,不把3位/4位名称差异自行抹平。功能实验使用外加DAT,与混合候选峰的内源来源鉴定应分开。
- 人体DAT与3-HPP:T7既含C-T1882(行4015)Tier 1 DAT条目,也含A-T3111(行1362)的多候选条目;人体DAT检出情况按这两类注释分别记录。图5y重点展示的是另一物质3-HPP sulfate,对应T7行477,Tier 2注释;该显著性对应3-HPP sulfate;Lj在人内生产DAT的直接证据仍待补充。
- ILA:T4行3656、T7行4027为Tier 1 ILA;T4另有Tier 2异构体条目行3628。T5未检得相应ILA注释。扩展图10c的多数ILA/vehicle比值仍低于1,“在所选吲哚物中相对较高”描述吲哚物之间的相对比较。
- 接近清除与完全应答:原文对图5g–h使用完全应答措辞,但Source Data 5h存在一个非零末次值(0.02058419 cm³)。未定位作者判为完全应答的体积阈值;保留措辞/数值差异,不推断实验造假或结果无效。
- 时间轴:图5u末端轴标22日,而Source Data 5u最后记录日为20,方法亦写day20;阅读页不基于此差异推算治疗天数。图5t中DAT虚线从day0开始,与方法一致,不列为时间冲突。
- 扩展图6e–f:图注写3周饮食,而图中流程12周加3周抗生素、方法描述15周模型;原始时程存在指代不一致,不能自行确定同一组究竟采用哪种时程。
- T10示例表:American 35.5g/334µg、Ketogenic 33.4g/355µg与表题10mg/kg的算术对应不一致;脚注说明是示意均值,实际按队列体重计算。实际动物给药量仍需原始记录核实。
- 避免过宽的无差异表述:扩展图5b中American Chao1及Aspartame Shannon的IgG/抗PD-1比较P=0.028571;扩展图11 Japanese部分时间点FDR=0.0465。不能概括为治疗或荷瘤阶段从不影响菌群多样性/组成。
- 边缘或阴性结果:扩展图6的YUMMER1.7末次P=0.056;扩展图8c的部分TNF比较P=0.0789;扩展图10e DAT+Psy粪上清的IFNγ比较P=0.1230。扩展图9中M. gordoncarteri在GF下有部分效应、Lj在Psy下亦有部分效应,均不支持“只有一种菌/一种饮食有效”。
待核对问题与后续阅读
优先人工核对代谢物异构体注释、完全应答阈值、扩展图6时程、图5u时间标注,以及患者应答定义。当前资料支持功能贡献,尚不足以确定Lj–DAT路径必要性或临床获益。
- Kennedy等,Nature 642:747–755 (2025),DOI10.1038/s41586-025-08937-9:已核正式题录与摘要,未全文精读;关注受体饮食与菌群恢复的关系,其终点不能与抗肿瘤疗效等同。
- Joachim等,eBioMedicine 97:104834 (2023),DOI10.1016/j.ebiom.2023.104834:仅核题录与研究问题,未完成全文复核;后续可追DAT与T细胞启动机制。
- 全文引述的临床队列、其他FMT/菌株文献没有逐一独立核读;PRJNA1468761测序数据、质谱原始谱图与全部Source Data未重分析。