跨癌种的uPAR高表达状态
uPAR是PLAUR编码的细胞表面受体。本文把公共转录组、组织蛋白检测和空间分析结合起来,研究它是否能成为跨癌种CAR T靶点。(PDF第2–7页)
对1,074份肿瘤的多重免疫荧光分析中,约15%达到“超过50%的肿瘤细胞为uPAR阳性”的高表达标准;这一比例受纳入癌种及样本构成影响。部分癌种按肿瘤取材计数,1,074为纳入检测的肿瘤样本数。(图1A、PDF第3、17页)
在TCGA等转录组中,高PLAUR表达与TP53失活、RAS/MAPK通路改变及EMT、伤口修复、纤维化等程序相关。单细胞数据提供了肿瘤细胞内的支持,但bulk RNA仍混有基质来源信号。(图1B–E、补图S1)
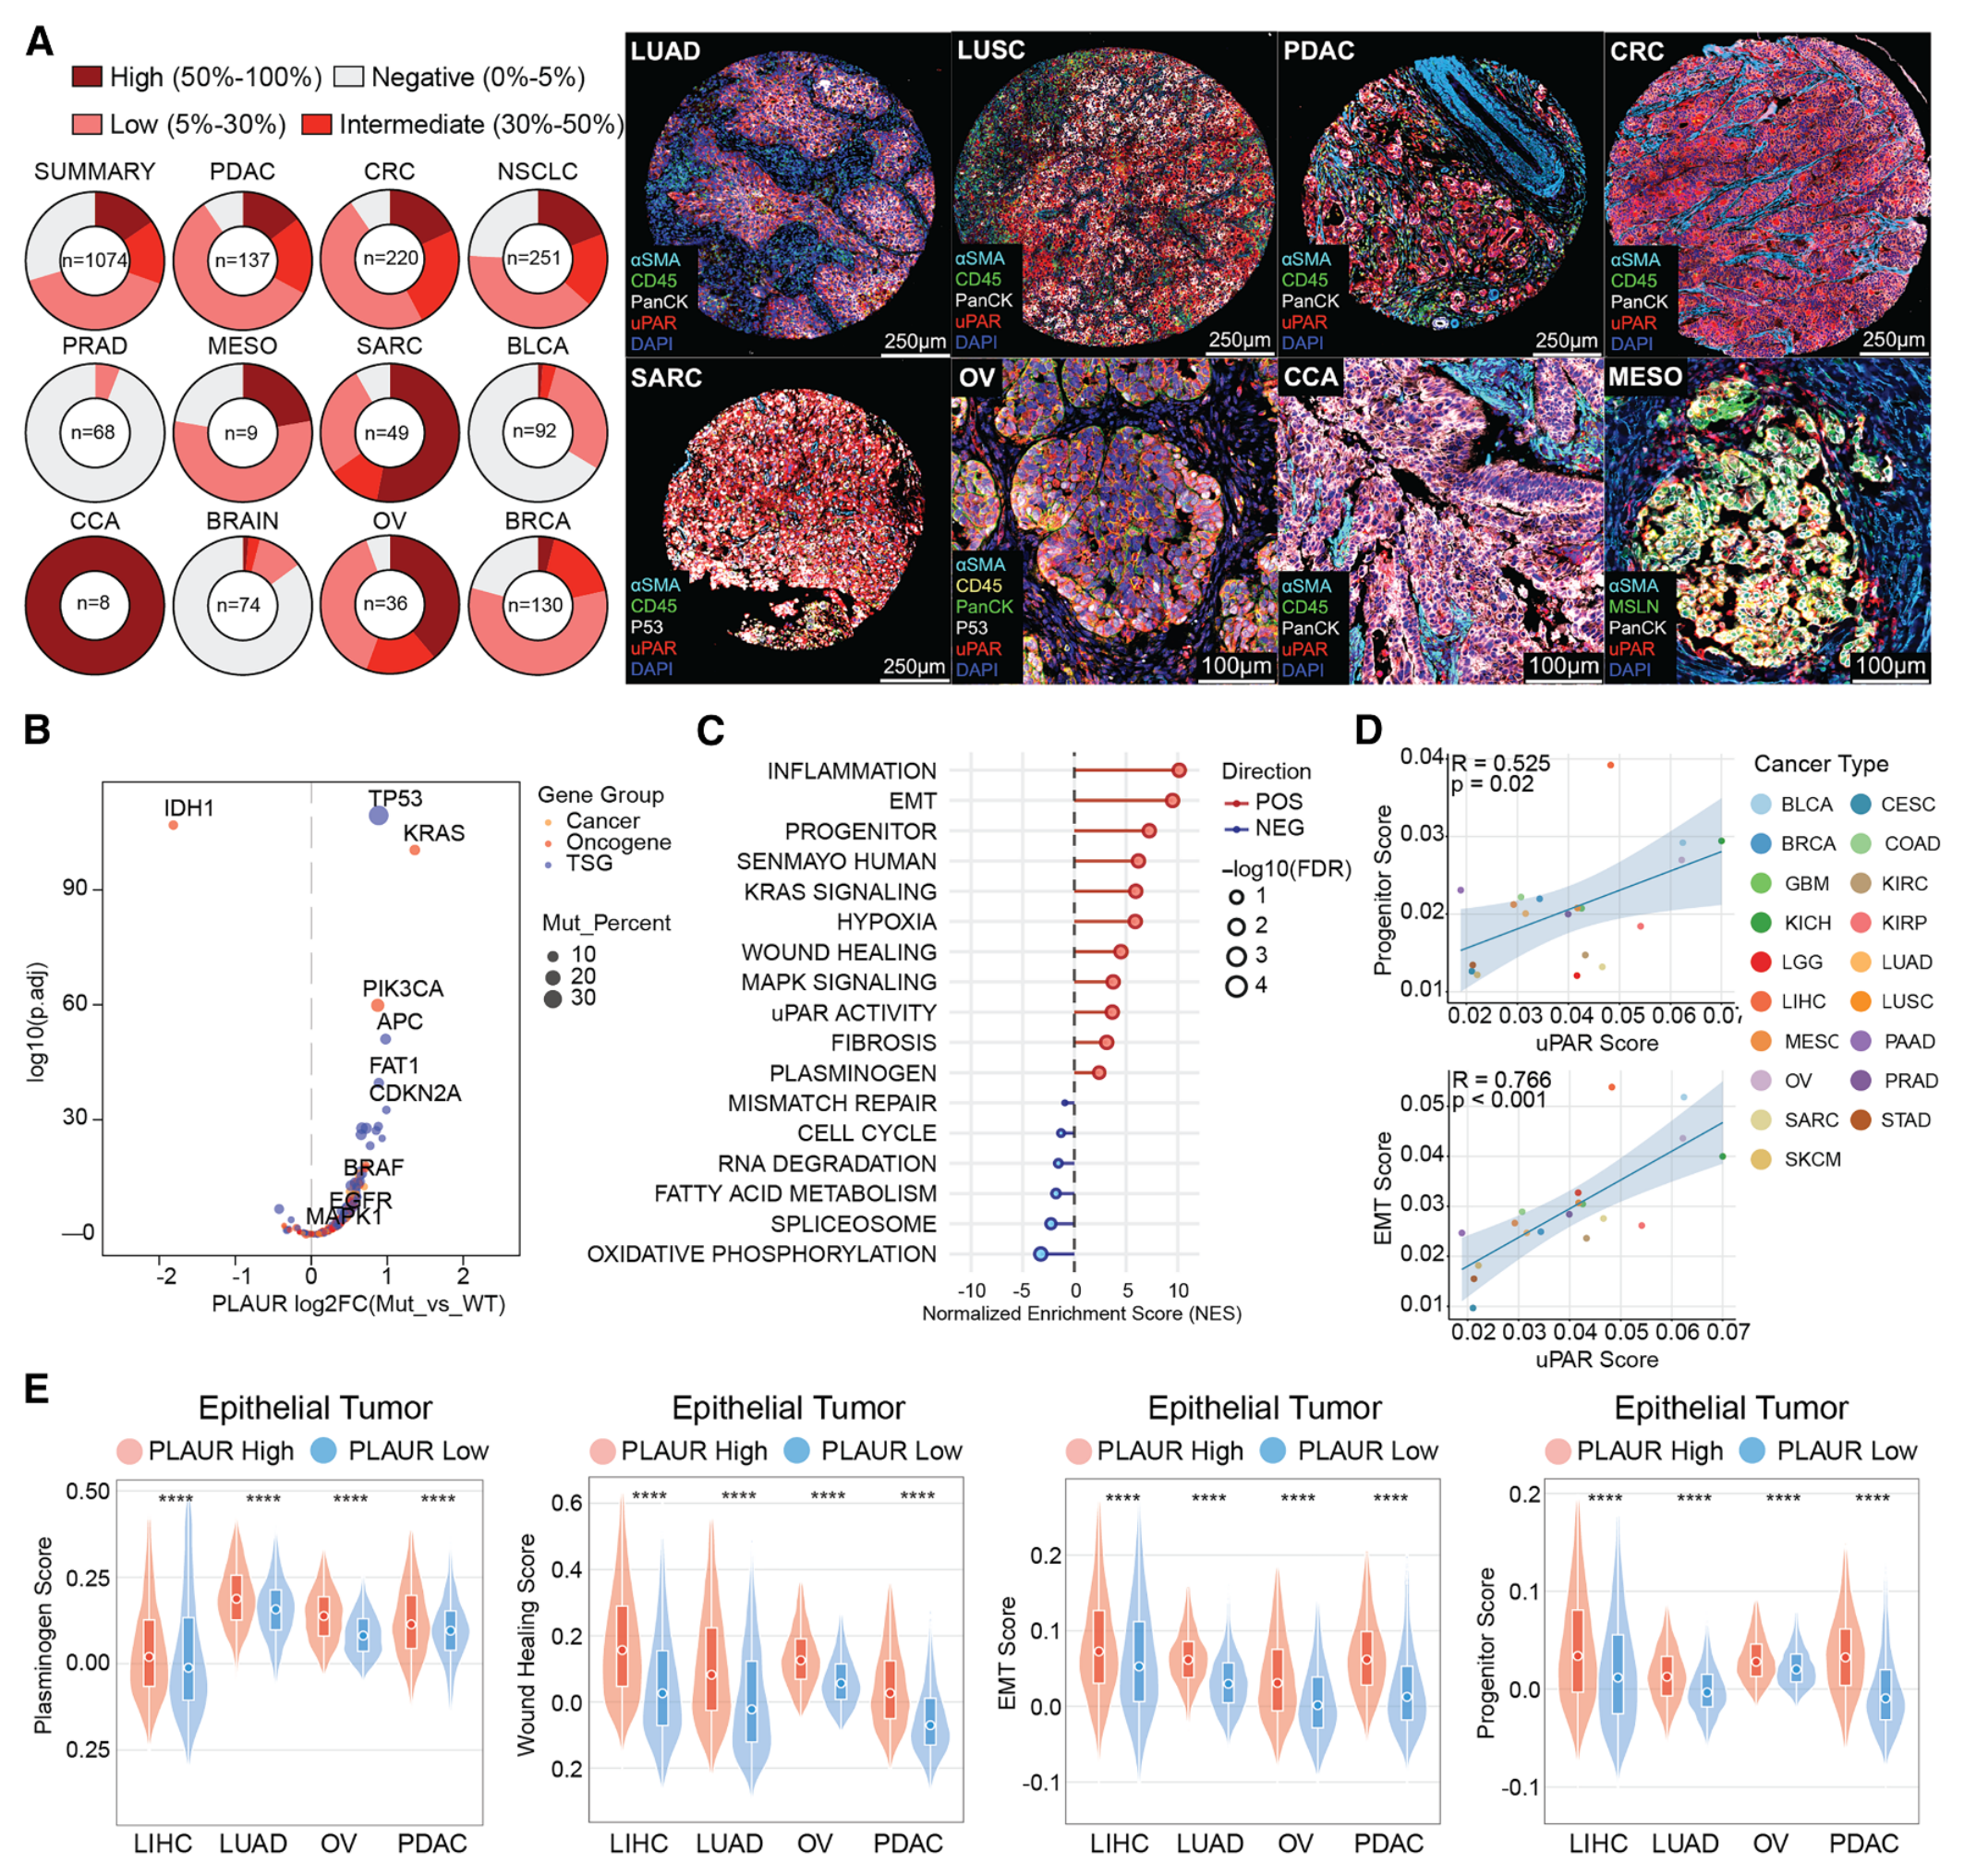
图1 · uPAR表达与肿瘤细胞状态 · PDF第4页。
uPAR阳性细胞的空间分布
一份未经治疗的胰腺导管腺癌标本的Xenium分析显示:uPAR高表达的基底样肿瘤细胞,与uPAR阳性的成纤维细胞、单核/巨噬细胞在局部邻域聚集。相邻切片的免疫荧光支持蛋白层面的共定位。24标记成像又在胰腺、肺和结直肠癌的多个亚型中观察到相似组织结构,其中胰腺癌的免疫排斥特征最明显。(PDF第5–7、37–38页)
两类细胞呈现不同的状态特征:癌细胞以祖细胞样、EMT及可塑性程序为主;邻近部分成纤维细胞和髓系细胞富集衰老相关特征。p16和表达签名支持“衰老样”描述。(图2、补图S2–S3;局限见PDF第17页)
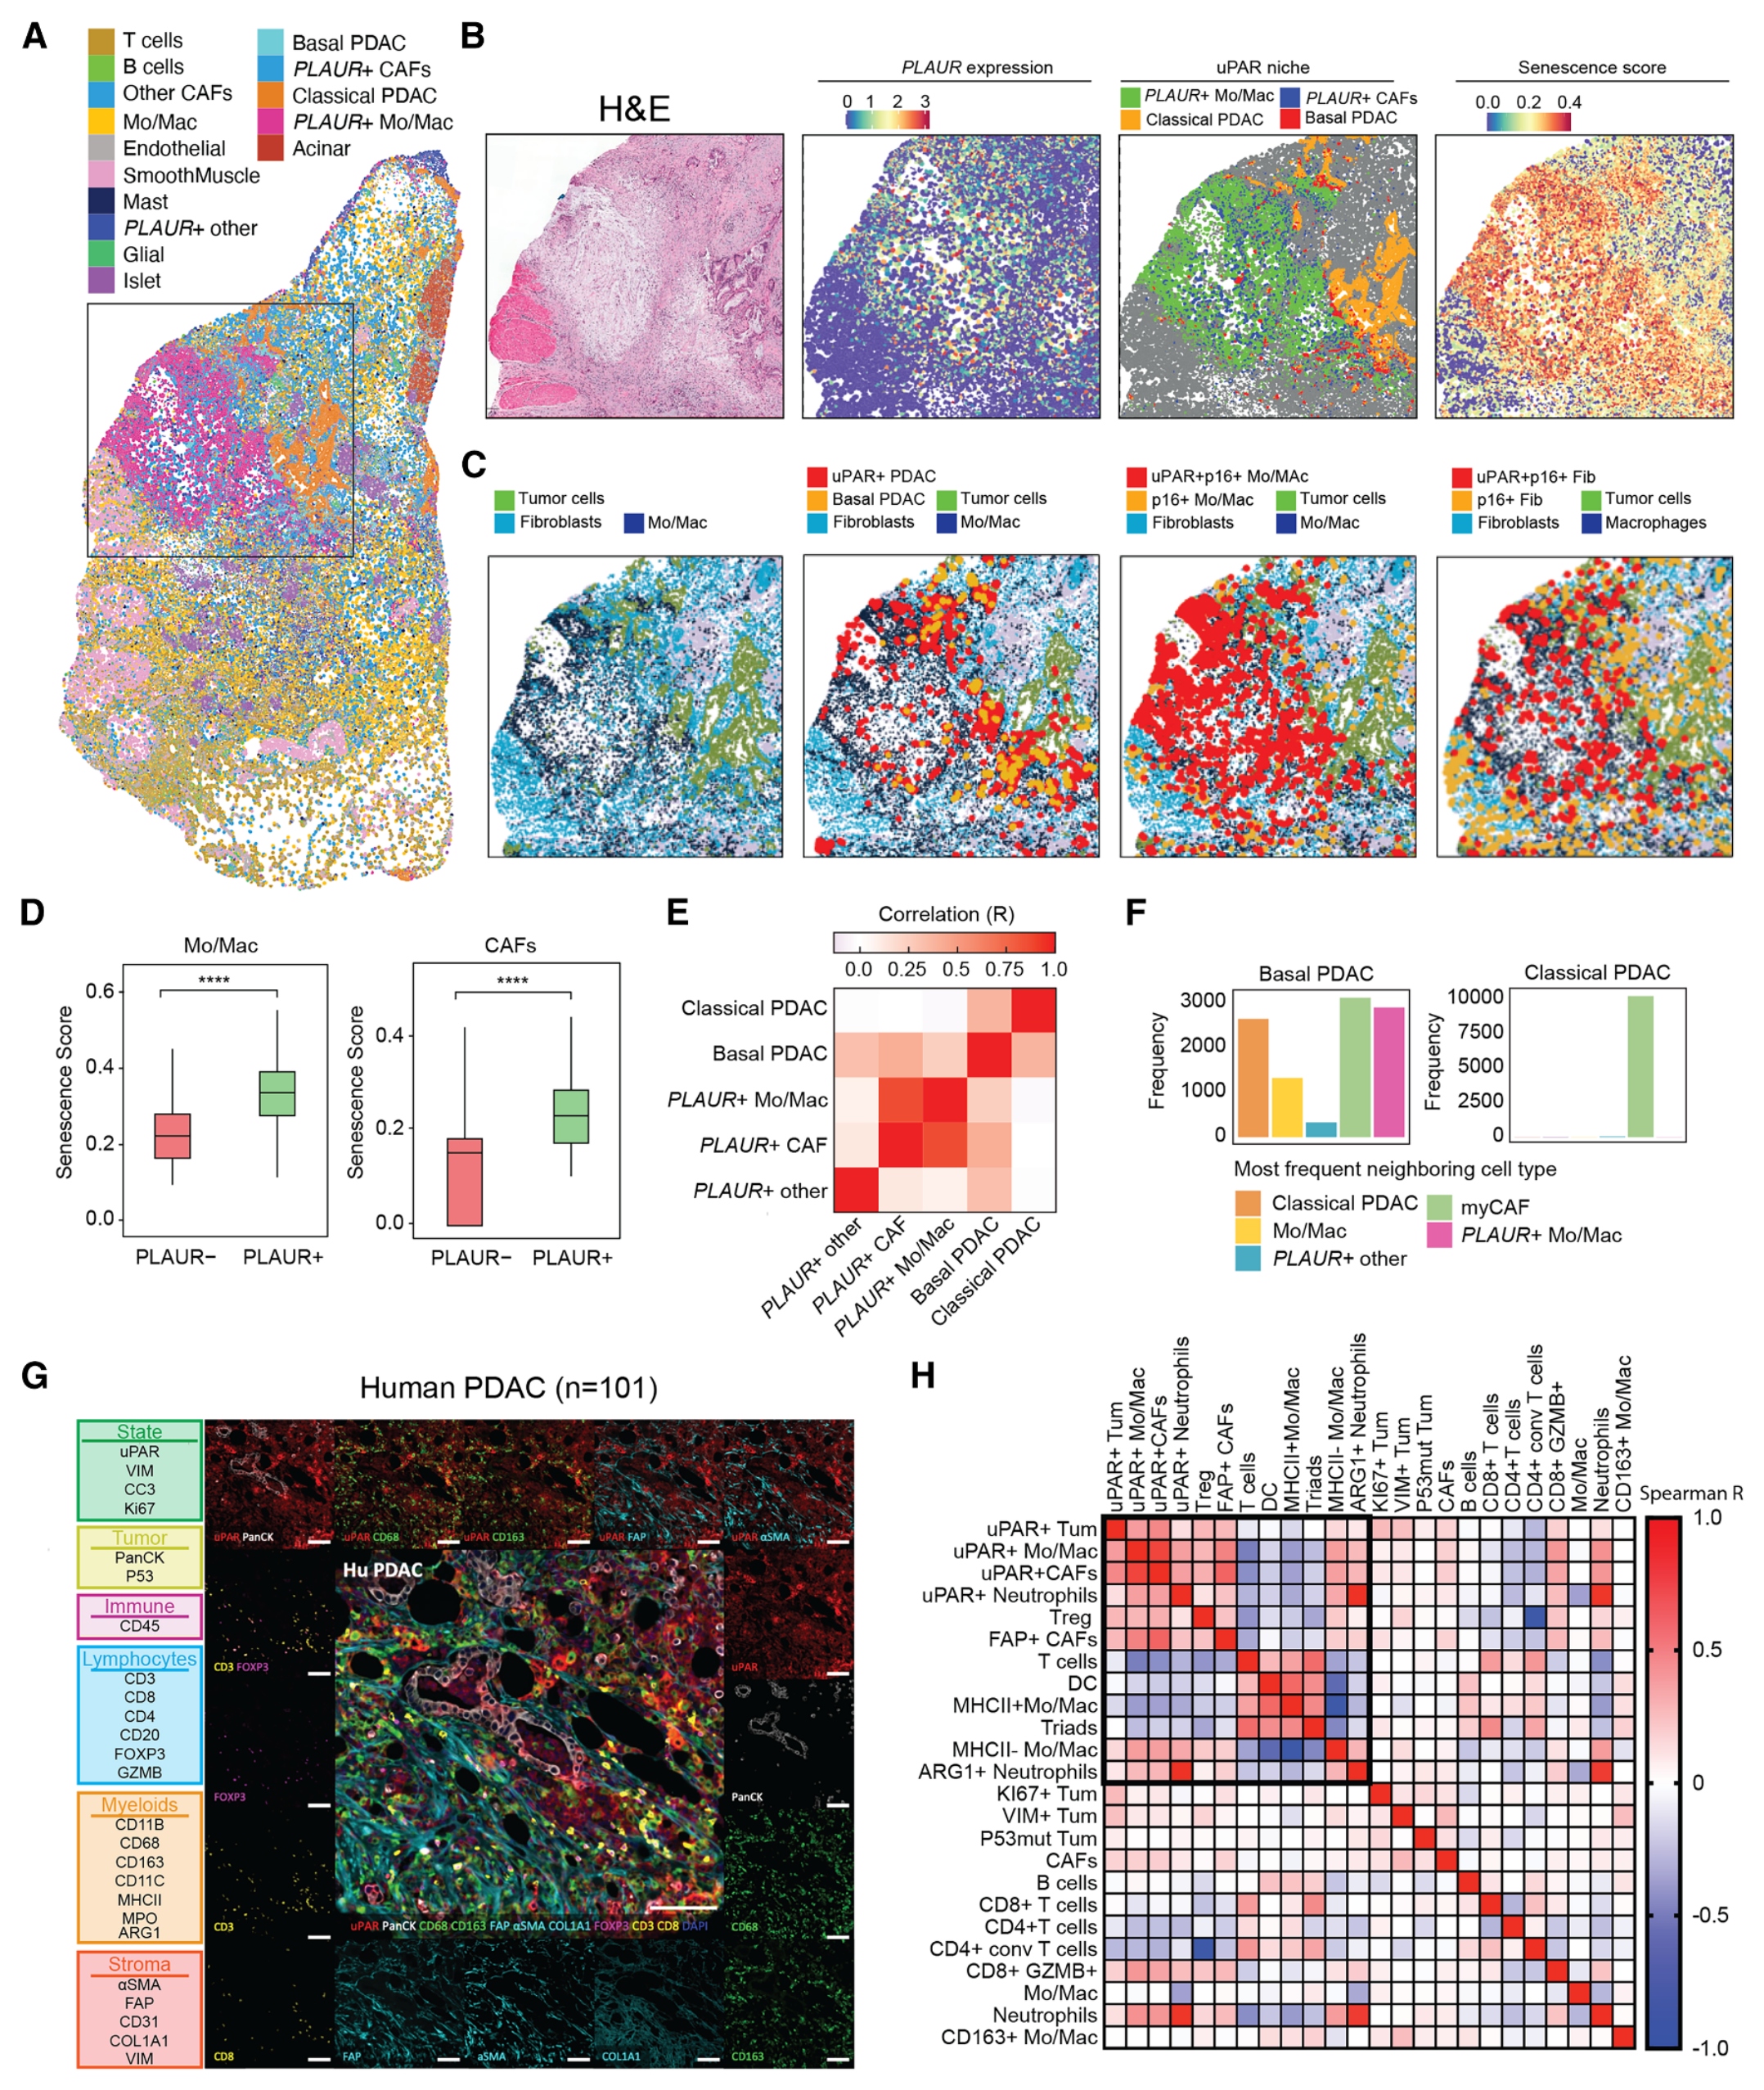
图2 · 肿瘤、成纤维细胞与髓系细胞的uPAR阳性邻域 · 图片PDF第5页,图注第5–6页。
抗原依赖的杀伤与多模型反应
作者开发的人uPAR识别分子T1和A1结合D2–D3区域。这个区域在uPAR的D1被切割释放后仍可能保留在膜上,为靶点选择提供依据。uPAR敲除后,靶细胞对CAR T的敏感性明显下降,支持抗原依赖的作用。(PDF第7页、补图S4)
在71种人癌细胞系的定量分析及相关体外实验中,作者提出约1,500个uPAR分子/细胞以上可支持较强杀伤。这是特定检测与CAR构型下的实验观察,独立Data S1未取得。(PDF第7、34页、图3B)
肺癌、胰腺癌和卵巢癌异种移植模型中,uPAR CAR T相对CD19 CAR对照降低肿瘤负荷、延长生存,部分获得长期完全消退。模型间反应并不一致,也有残留或复发;实验采用人源T细胞和肿瘤移植模型。(图3、补图S5)
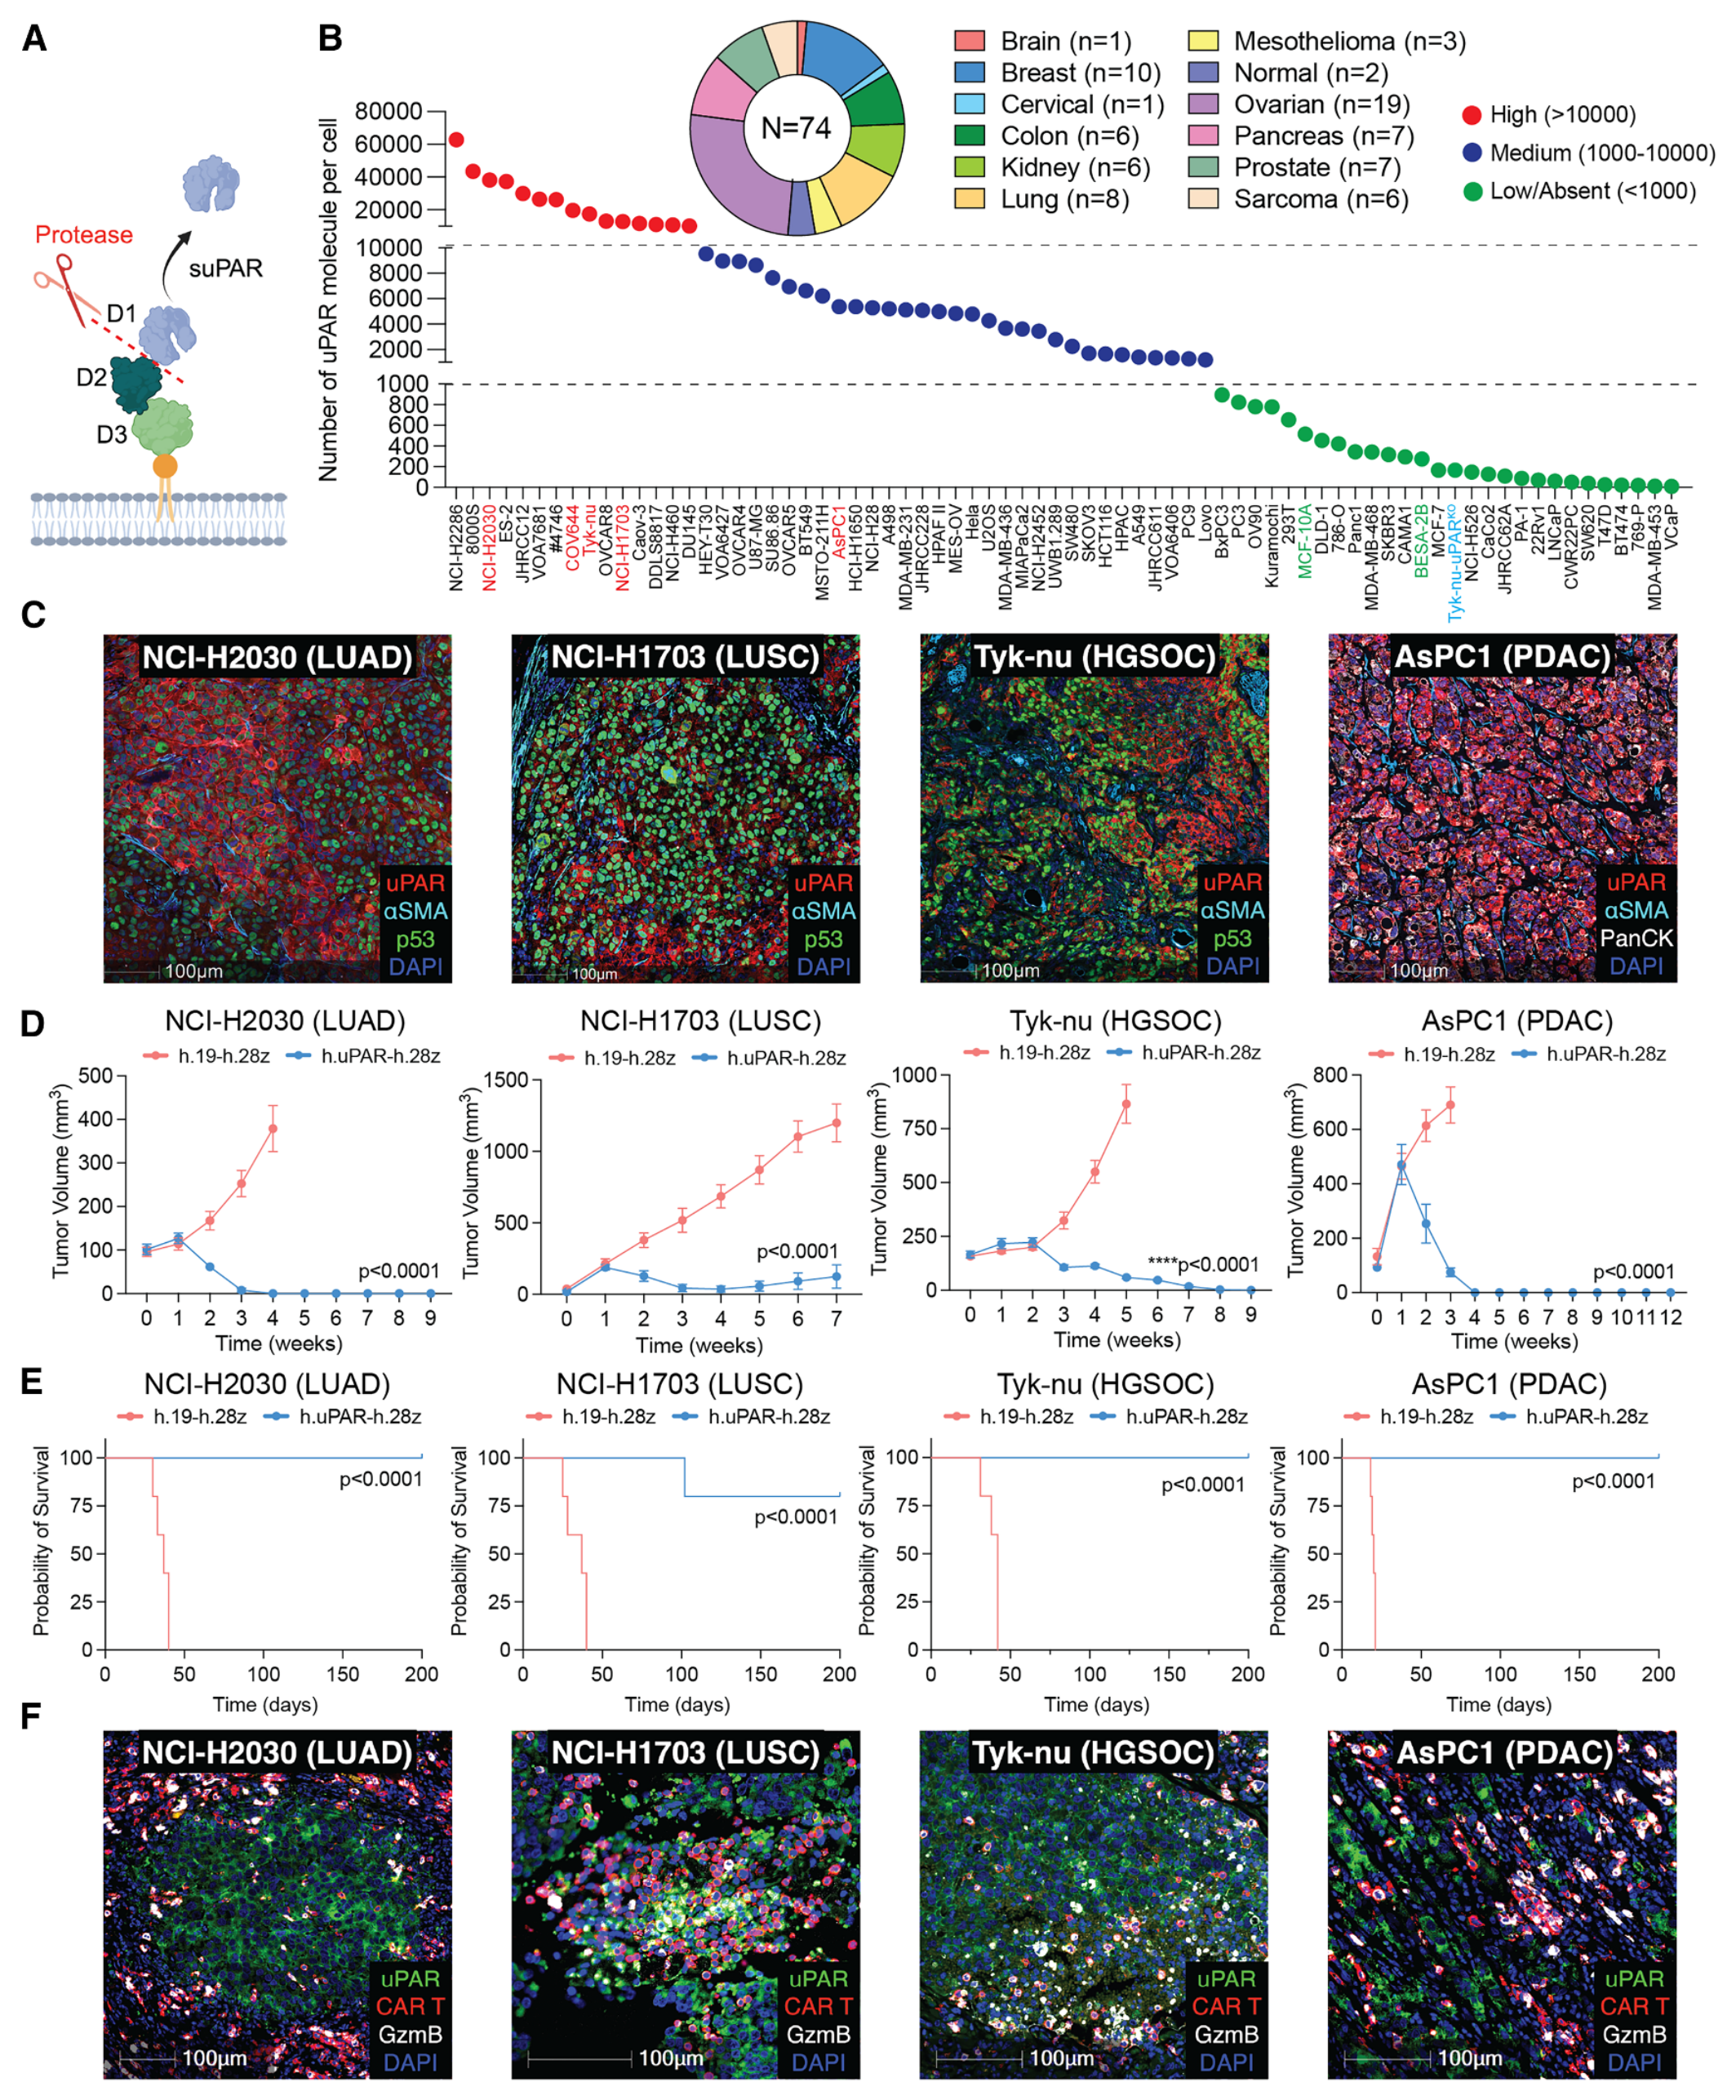
图3 · 抗原密度、肿瘤控制与CAR T浸润 · PDF第8页。
卵巢癌原位与播散模型
在Tyk-nu和COV644模型中,uPAR CAR T抑制原位和腹腔播散病灶;模拟减瘤手术后残余病灶的实验,也观察到比手术加对照CAR更持久的疾病控制。部分播散模型小鼠无瘤超过150天。(PDF第10页、图4、补图S6–S7)
uPAR抗体PET成像能够显示模型中的病灶及治疗后的信号变化;血中可溶性uPAR也随肿瘤负荷变化。但在人群中,可溶性uPAR同时受炎症和纤维化影响。PET与血液监测在这里均属于临床前证据。(PDF第10、17页)
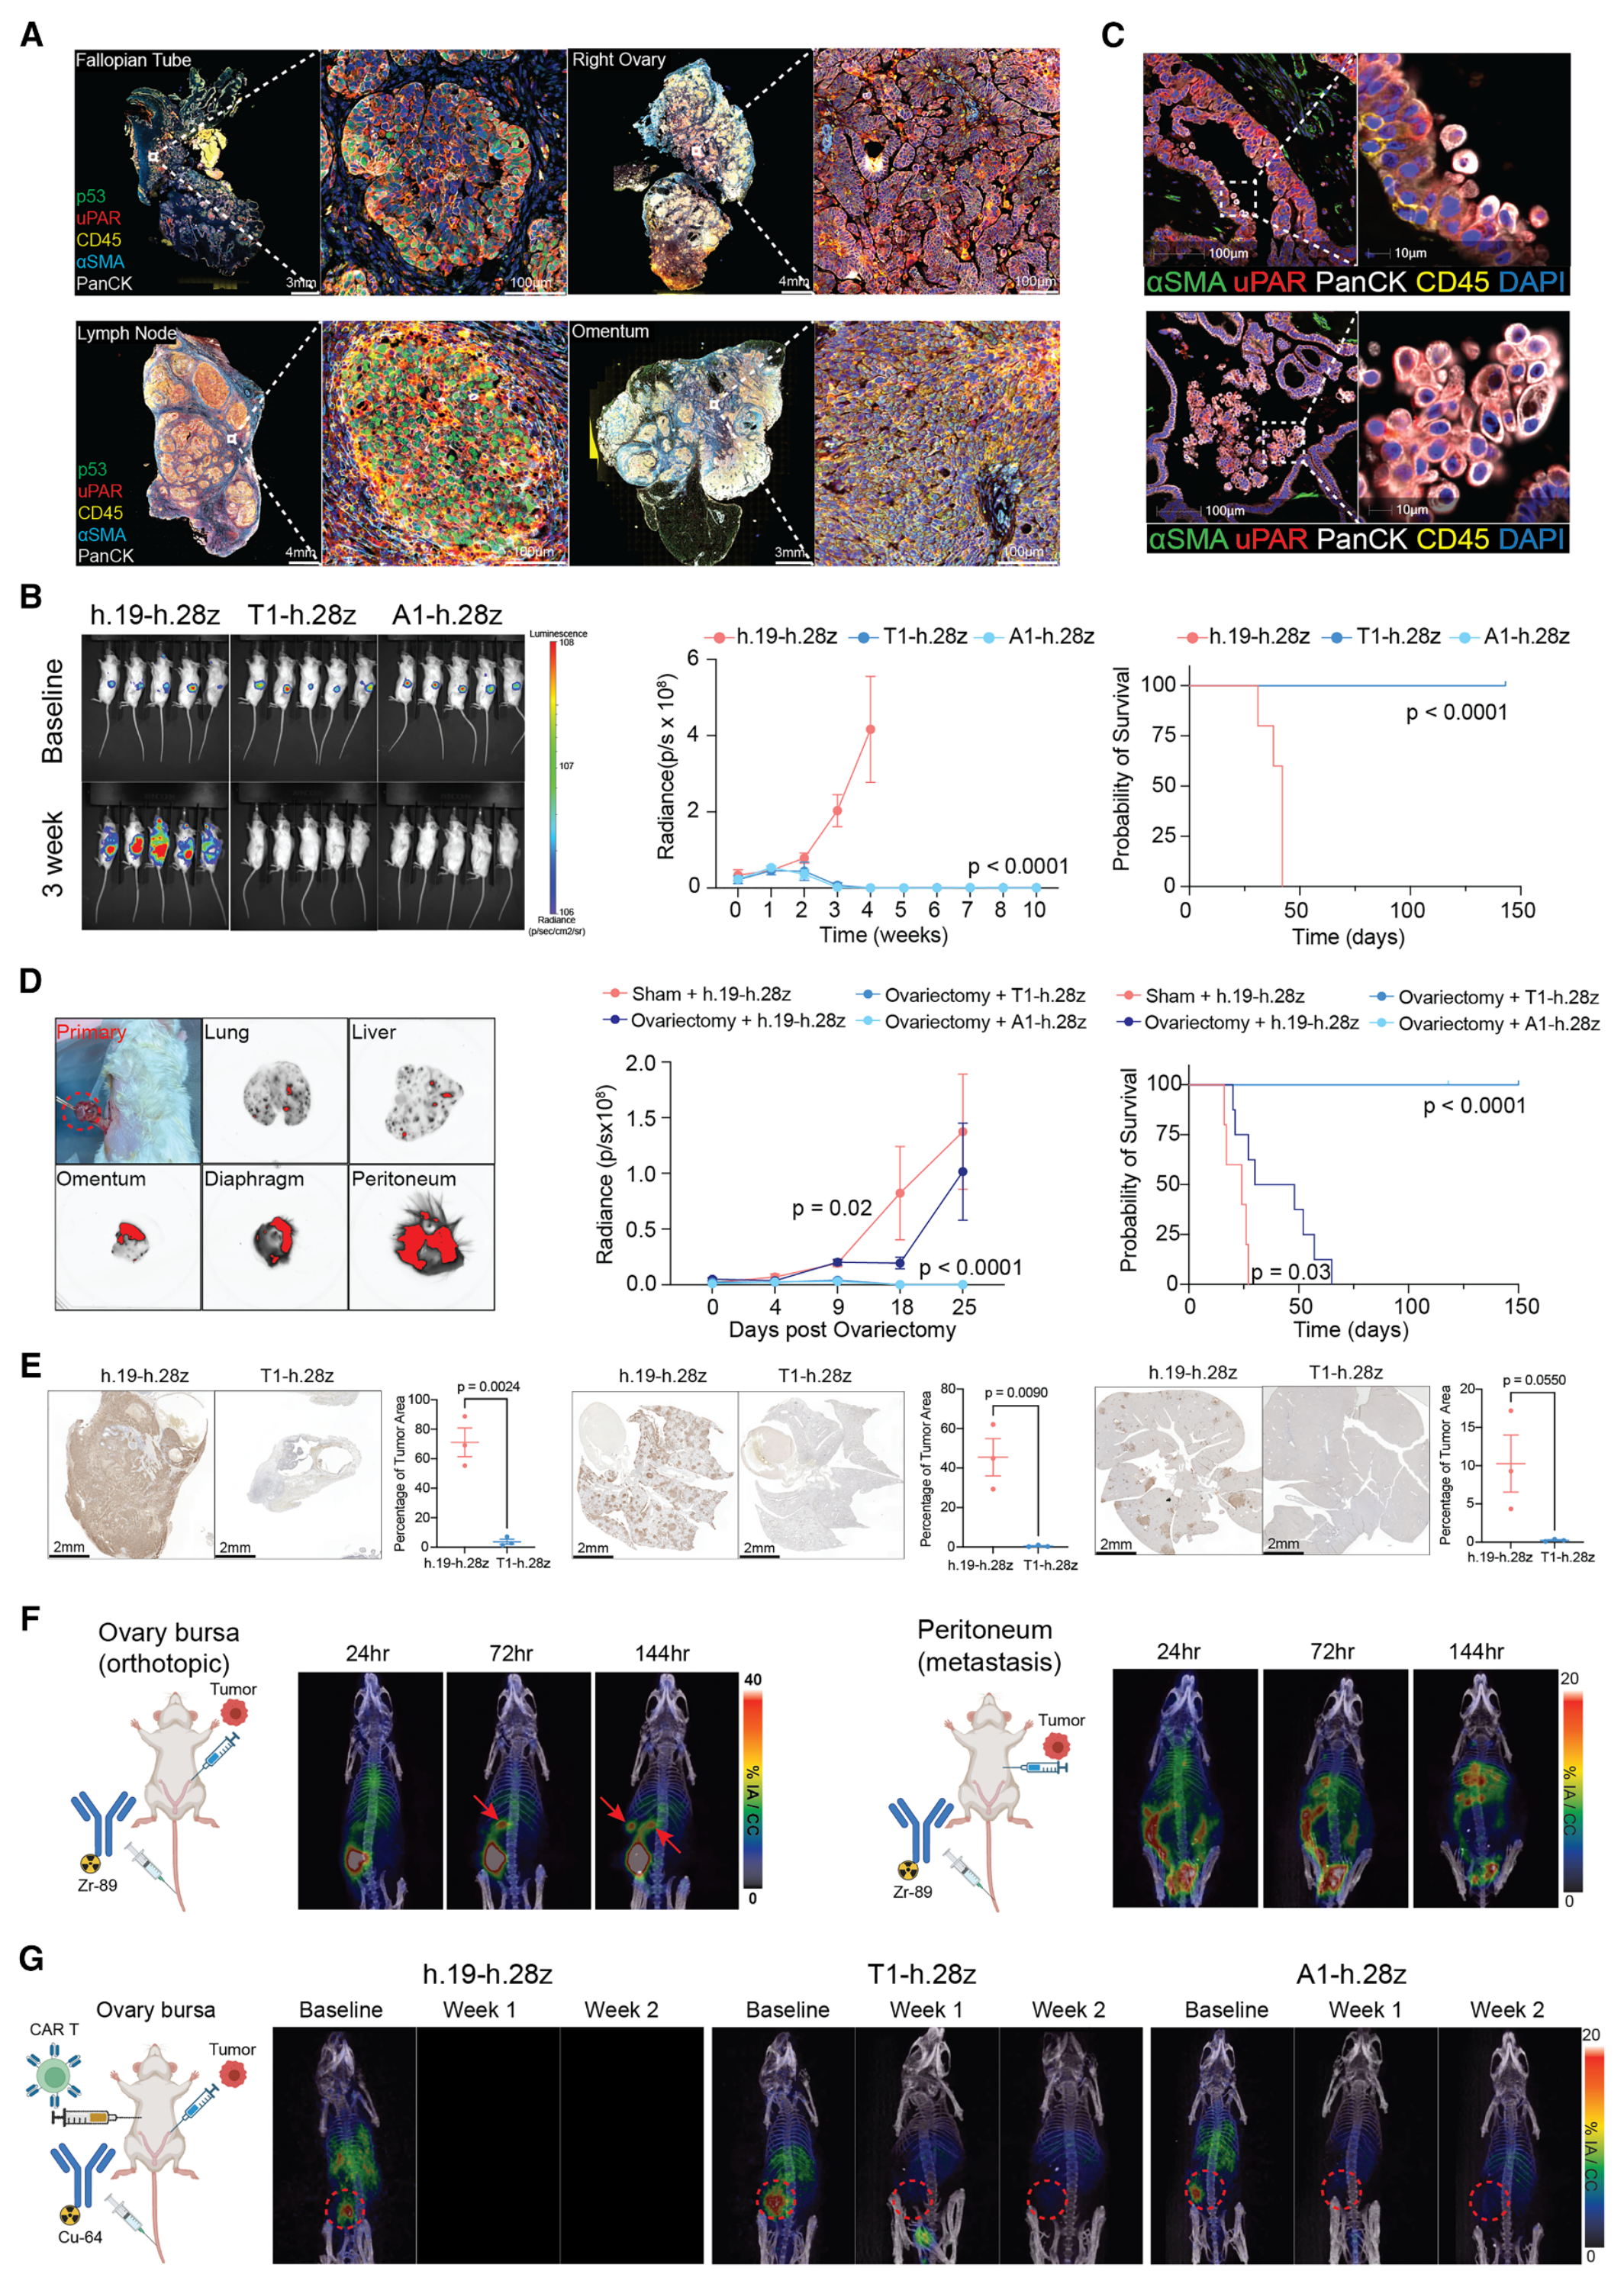
图4 · 卵巢癌模型中的疗效与uPAR成像 · 图片PDF第9页,图注第10页。
同时靶向肿瘤与基质的证据
人uPAR CAR不能识别鼠uPAR。作者利用这一物种差异,在人肿瘤异种移植中分别靶向人癌细胞和鼠源基质,再进行组合比较。降低人uPAR CAR剂量后,单独靶向肿瘤只能短暂控制疾病;加入靶向鼠uPAR的CAR T后,肿瘤控制更持久,并伴随纤维化减少和CAR T浸润增加。实验还设置了加入CD19 CAR的对照,以帮助排除单纯增加T细胞数量的解释。(PDF第10–12页、图5、补图S8)
患者组织的离体实验提供另一层支持:4例高级别浆液性卵巢癌的解离样本中,uPAR阳性肿瘤细胞、CAF及部分髓系群体受到靶向。各群体的统计支持强弱不同,例如图5I的GPNMB阳性髓系群体比较P=0.0694,该比较未达统计学显著。另有1例肺癌样本及原代CAF、M2样巨噬细胞实验,样本量仍小。(PDF第12、35–36、56–57页)
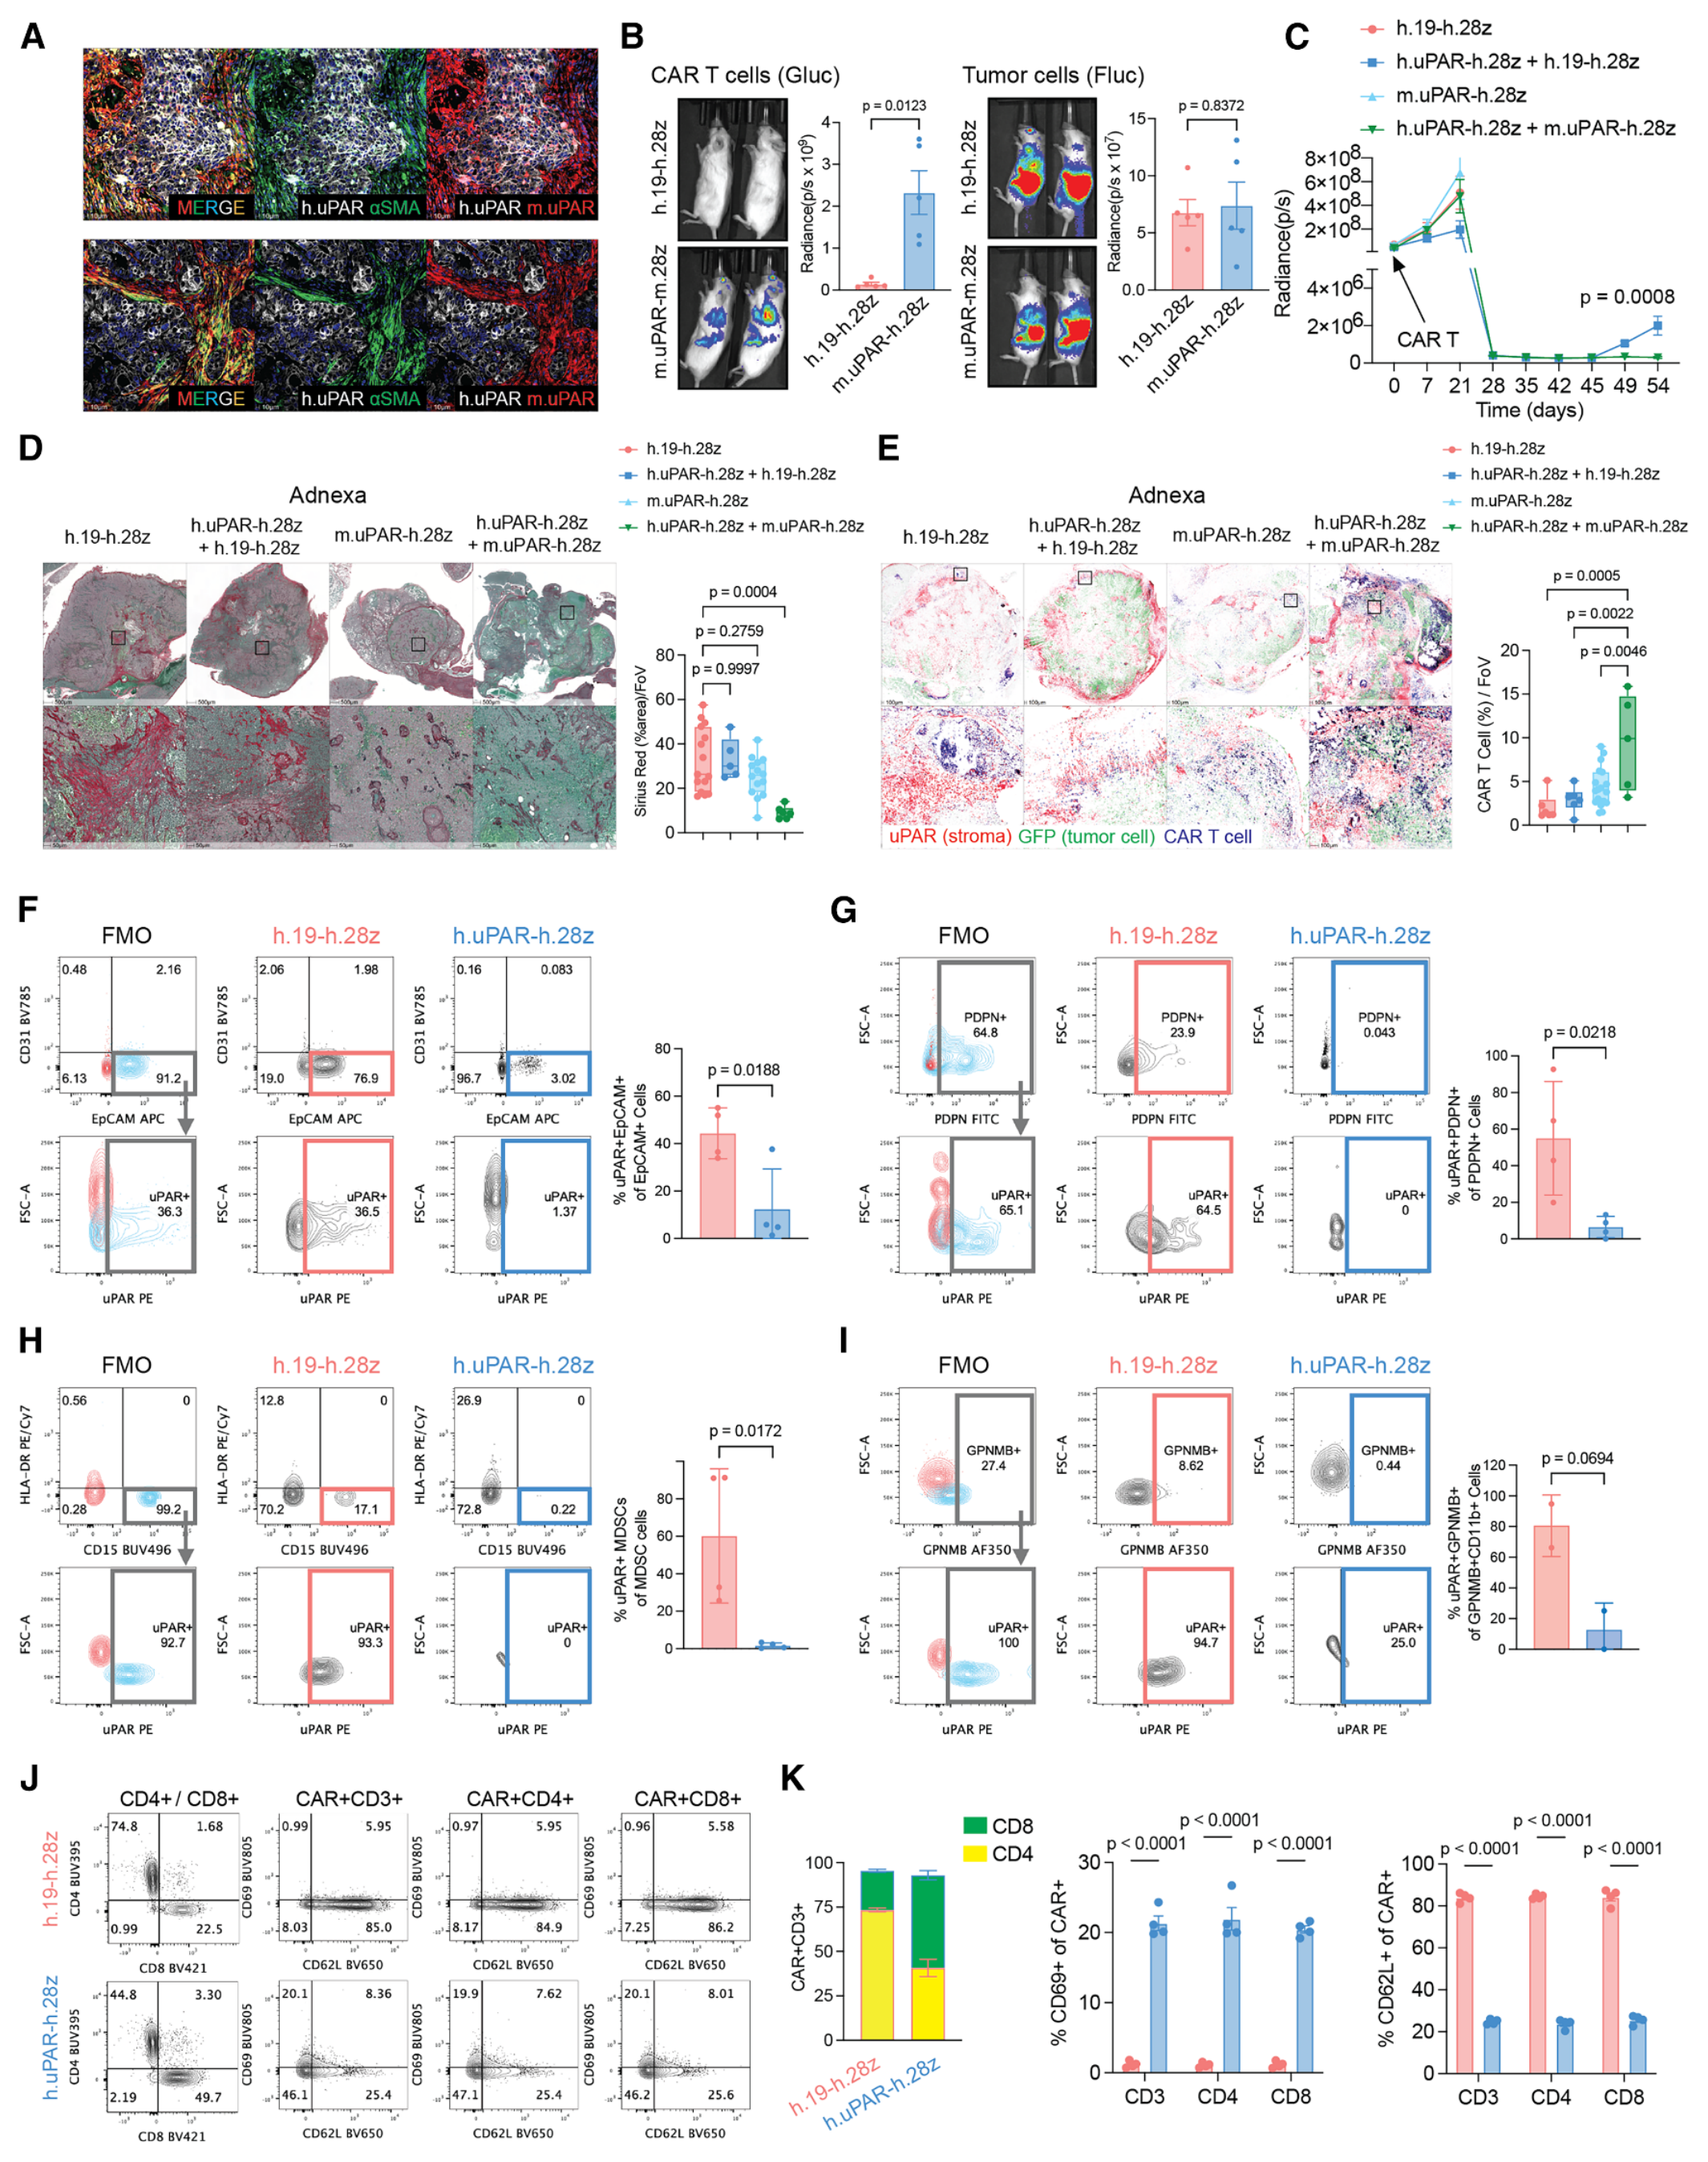
图5 · 肿瘤与基质的联合靶向 · 图片PDF第11页,图注第11–12页。
这些结果支持基质靶向对模型中的疗效有贡献。
结直肠癌证据及复发问题
结直肠癌证据包括患者组织表达、LoVo细胞系模型、患者来源类器官及其移植模型。补图S5显示这些模型存在杀伤或肿瘤控制;原代CRC成纤维细胞实验仅来自2例患者,部分比较未达到统计学显著。(图1、补图S5、S9)
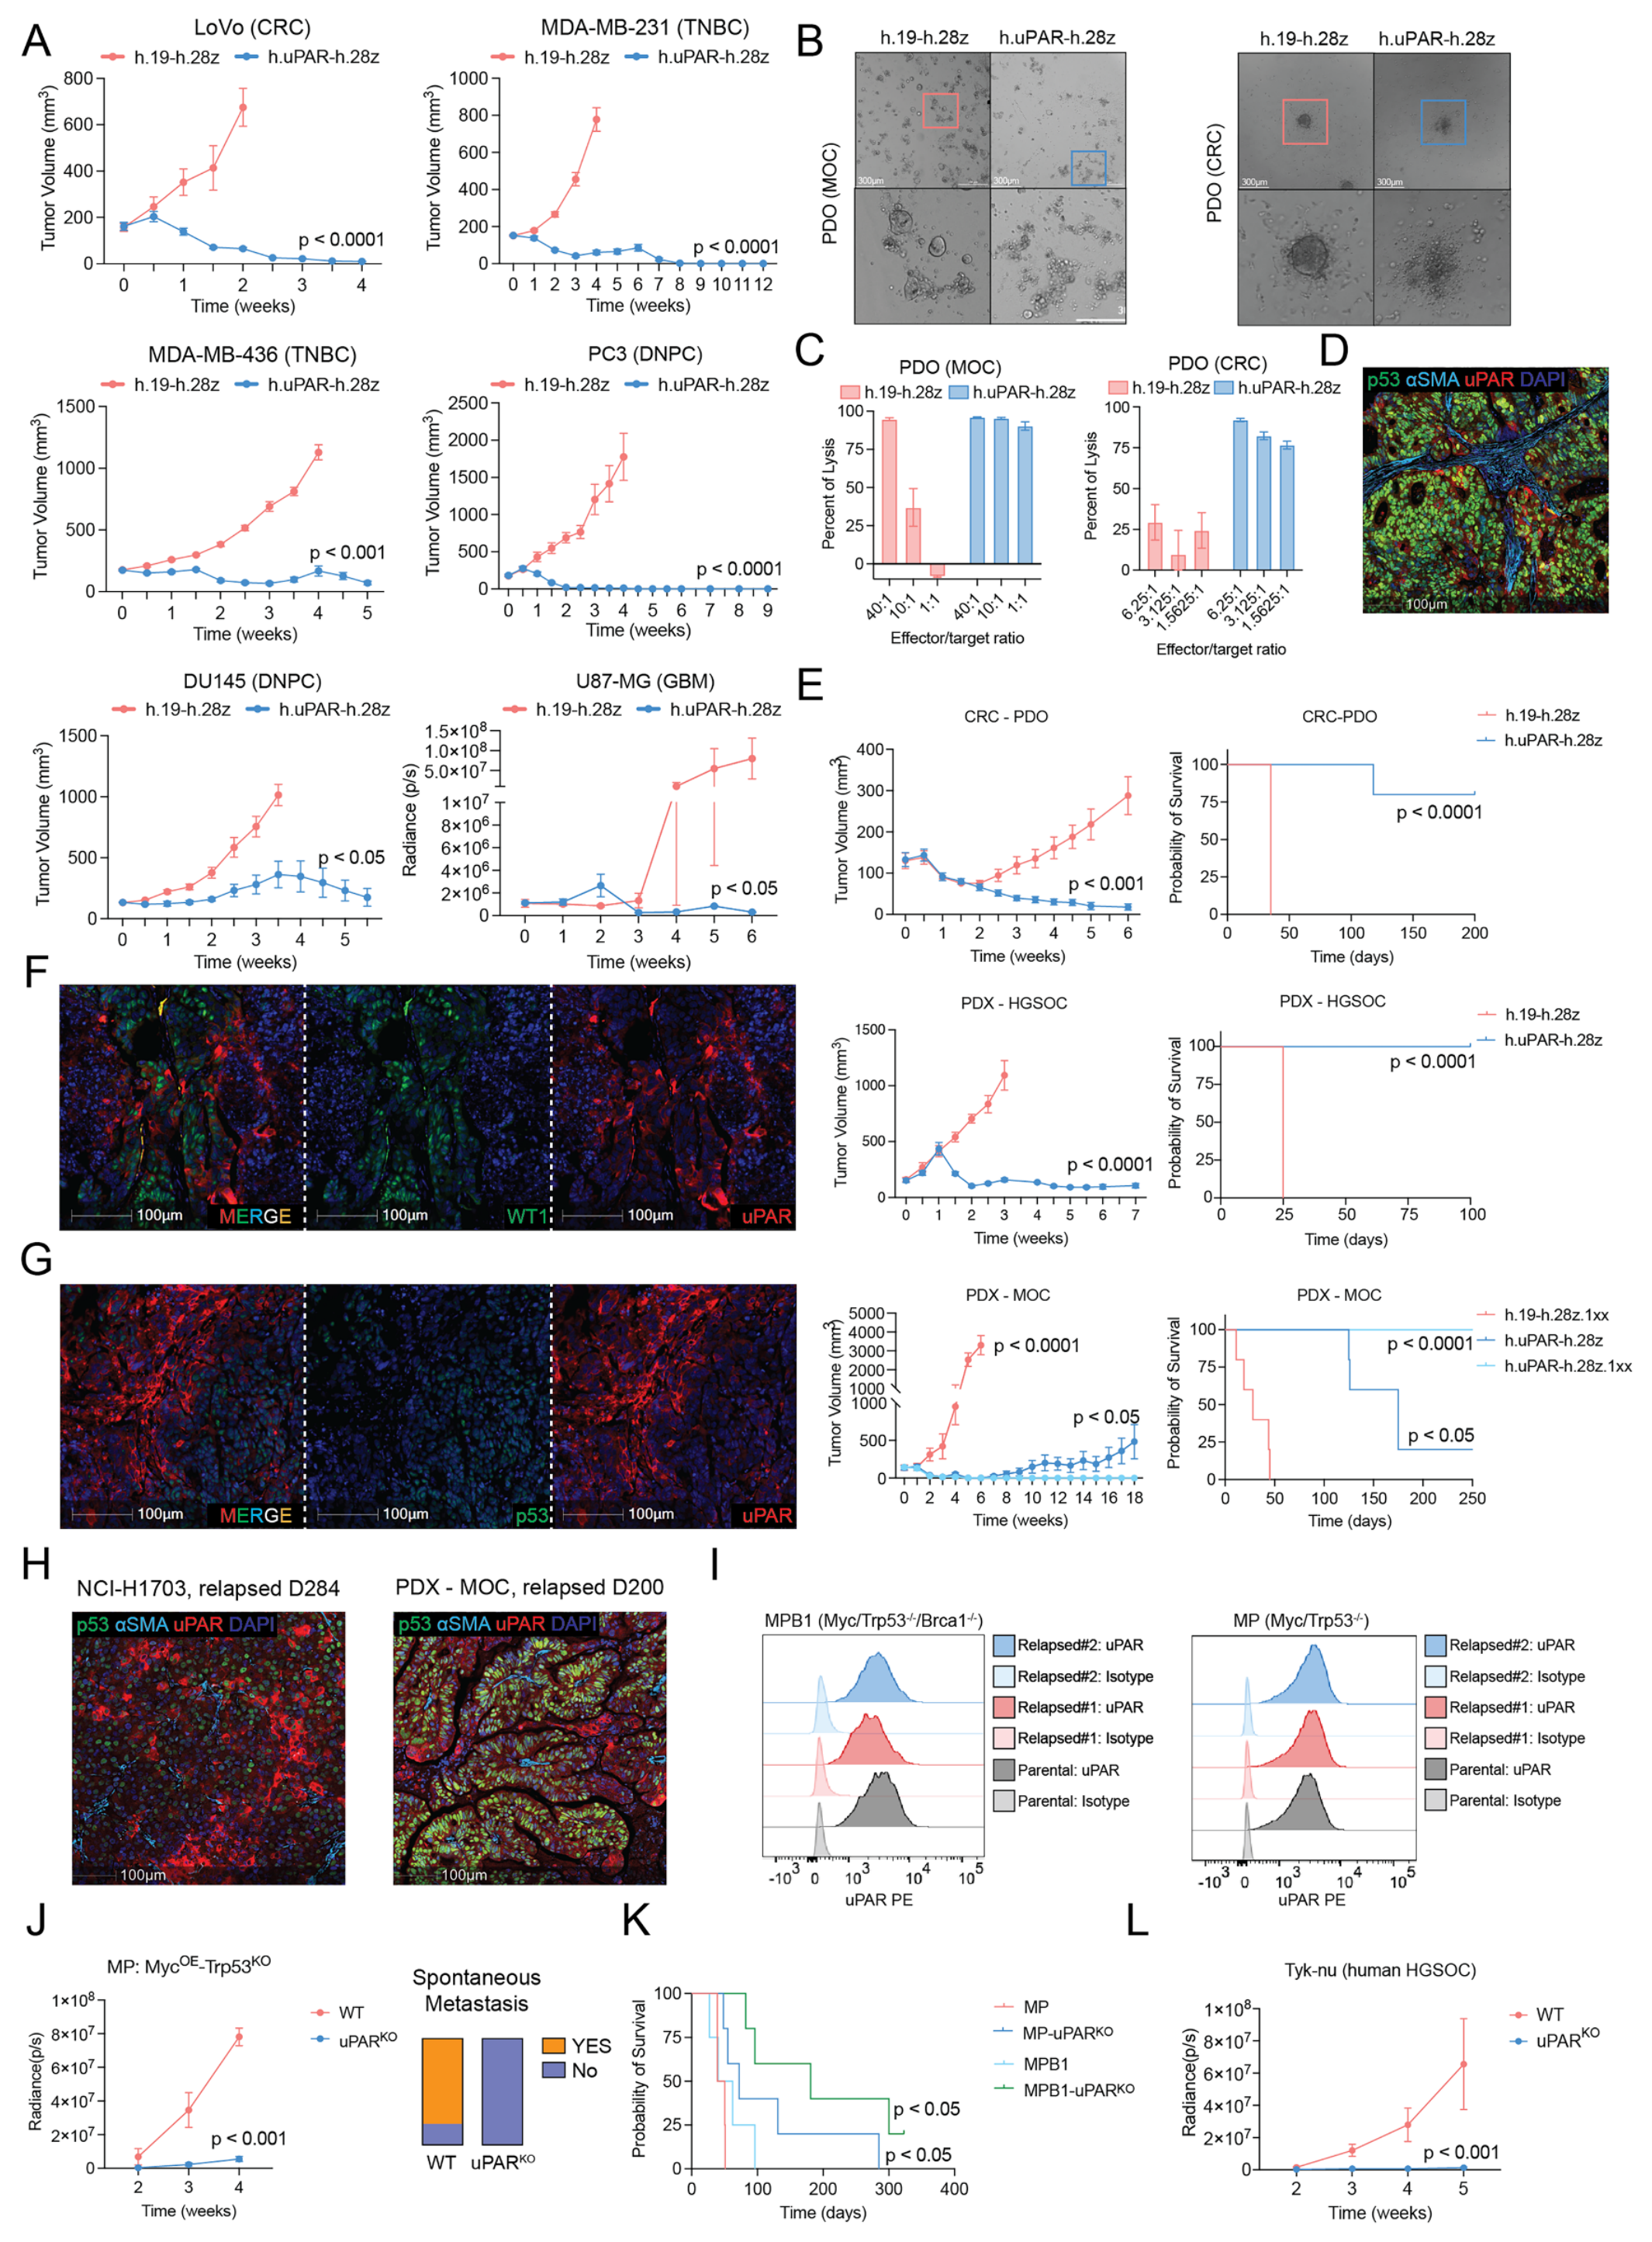
补图S5 · 扩展癌种模型、类器官与复发 · 图片PDF第49页,图注第49–50页。
部分复发肿瘤仍维持uPAR表达。1XX构型在黏液性卵巢癌PDX中带来更持久的控制,提示CAR T持续性和功能状态值得研究。(PDF第7页、补图S5G–I)
血液毒性的观察范围
在免疫完整的自发卵巢癌模型中,鼠uPAR CAR T降低肿瘤负荷、延长生存,出现短暂体重下降;图6F在治疗后第40天未见明显血细胞减少。(PDF第12–14页)
人源化小鼠使用来自2位供者的匹配造血干/祖细胞和T细胞,并以表达CD19的人肿瘤使CD19 CAR成为具有抗肿瘤活性的阳性对照。两类CAR均控制肿瘤,但CD19 CAR消耗B细胞;uPAR CAR在治疗后第7天的骨髓检查中,以鼠CD45⁺细胞为参照的髓系细胞计数未显著下降。该观察采用治疗后第7天的归一化骨髓计数。(图6G–K、PDF第13–14、31–32页)
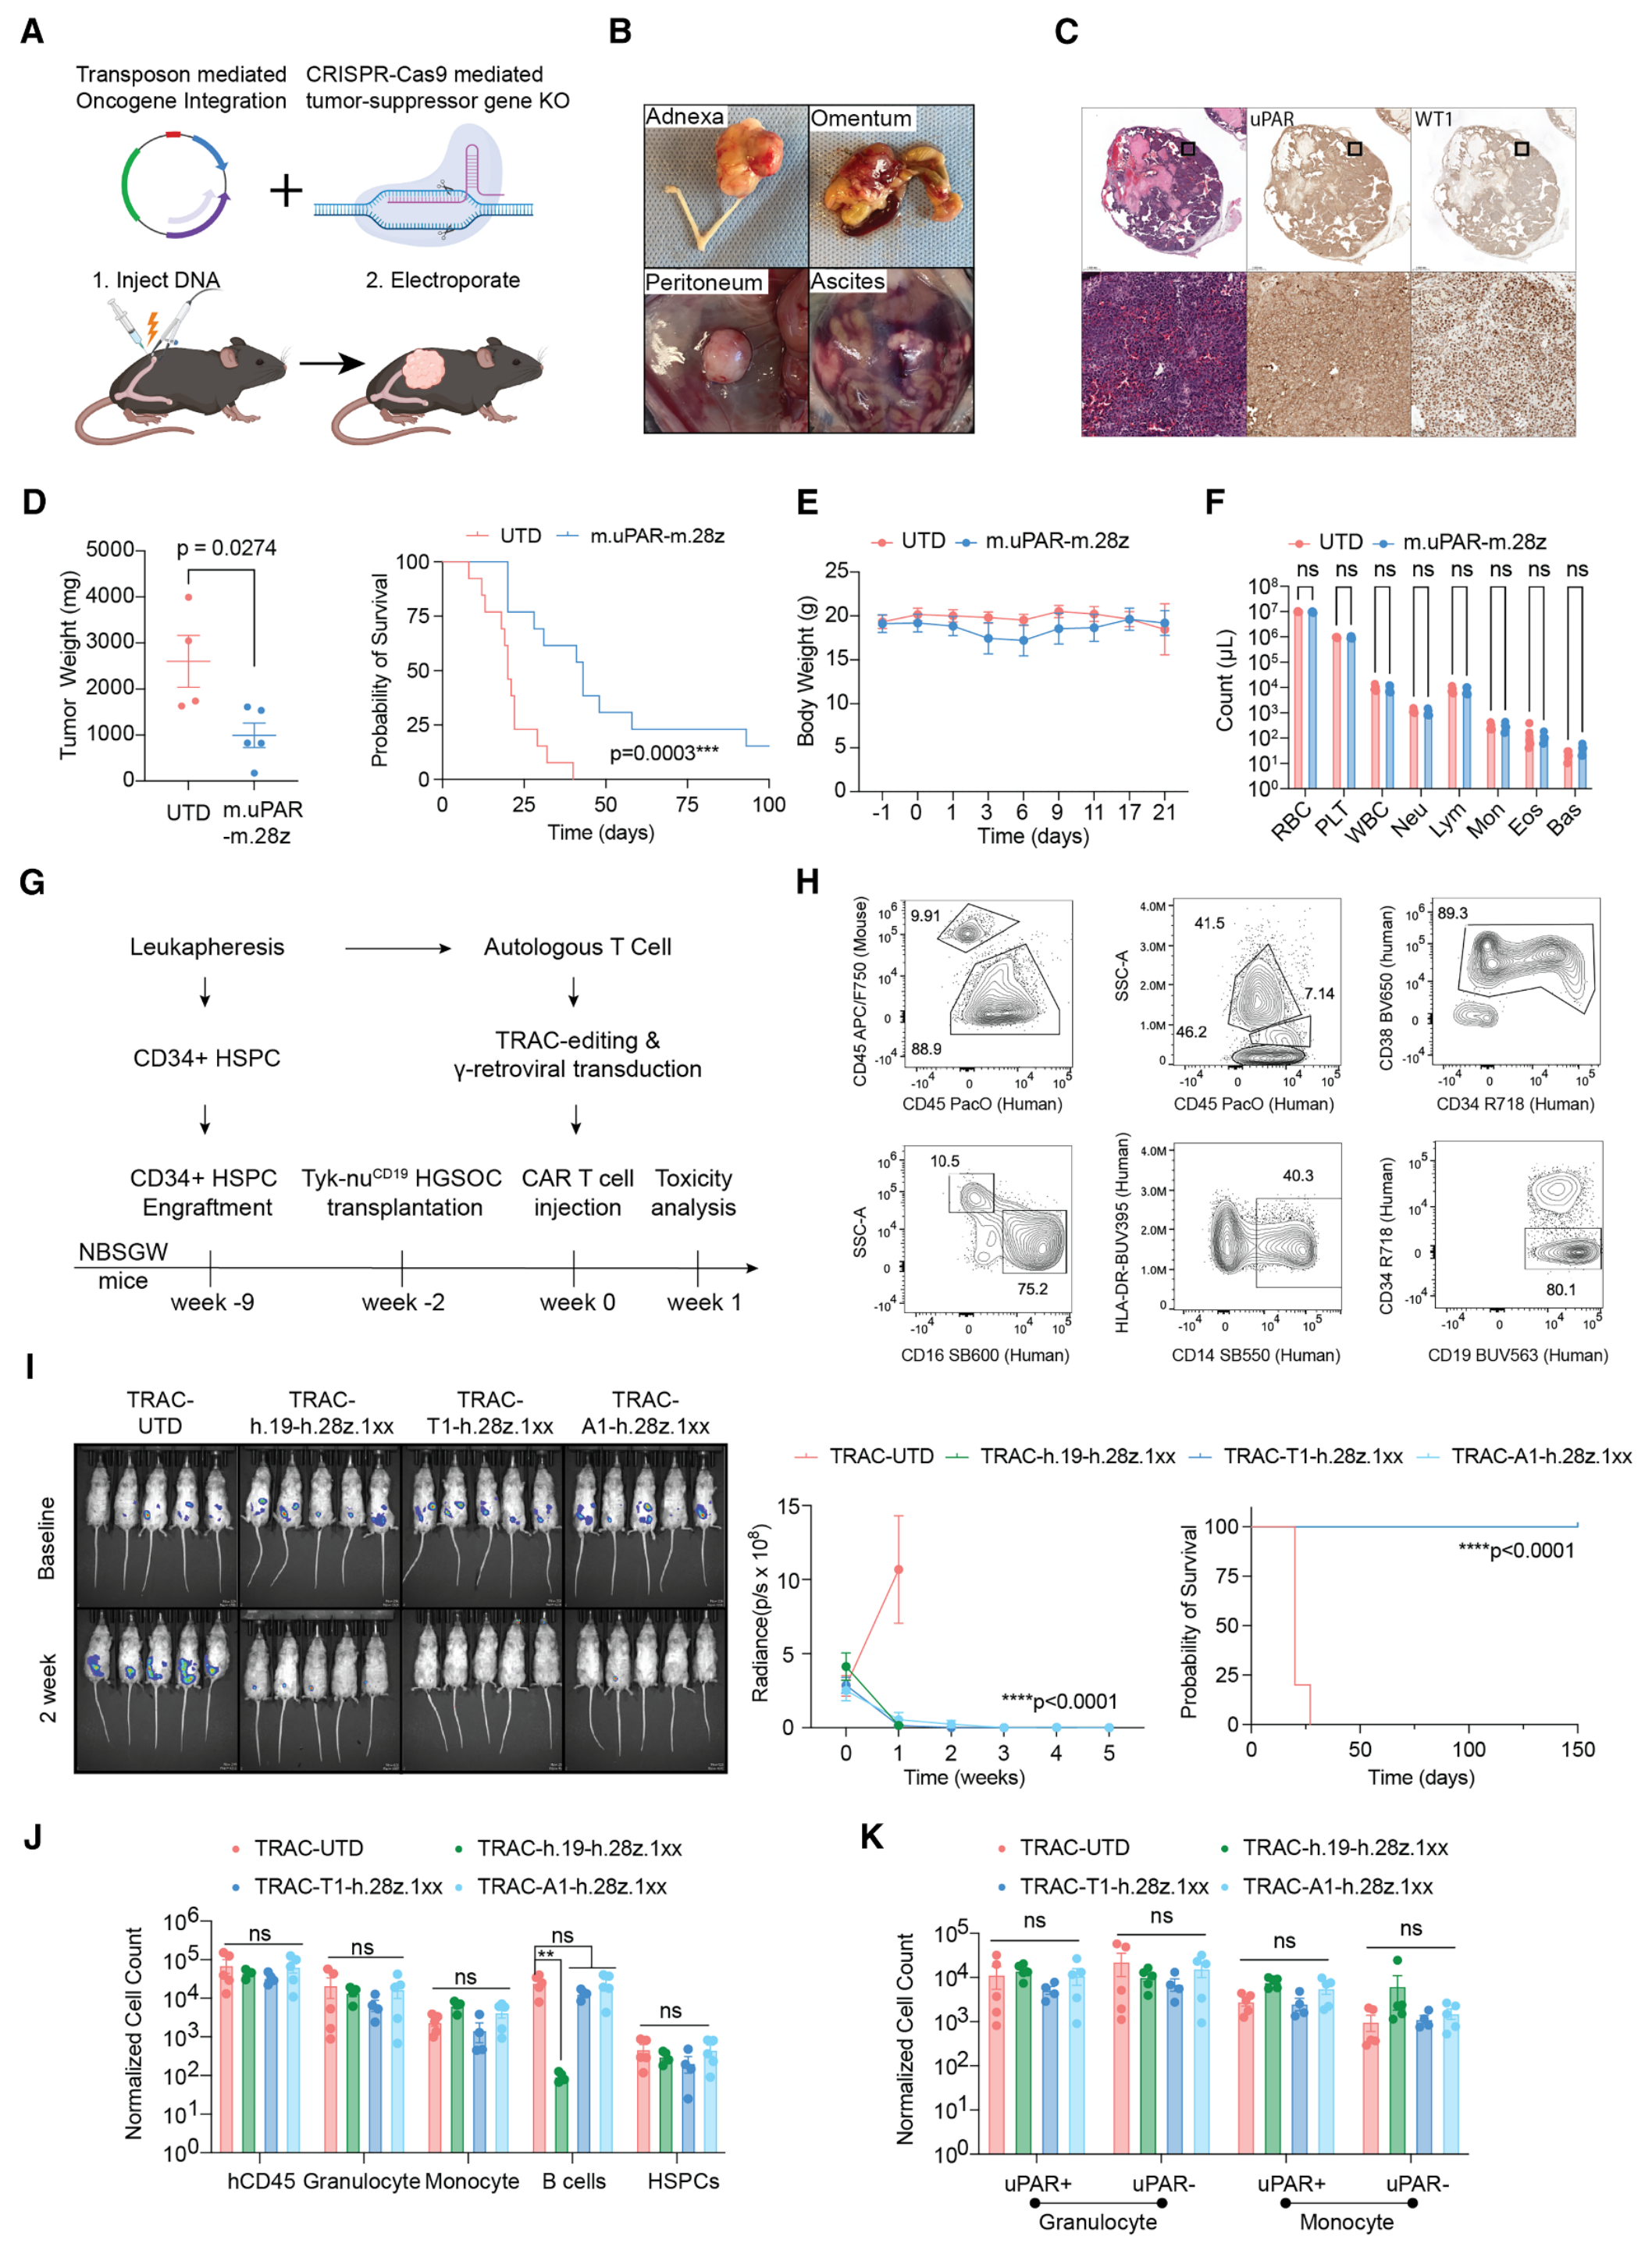
图6 · 同系及人源化小鼠的疗效和血液学观察 · 图片PDF第13页,图注第13–14页。
离体培养中,正常人uPAR阳性单核细胞确实可被杀伤。低uPAR的前体细胞补充成熟细胞,是解释体内髓系维持的一种可能机制,本文尚未直接证明完整的再生过程。(PDF第14、17页、补图S11K–M)
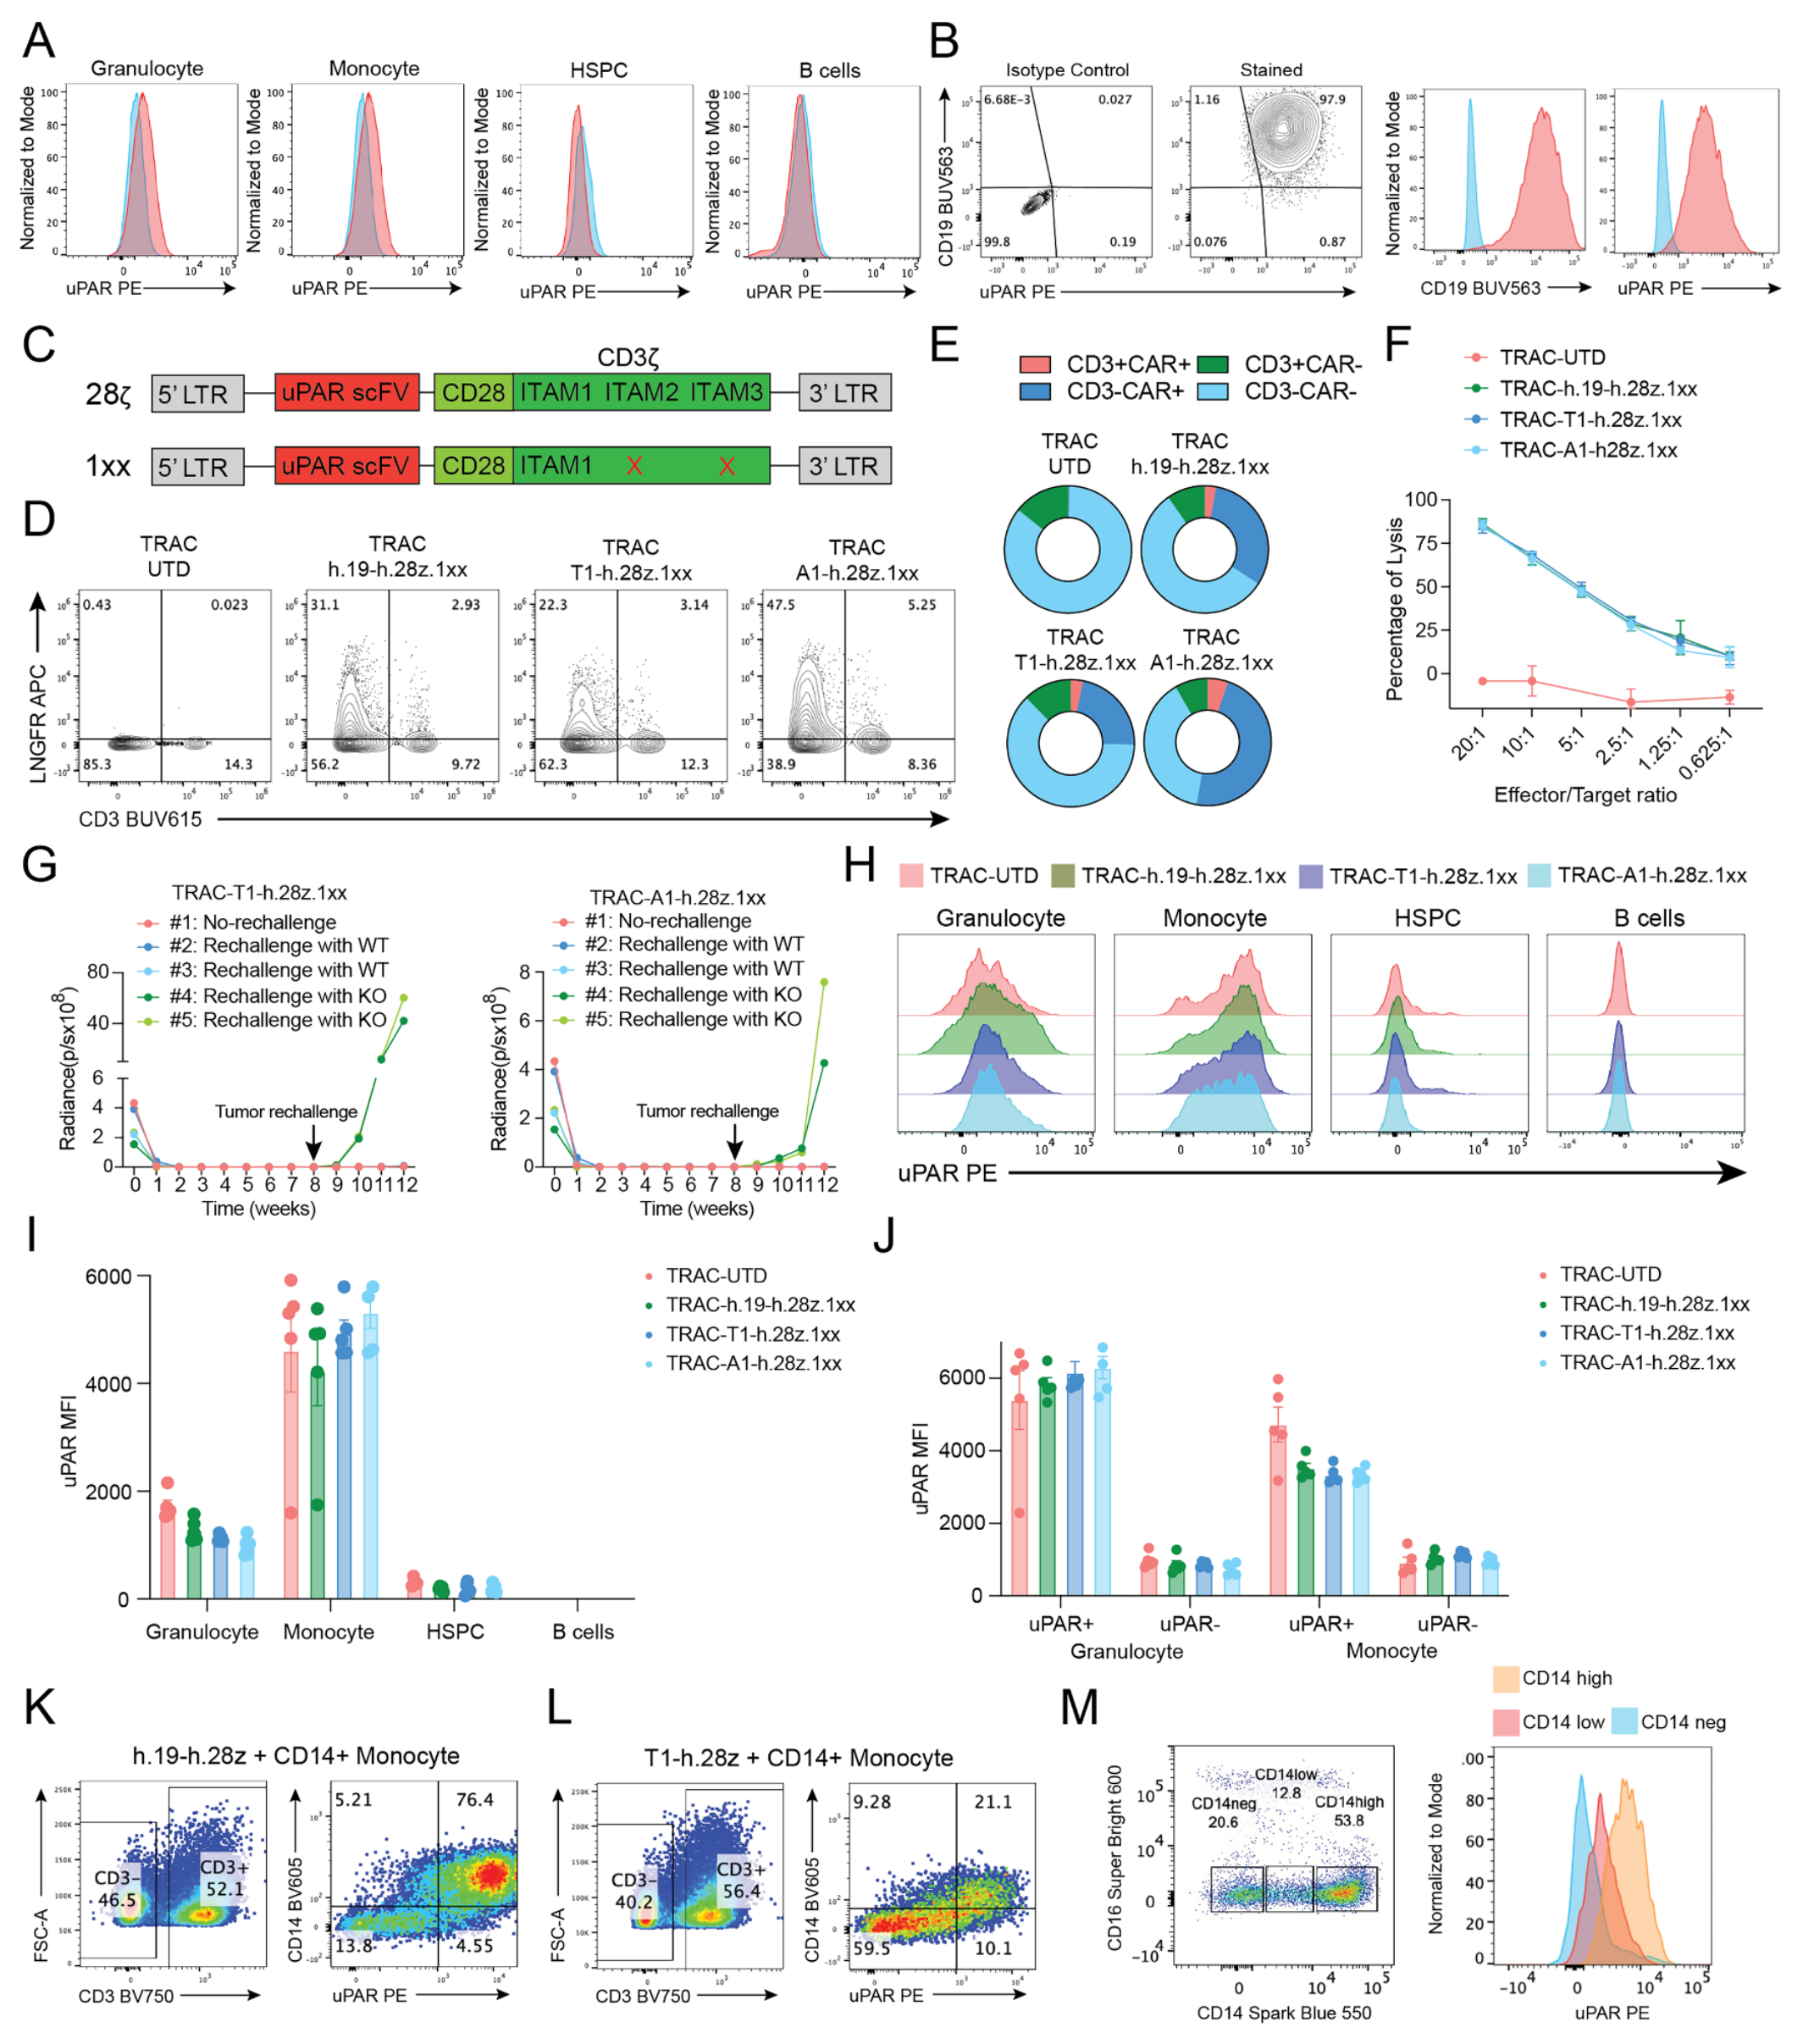
补图S11 · 人源化模型与正常单核细胞的补充证据 · 图片PDF第60页,图注第60–61页。
与诱导衰老样状态的治疗联合
治疗后患者标本及细胞模型中,部分肿瘤出现PLAUR/uPAR增加,并伴随增殖下降、衰老和损伤相关程序上升。治疗前后人群比较中存在配对与非配对两类数据。(图7A–D、补图S12)
在MPB1卵巢癌小鼠模型中,顺铂增加uPAR表达,并提高后续CAR T的杀伤和浸润。联合组获得更长的肿瘤控制,作者报告80%的小鼠无瘤超过300天;顺铂单药组则在第55天前达到生存终点。这一长期结果属于该小鼠模型。肺癌模型的补充实验支持联合降低肿瘤负荷。(PDF第14–16页、图7K、补图S12L)
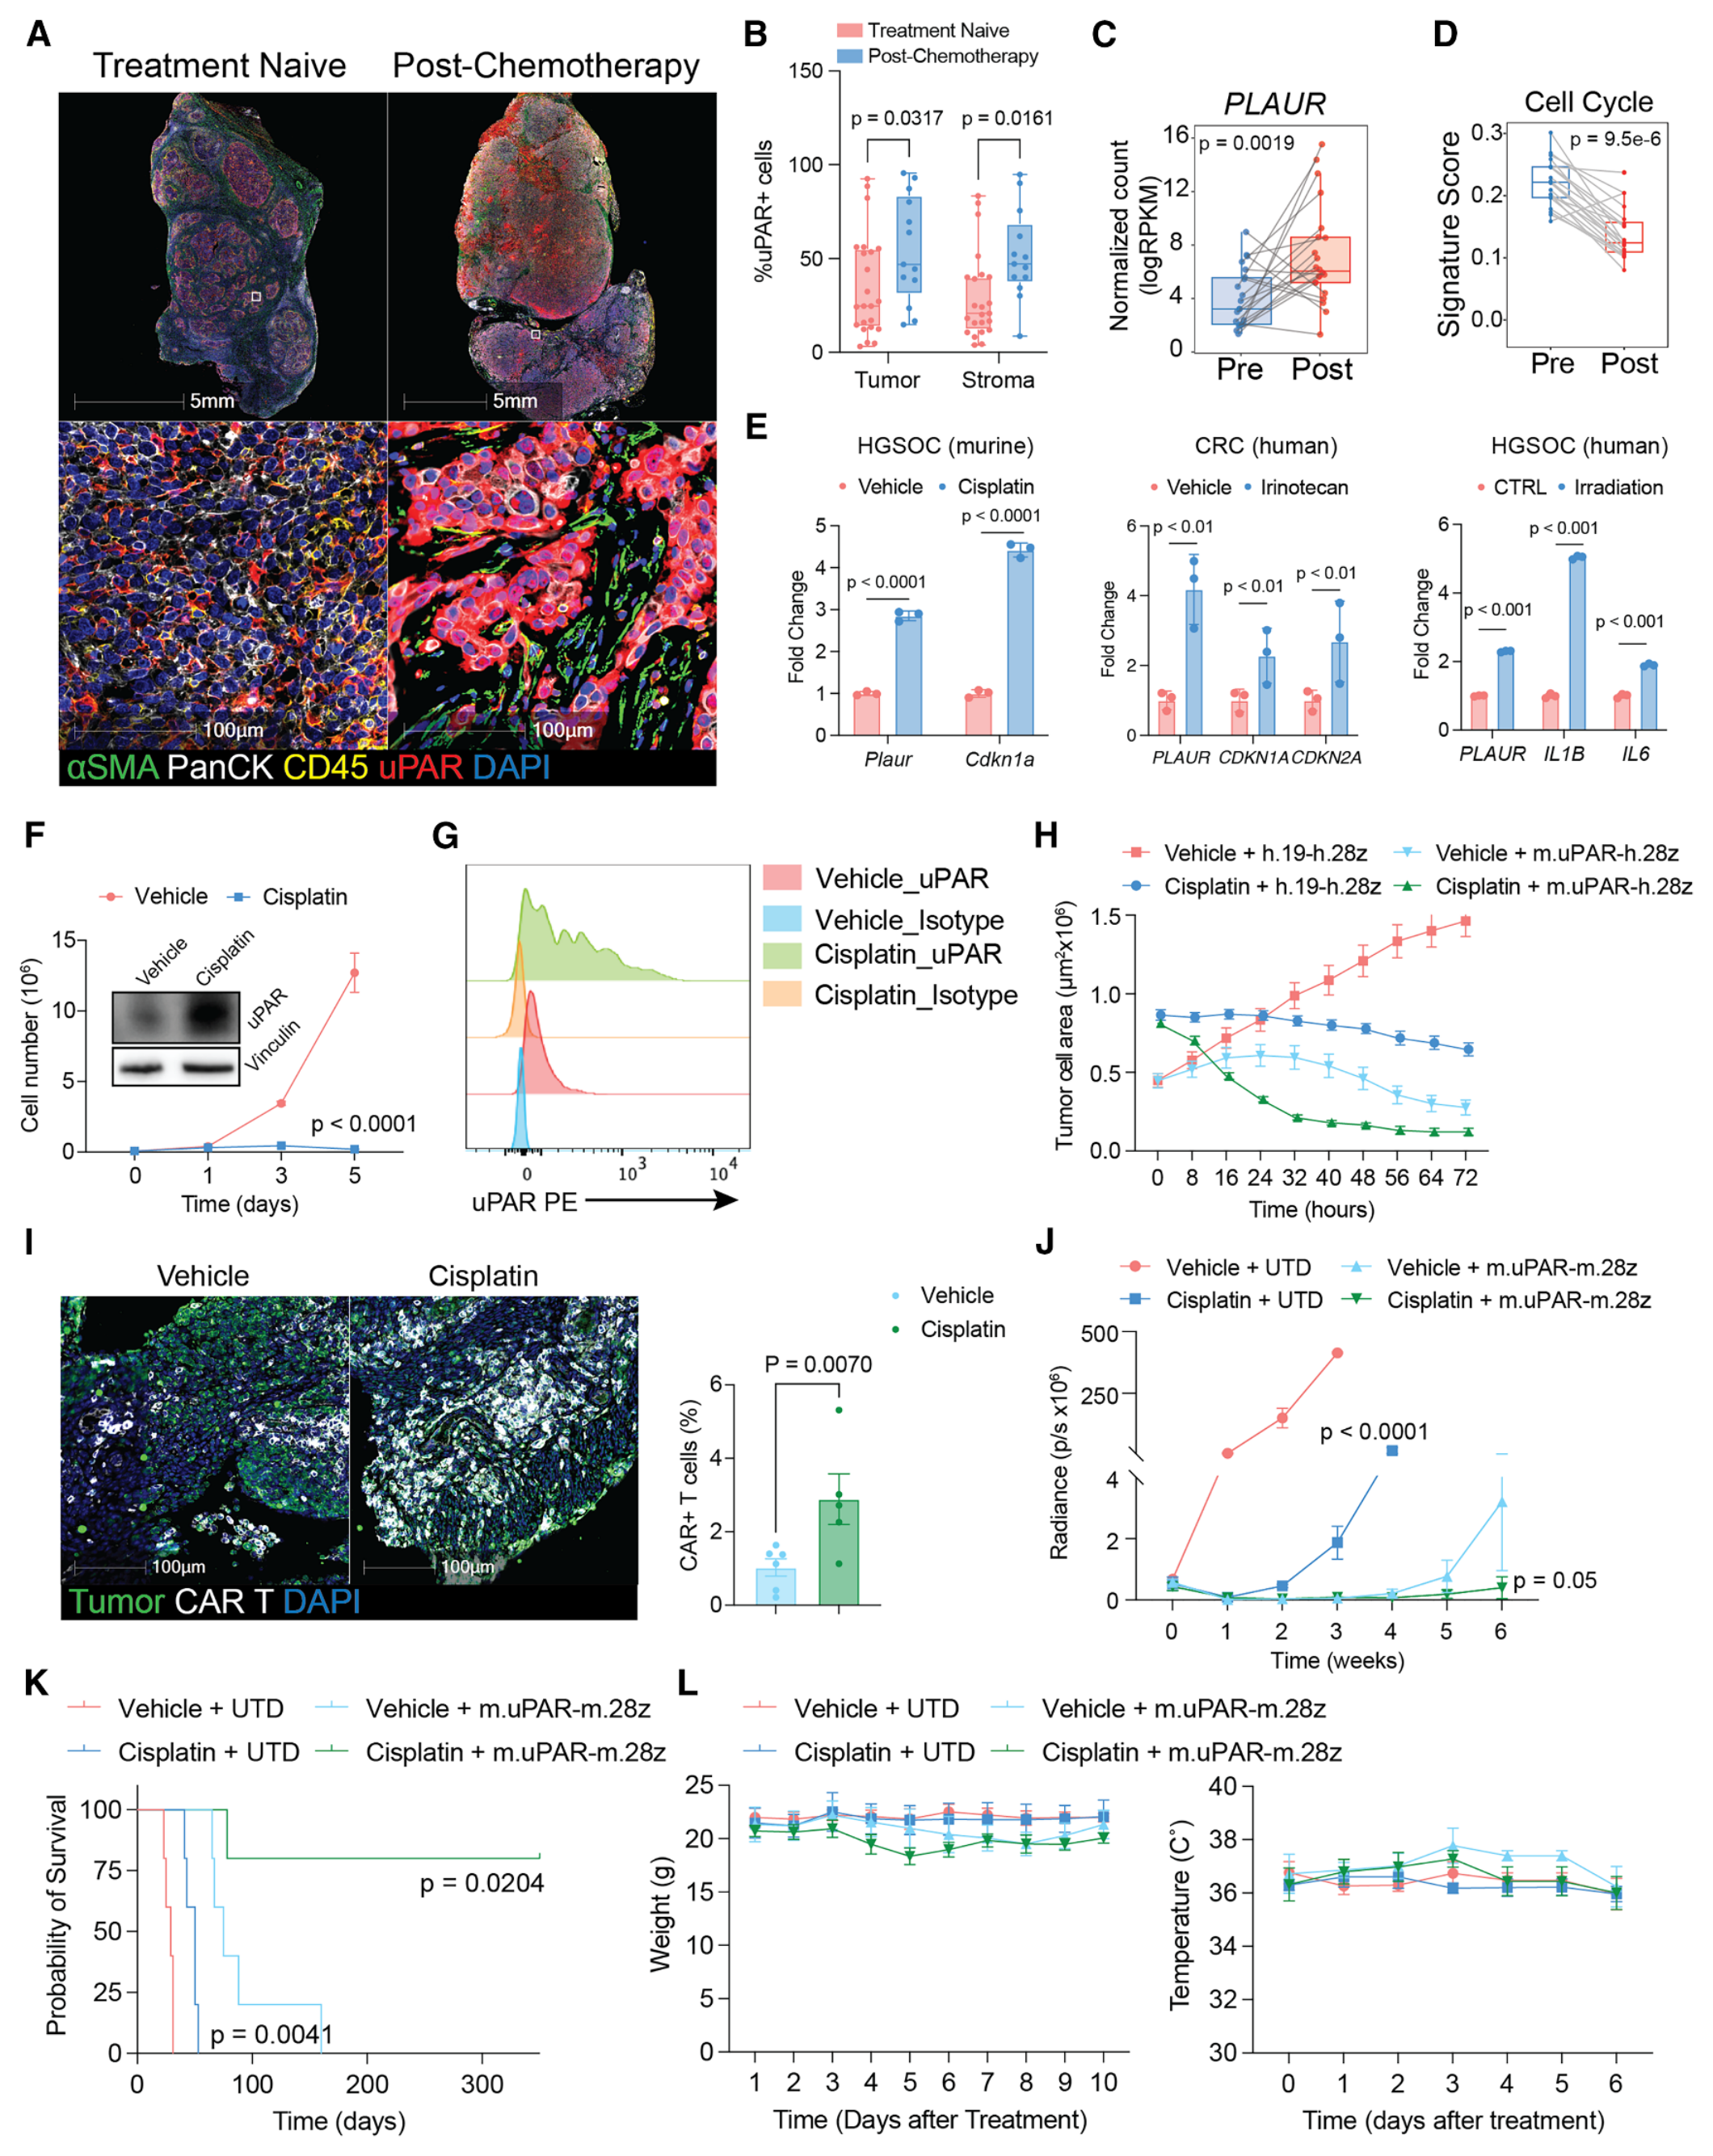
图7 · 治疗相关uPAR上调与联合治疗 · 图片PDF第15页,图注第15–16页。
结果支持通过诱导损伤或衰老样状态增强靶向,但并未完全分离“抗原密度增加”“敏感细胞被富集”和其他微环境变化的贡献。联合组展示了短期体重和体温观察;补图S12J的血液学比较仅有未转导T细胞(UTD)与uPAR CAR T两组,该部分评价uPAR CAR T与UTD比较的血液学指标。(图7L、补图S12J–K;PDF第15–16、62–63页)
局限与待解问题
跨癌种表达调查、空间共定位和衰老相关签名主要提供关联证据。TP53/RAS状态与细胞表面抗原量、不可逆衰老和免疫抑制功能之间的关系仍需分别验证;约1,500分子/细胞的实验阈值受检测方法与CAR构型影响,临床分层标准尚待建立(图1–3;PDF第17页)。
疗效模型对晚期人实体瘤的纤维化结构和免疫网络覆盖有限,CRC原代CAF及其他离体样本量也较小。图5D–E的器官标注与图注存在差异;复发中的抗原保留、CAR T持续性和其他微环境作用需要进一步拆分(图5;补图S5、S9)。
正常人单核细胞的离体杀伤提示需继续评价正常组织靶向风险。人源化骨髓结果限于短期,顺铂联合部分主要记录短期体重和体温,补图S12J未包含联合组。延迟及器官毒性、长期造血补充和人体疗效仍待临床验证;诱导衰老样状态后,抗原密度、细胞选择和微环境改变的贡献也未完全分离(图6–7;补图S11–S12)。
相关研究
Amor等,Nature(2020)是uPAR作为衰老细胞CAR T靶点的早期研究;本次核查限题录、摘要及更正入口。
Reyes等,Cell(2026)研究胰腺癌发生过程中祖细胞样状态与支持性邻域的形成,为本文提出的p53约束模型提供机制背景。本次仅核查题录与公开摘要线索,尚未独立精读这篇相关论文。
主图与表格 · 9 张
Figure 1 · PDF 第 4 页
Figure 1. uPAR marks a distinct cell state enriched in TP53 mutations and EMT programs (A) Multiplex immunofluorescence (multi-IF) across human tumor samples. Left: representative cores stained for uPAR, tumor cells (PanCK, p53, or MSLN), fibroblasts (αSMA), immune cells (CD45), and nuclei (DAPI). Right: donut plots showing the fraction of samples per tumor type stratified by the percentage of uPAR+ tumor cells: high (>50%), intermediate (30%–50%), low (5%–30%), and negative (<5%), and n indicates the number of patients analyzed per tumor type or number of tumors for OV and BLCA (patient information in Table S1A). (B–D) The Cancer Genome Atlas (TCGA) analysis (n = 10,071) showing (B) PLAUR expression stratified by mutation status across 456 cancer-relevant genes (MSK-IMPACT)31; (C) pathway enrichment in PLAUR-high (>66th percentile) versus PLAUR-low (<33rd percentile) tumors; and (D) correlation of uPAR activity with the indicated transcriptional signatures across cancer types (each dot represents one cancer type). (E) scRNA-seq analysis of epithelial tumor cells from liver (n = 79), lung (n = 9), ovarian (n = 41), and pancreatic (n = 16) cancers comparing PLAUR-high (>66th percentile) and PLAUR-low (<33rd percentile) for the indicated signatures.BLCA, bladder urothelial carcinoma; BRAIN, brain tumor (multiple subtypes); BRCA, breast invasive carcinoma; CCA, cholangiocarcinoma; CRC, colorectal cancer; MESO, mesothelioma; NSCLC, non-small-cell lung cancer; OV, ovarian cancer; PDAC, pancreatic ductal adenocarcinoma; PRAD, prostate adenocarcinoma; SARC, sarcoma. Statistics: Wilcoxon test (B and E), permutation test (C), and Pearson correlation test (D). Scale bars, 100 or 250 μm. See also Figure S1.
Figure 2 · PDF 第 5 页
Figure 2. uPAR+ tumor, CAF, and myeloid cells define a fibrotic, immunosuppressive niche (A and B) Spatial transcriptomics (10× xenium) of a treatment-naive human PDAC specimen showing the cell-type map (A) and H&E staining from an adjacent section with xenium feature plots of PLAUR expression, PLAUR+ cells, and senescence signature scores (B). Full sections are shown in Data S1.3E. (C) Multi-IF-based spatial map from an adjacent section showing enrichment of uPAR+ PDAC cells near uPAR+/p16+ stromal cells. Cell types: tumor cells (PanCK+), fibroblasts (α SMA+), monocytes/macrophages (Mo/Mac and CD68+), and basal PDAC cells (KRT17+PanCK+). Full sections are shown in Data S1.3H. (D) Senescence scores in PLAUR+ versus PLAUR− Mo/Mac and CAF populations identified in (A). (E) Spatial co-localization heatmap for selected cell populations (complete heatmap in Figure S2E). (F) Frequency of neighboring cell types around basal versus classical PDAC neighborhoods. (G and H) Hyperplex 24-plex IF images from PDAC tumors (n = 101 cases and 649,581 cells analyzed) (G) and Spearman correlation analysis among cell populations (quantification in Data S1.4A) (H). Statistics: Wilcoxon test (D) and Spearman correlation (H) (p values shown in Figure S2H). Scale bar, 100 μm. See also Figures S2 and S3.
Figure 3 · PDF 第 8 页
Figure 3. uPAR CAR T cells exhibit potent antitumor activity across multiple cancer models (A) Schematic of uPAR proteolytic cleavage and release of soluble uPAR (suPAR). Created with BioRender.com. (B) Quantification of uPAR surface density across 71 human cancer cell lines by flow cytometry. Non-cancer cells are indicated in green, uPAR-KO (uPARKO) in blue, and cell lines exhibiting durable in vivo tumor regression in red (see D and E). (C) Multi-IF staining for uPAR in subcutaneous xenografts of lung adenocarcinoma (LUAD), lung squamous cell carcinoma (LUSC), high-grade serous ovarian carcinoma (HGSOC), and pancreatic ductal adenocarcinoma (PDAC). (D–F) Antitumor efficacy of uPAR CAR T cells expressing the uPAR-binding scFv (T1-h.28z) versus a CD19 control CAR (h.19-h.28z), administered intravenously (2 × 10⁶ cells per mouse): (D) tumor volume, (E) overall survival, and (F) CAR T cell infiltration assessed by anti-CD3 multi-IF staining 7 days after treatment. Statistics: multiple t test (D) and log-rank test (E). Error bars indicate SEM. Scale bar, 100 μm. See also Figures S4 and S5.
Figure 4 · PDF 第 9 页
Figure 4. Efficacy of uPAR CAR T cells in ovarian cancer xenografts (A) Representative multi-IF images from the MSK SPECTRUM HGSOC cohort. (B) Orthotopic ovarian cancer model (Tyk-nuluc) treated with control CD19 CAR T cells (h.19-h.28z; 2 × 10⁶) or uPAR CAR T cells (T1-h.28z or A1-h.28z; 2 × 10⁶). Tumor burden was monitored by bioluminescence (images, left; quantification, middle) and overall survival (Kaplan-Meier, right). (C) Multi-IF of a human HGSOC specimen showing uPAR-expressing tumor cells (left) and higher magnification views highlighting uPAR+ tumor cells within detached tumor-cell clusters (right). (D) Spontaneous metastasis model using orthotopic Tyk-nuluc xenografts. Left: in vivo imaging following oophorectomy and ex vivo bioluminescence of met astatic dissemination (see schematic in Figure S7E). Right: metastatic tumor burden (middle) and Kaplan-Meier survival analysis (right) after treatment with control or uPAR CAR T cells. (E) Immunohistochemistry for GFP and quantification of tumor burden in the adnexa (left) and metastatic lesions in the lung (middle) and liver (right). (F) Longitudinal 89Zr-labeled uPAR PET imaging of primary (orthotopic; left) and metastatic (intraperitoneal; right) Tyk-nu tumors. Schematic created with BioRender.com. (G) Longitudinal 64Cu-labeled uPAR PET imaging of Tyk-nu tumors following treatment with control or uPAR CAR T cells at the indicated time points. Schematic created with BioRender.com. Statistics: multiple t test (B, middle; D, middle), Student’s t test (E), and log-rank test (B, right; D, right). Error bars indicate SEM (B and D) or SD (E). See also Figures S6 and S7.
Figure 5 · PDF 第 11 页
Figure 5. uPAR CAR T cells target both tumor cells and their fibrotic stroma (A) Multi-IF images of orthotopic Tyk-nu (top) and COV644 (bottom) xenograft tumors showing human uPAR+ tumor cells and αSMA+ fibrotic murine stroma (left panel; scale bar, 50 μm) and murine uPAR+ stromal cells, including fibroblasts (αSMA+, right panel; scale bar, 10 μm). (B) In vivo bioluminescence imaging of Gaussia-luciferase (Gluc)-labeled CAR T cells expressing a murine uPAR-targeting CAR (m.uPAR-h.28z) or control CD19 CAR (h.19-h.28z) in mice bearing orthotopic Tyk-nuluc tumors expressing firefly luciferase (Fluc). Mice were imaged using a Gluc substrate (stromal targeting) or a Fluc substrate (tumor burden) 24 h after intravenous CAR T cell infusion and 4 weeks after tumor implantation, and radiance quantification is shown (n = 5 mice). (C) Fluc tumor burden in mice bearing orthotopic Tyk-nuluc tumors treated with h.19-h.28z, h.uPAR-h.28z, m.uPAR-h.28z, or combinations, and CAR T cell infusion timing is indicated (n = 5 mice) (D) Sirius red staining of lung metastasis sections from Tyk-nuluc-bearing mice treated with the indicated CAR T cells, with quantification of fibrosis area per field of view (FoV) using Fiji (see STAR Methods) (n = 5 mice). Scale bars, 1 mm (top) and 50 μm (bottom). (E) Multi-IF of Tyk-nu lung metastases showing m.uPAR+ stromal cells (red), GFP+ tumor cells (green), and CD3+ CAR T cells (blue) after treatment. Pseudocolor images and quantification of CAR T cell infiltration per FoV (n = 5 mice). Scale bars, 10 μm. (F–I) Flow cytometry of dissociated human HGSOC tumors after 16 h co-culture with the indicated CAR T cells (representative gating and quantification; n = 4 patients): (F) EpCAM+ tumor cells and the fraction of uPAR+EpCAM+ cells within EpCAM+ cells; (G) PDPN+ CAFs and the fraction of uPAR+PDPN+ cells within PDPN+ cells. Parental gate: live+CD45-CD31-EpCAM−; (H) MDSCs (CD45+Lin−CD11b+CD14−HLA−DR−CD15+; Lin− excludes CD3/CD19/CD56) and the fraction of uPAR+MDSCs; (I) GPNMB+CD11b+ myeloid cells (CD45+Lin−CD11b+GPNMB+; Lin− excludes CD3/CD19/CD56) and the fraction of uP AR+GPNMB+ cells within GPNMB+CD11b+ myeloid cells. (J and K) Flow cytometry analysis of CAR T cells following co-culture with primary HGSOC CAFs (n = 4). (J) Representative flow cytometry plots showing the percentages of CD4+ and CD8+ CAR T cells, as well as CD69+/CD62L+ cells within the CD4+ or CD8+ CAR T populations. (K) Quantification of the data shown in (J). CAR expression was assessed by LNGFR staining. In all flow cytometry plots, positive gates were defined using fluorescence minus one (FMO) controls. Statistics: Student’s t test (B and F–I), multiple t tests (C), and one-way ANOVA (D, E, and K). Error bars indicate SEM (C) or SD (F–K). See also Figures S8 and S9.
Figure 6 · PDF 第 13 页
Figure 6. uPAR CAR T cells exhibit a favorable safety profile (A) Schematic of the electroporation-based genetically engineered mouse model (EPO-GEMM) enabling transposon-mediated oncogene integration (MYC) and CRISPR-Cas9-mediated tumor suppressor KO (Trp53 and Brca1) in the ovary/fallopian tube to generate autochthonous ovarian tumors. Created with BioRender.com. (B) Representative images of established MYCOE; Trp53KO EPO-GEMM tumors, and spontaneous metastases. (C) Representative H&E and immunohistochemistry staining for uPAR and WT1 in MYCOE; Trp53KO (MP) tumors. (D–F) Mice bearing autochthonous MP tumors were treated with 2 × 10⁶ control untransduced T cells (UTD) or murine uPAR CAR T cells (m.uPAR-m.28z): (D) tumor weight at 2 weeks post-treatment (left) and overall survival (right), (E) body weight over time post treatment, and (F) complete blood counts (at day 40 post treatment). (G) Schematic for testing CAR T cells in mice with a humanized immune system (see STAR Methods). (H) Flow cytometry of bone marrow from humanized mice 6 weeks after HSPC transplantation and prior to tumor implantation (see STAR Methods). (I) Effects of the indicated TRAC-edited CAR T cells in humanized mice bearing Tyk-nuCD19 xenografts: bioluminescence images (left), radiance quantification of tumor (middle), and overall survival (right). (J) Flow cytometry showing relative abundance of human immune cell populations in bone marrow at tumor remission (day 7 post CAR T treatment) normalized to mouse CD45+ cells. (K) uPAR expression in human granulocytes (CD16+SSAhigh) and monocytes (CD14+) was assessed by flow cytometry using a human-specific uPAR antibody (gated as hCD45+CD19−CD3−). TRAC denotes TRAC-locus-edited CAR T cells. 1XX denotes CARs with inactivation of immunoreceptor tyrosine-based activation motifs 2 and 3 (ITAM2/3).50 UTD, untransduced T cells. Statistics: Student’s t test (D and F), multiple t test (I, middle), log-rank test (D, right; I, right), and one-way ANOVA (J and K). Er ror bars indicate SD (D) or SEM (E and I–K). See also Figures S10 and S11.
Figure 7 · PDF 第 15 页
Figure 7. Therapy-induced senescence enhances CAR T cell efficacy (A) Representative multi-IF images of HGSOC tumors from treatment-naive (n = 23) or post-chemotherapy (n = 13) patients. (B) Quantification of uPAR+ cells among PanCK+ (tumor) or PanCK− (stromal) populations from (A) (each dot represents one tumor). (C and D) Bulk RNA-seq analysis of matched pre- and post-cisplatin-treated ovarian cancer samples61 showing PLAUR expression (C) and cell-cycle signature scores (D). (E) qPCR analysis of the indicated genes in MPB1, 136p, and OVCAR8 cells after 72 h exposure to the indicated senescence-inducing treatments in vitro. (F) Proliferation curves and immunoblotting showing uPAR upregulation in MPB1 cells 72 h after cisplatin (1 μM). (G) Flow cytometry analysis of surface uPAR expression in MPB1 cells treated with vehicle or cisplatin (1 μM) for 72 h. (H) Incucyte-based viability analysis of proliferating (vehicle) or senescent (cisplatin; 1 μM) MPB1 cells co-cultured with control (h.19-h.28z) or murine uPAR CAR T cells (m.uPAR-h.28z). (I) Multi-IF images (left) and quantification (right) of GFP+ MPB1 tumor cells (green) and m.uPAR-m.28z CAR T cells (white) 1 week after treatment of mice bearing metastatic MPB1 tumors (2 × 10⁶ CAR T cells). (J–L) Response of mice bearing MPB1luc tumors treated with cisplatin (3 mg/kg), UTD T cells, m.uPAR-m.28z CAR T cells (2 × 10⁶), or the combination. Tumor burden was monitored by bioluminescence (J), overall survival was shown by Kaplan-Meier plot (K), and body weight (L, left) and temperature (L, right) were assessed as an indicator of systemic toxicities. Statistics: two-way ANOVA (B and E), Student’s t test (C, D, F, and I), multiple t test (J), and log-rank test (K). Error bars indicate SD (B, E, F, and I) or SEM (H and J– L). See also Figure S12.
Figure S5 · PDF 第 49 页
Figure S5. In vitro and in vivo characterization of uPAR CAR T cells, related to Figure 3 (A) Tumor growth curves of human cancer xenograft models treated with control h.19-h.28z CAR T cells or h.uPAR-h.28z CAR T cells. Shown are LoVo (CRC), MDA-MB-231 (triple-negative breast cancer [TNBC]), PC3 (double-negative prostate cancer [DNPC]), MDA-MB-436 (TNBC), DU145 (DNPC), and U87-MG (GBM) xenografts. Tumor volumes were measured over the indicated time courses. (B) Bright-field images of patient-derived organoids (PDOs) from mucinous ovarian cancer (MOC, left) and colorectal cancer (CRC, right) after co-culture with h.19-h.28z or h.uPAR-h.28z CAR T cells. Boxes highlight representative regions of organoid disruption, shown at higher magnification below. Scale bars, 500 μm. (C) Quantification of PDO cell lysis from MOC and CRC organoids after co-culture with h.19-h.28z or h.uPAR-h.28z CAR T cells at the indicated effector-to-target ratios. (D) Representative IF staining of CRC tissue sections showing expression of uPAR (red), αSMA (cyan), and p53 (green). Scale bar, 100 μm. (E) Tumor growth curves (left) and Kaplan-Meier survival analysis (right) for CRC PDO xenografts treated with h.19-h.28z or h.uPAR-h.28z CAR T cells. (F) Immunofluorescence staining of HGSOC PDX tumors showing merged channels (left), WT1 (green, middle), and uPAR (red, right). Scale bars, 100 μm. The graphs show tumor growth curves and Kaplan-Meier survival analysis for the HGSOC PDX xenografts treated with h.19-h.28z or h.uPAR-h.28z CAR T cells. (G) Immunofluorescence staining of MOC PDX tumors showing merged channels (left), p53 (green, middle), and uPAR (red, right). Scale bars, 100 μm. The graphs show tumor growth curves and Kaplan-Meier survival analysis for the MOC PDX xenografts treated with h.19-h.28z, h.uPAR-h.28z, or h.uPAR-h.28z 1XX CAR T cells. (H) Representative IF staining of relapsed tumor samples from NCI-H1703 (relapse at day 284) and PDX-MOC (relapse at day 200), showing uPAR (red), αSMA (cyan), and p53 (green). Scale bars, 100 μm. (I) Flow cytometry histograms showing uPAR surface expression in parental and relapsed tumor cells from MPB1 (MycOE;Trp53−/−;Brca1−/−) and MP (MycOE;Trp53−/−) models. Overlays compare parental isotype, parental uPAR, relapsed isotype, and relapsed uPAR signals. (J) Tumor growth curves (left) of MP (MycOE;Trp53KO) mouse ovarian tumors, either WT or uPARKO. Bar plot (right) shows the distribution of metastatic and non- metastatic disease for mice with WT versus uPARKO tumors. (K) Kaplan-Meier analysis shows survival of mice bearing MP or MPB1 tumors with and without uPAR KO. p values compare uPARKO to uPAR WT. (L) Tumor growth curve of Tyk-nu human HGSOC xenografts comparing WT versus uPARKO tumors. Statistical significance was determined using multiple t test (A; E, left; F, middle; G, middle; and J) and log-rank (Mantel-Cox) test (E, right; F, right; G, right; and K). Error bars indicate SEM.
Figure S11 · PDF 第 60 页
Figure S11. Safety evaluation using mice with humanized immune system, related to Figure 6 (A) Flow cytometry analysis of human CD45+ cells showing uPAR expression in immune cell subpopulations from bone marrow in humanized immune system mice at baseline. (B) Flow cytometry analysis of Tyk-nu cells with ectopic CD19 expression, confirming uPAR and CD19 expression. (C) Schematic showing human uPAR CAR T cell designs: 28ζ (CD28-CD3ζ) and 28ζ-1XX (CD28-CD3ζ with ITAM2/3 inactivated).50 (D) Flow cytometry plot showing expression of CD3 and LNGFR (marker for CAR) in TRAC-edited human T cells. (E) Pie charts showing the proportions of T cells with surface expression of CD3 and CAR after TRAC editing: CD3-CAR+ (TRAC-edited CAR T), CD3+CAR+ (unedited CAR T cells), CD3+CAR− (WT T cells), and CD3-CAR− (TRAC-edited WT T cells). (F) Cytotoxic activity of CAR T cells derived from TRAC-edited human T cells against luciferase-expressing Tyk-nu cells, assessed using an 18 h bioluminescence assay. (G) Radiance measurement reflecting tumor burden in mice with a humanized immune system and rechallenged with Tyk-nu or Tyk-nu-uPARKO cells. (H) Representative flow cytometry histograms showing uPAR expression on the indicated cell types at 1 week post-treatment with 1 × 10⁶ of control (TRAC-UTD), TRAC-edited CD19-CAR T (TRAC-h.19-h.28z.1XX), or TRAC-edited uPAR-CAR T (TRAC-h.uPAR-h.28z.1XX CAR T cells [T1 or A1]). (I) Bar plot showing uPAR median fluorescence intensity (MFI) in human immune cells 1 week post-treatment with TRAC-edited untransduced or CAR T cells. (J) Bar plot showing uPAR expression (MFI) in uPAR+ or uPAR- granulocytes and monocytes 1 week post-treatment with TRAC-edited UTD or CAR T cells. (K and L) Representative flow cytometry plots showing effects of co-culturing freshly isolated human primary CD14+ monocytes from peripheral blood mono nuclear cells with (K) h.19-h.28z or (L) h.uPAR-h.28z CAR T cells. (M) Flow cytometry plots showing expression of uPAR in CD14neg, CD14low, and CD14high monocyte populations from bone marrow of humanized mice. Error bars indicate SD (F) or SEM (I and J).
完整阅读记录与证据表
文献卡:uPAR阳性肿瘤与基质的CAR T靶向
- Paper ID:p-0019-art-convergent-upar-positive-tumor-ecosystem
- 分析日期2026-09-21;晨会2026-09-23。
- Skill:article-read、morning-report、pdf、web-publish。
- 63页来稿已读;独立Tables S1–S4、Data S1、Video S1未取得,详见本地coverage.md。
- 人工核对:pending。
- 图集:本地figures/README.md,29 PNG(7主图、12补图、图形摘要、9页资源表),网页9图。
一句话结论
uPAR标记跨癌种的恶性细胞状态与部分支持性基质,靶向uPAR的CAR T在临床前模型中可控制肿瘤,并受益于联合基质靶向或诱导衰老样状态的治疗;患者治疗效果和长期安全性未确立。
研究问题与背景
实体瘤CAR T受抗原异质性与基质/免疫排斥影响。本文提出以跨谱系的细胞状态抗原uPAR同时攻击肿瘤和部分异常基质。其研究背景包括作者此前关于衰老细胞与纤维化的工作。
贡献与比较对象
多尺度人组织关联、物种特异性拆分肿瘤/基质靶向、正常造血细胞阳性对照,构成主要贡献。对照包括CD19 CAR、未转导T细胞、uPAR敲除肿瘤、单独靶向人或鼠uPAR、顺铂单药。研究没有人与人治疗比较,也未直接比较全部实体瘤CAR靶点的临床安全窗。
方法与验证
患者蛋白图谱和TCGA等用于候选状态识别;Xenium单份PDAC及多癌种24标记成像用于空间定位;癌细胞系/类器官、NSG异种移植、同系/自发卵巢癌和HSPC人源化NBSGW用于分层验证。人CAR主要采用CD28-CD3ζ,部分实验为1XX,安全模型还进行TRAC编辑;具体构型与供者/模型须随结果注明。(第3–17、30–40页)
统计采用t检验、ANOVA、log-rank、相关及Wilcoxon等;图注与部分方法存在不一致。小鼠、患者、细胞及视野按各自实验单位记录;细胞和视野嵌套于生物学样本内。原始数据未重分析。
核心证据
| 主张或结果 | 数字、条件或比较 | PDF页/图表 | 依据类型 | 核对状态 |
|---|---|---|---|---|
| 跨癌种蛋白表达 | 肿瘤n=1,074,约15%高表达,>50%肿瘤细胞uPAR+ | 3–4、17;图1A | 正文/原图 | 样本比例,不是适用人群比例 |
| 遗传/状态关联 | TCGA n=10,071;TP53/RAS改变、EMT等 | 4、6、36–39;图1、S1 | 正文/图 | 相关性,bulk来源限制 |
| 共同空间邻域 | 单份PDAC Xenium;多癌种24-plex;PDAC101等 | 5–7、37–38;图2、S2–3 | 正文/图/方法 | 空间共定位;抑制功能需相应干预证据 |
| 抗原特异性 | T1/A1结合D2–D3;uPAR KO降低杀伤 | 7、47–48;S4 | 正文/图 | 已核;KO检验所测模型的抗原依赖性 |
| 抗原密度线索 | 71癌细胞系+2正常+1KO;约1500分子/细胞 | 7–8、34;图3、独立Data S1 | 正文/图;部分正文转述 | 阈值独立数据缺失,非临床标准 |
| 多模型疗效 | 肺/胰腺/卵巢等CDX,CRC PDO,卵巢PDX;CD19对照 | 7–10、49–54;图3–4、S5–7 | 正文/图 | 模型间不均一,部分复发 |
| 双肿瘤/基质靶向 | 人CAR低剂量加鼠CAR优于补入CD19 CAR的对照 | 10–12、55–56;图5C、S8 | 正文/图 | 支持基质贡献,跨物种限制 |
| 人组织离体靶向 | HGSOC4,LUAD1;CAF HGSOC4/CRC2,M2供者2 | 12、35–36、55–57;图5F–K、S8–9 | 正文/图/方法 | 部分P>.05,不称所有亚群显著 |
| 同系模型安全性 | 自发卵巢癌,短暂体重下降,第40天血常规 | 12–14;图6D–F | 正文/图 | 短期观察;长期毒性待评价 |
| 人源化血液学 | 匹配供者HSPC/T,供者n=2;TRAC编辑1XX;第7天骨髓,以鼠CD45⁺细胞归一化 | 13–14、31–32、60–61;图6G–K、S11 | 正文/图/方法 | 短期相对计数;延迟毒性待评价 |
| 正常单核细胞 | 人外周血单核细胞离体可被杀伤 | 14、60–61;S11K–M | 正文/图 | 体内再生机制为解释而非直接证明 |
| 顺铂联合 | MPB1模型80%无瘤>300天;KP肺组织负荷降低 | 14–16、62–63;图7、S12 | 正文/图 | 长期比例来自MPB1小鼠模型;S12J为UTD与CAR两组,联合方案血液学安全性仍待评价 |
| 复发与1XX | 部分复发uPAR保持;MOC PDX1XX控制更持久 | 7、49–50;S5G–I | 正文/图 | 复发机制仍待进一步分解 |
局限
作者明确指出
PanCK可能遗漏完全EMT细胞,IF阈值非绝对量,癌种构成偏倚;RNA而非肿瘤特异蛋白关联;空间切片有限;衰老定义不完整;模型未重现人肿瘤结构/免疫复杂度;人/鼠抗原不交叉反应限制毒性评估;人源化观察短,不能排除延迟毒性;suPAR并非肿瘤专一;髓系维持机制待研究。(第17页)
AI推断与理由
uPAR高表达可作为候选生物学特征,但TP53突变、PLAUR RNA或单一组织阈值都不足以替代临床靶点验证。双靶向实验支持功能贡献,CAF与髓系细胞的相对权重仍待分解;体外减少的细胞比例、视野浸润和患者治疗获益是不同层级。短期血液检查和正常单核细胞可被杀伤的结果共同提示,正常组织作用及长期毒性仍需评价。这些为基于本研究设计的解释,不新增未经测试的干预建议。
待核对问题与后续阅读
原文图注/图面/统计口径差异详列coverage.md;优先补独立Data S1和表S1–S4,核实样本独立性、靶点定量和毒性时间序列。Amor2020和Reyes2026仅核查题录/摘要线索,不能称已逐篇精读。未获取视频或原始影像,不以静态截图代替视频证据。