迁移过程中的抗原释放
迁移体(migrasome)是迁移细胞回缩纤维上形成的囊泡结构。本文研究的是:癌细胞播散时释放的这些结构,能否把抗原交给免疫系统,从而限制后续转移灶生长。(PDF第1–2页)
| 证据层级 | 研究体系 | 主要回答的问题 |
|---|---|---|
| 小鼠转移与活体成像 | 4T1乳腺癌、MMTV-PyMT自发乳腺癌 | 迁移体是否形成于血管内,是否影响转移负荷 |
| 免疫机制 | T细胞缺陷、CD8耗竭、LLC-OVA及抗原呈递相关模型 | 哪些免疫环节参与保护作用 |
| 抗原与人体观察 | 蛋白组、抗原缺失实验、3例口腔鳞癌及癌症患者血浆 | 携带什么抗原,人源样本是否存在相应结构 |
主要功能证据来自小鼠。静脉输入肿瘤细胞的模型侧重循环后存活和定植。
Tspan4、迁移体与转移负荷
在免疫完整BALB/c小鼠中,Tspan4缺失的4T1细胞产生较少迁移体,转移负荷升高;Tspan4过表达呈相反方向。图1b每组18只小鼠,生存实验另用独立组数。活体成像直接记录了血管内癌细胞的回缩纤维和迁移体。(图1a–c、i–n;PDF第2–3页)
自发肿瘤模型提供补充证据:16周龄MMTV-PyMT小鼠中,Tspan4缺失组肺转移结节更多,野生型与缺失组分别为21、22只。该实验使用全身Tspan4缺失。(图1d–f)
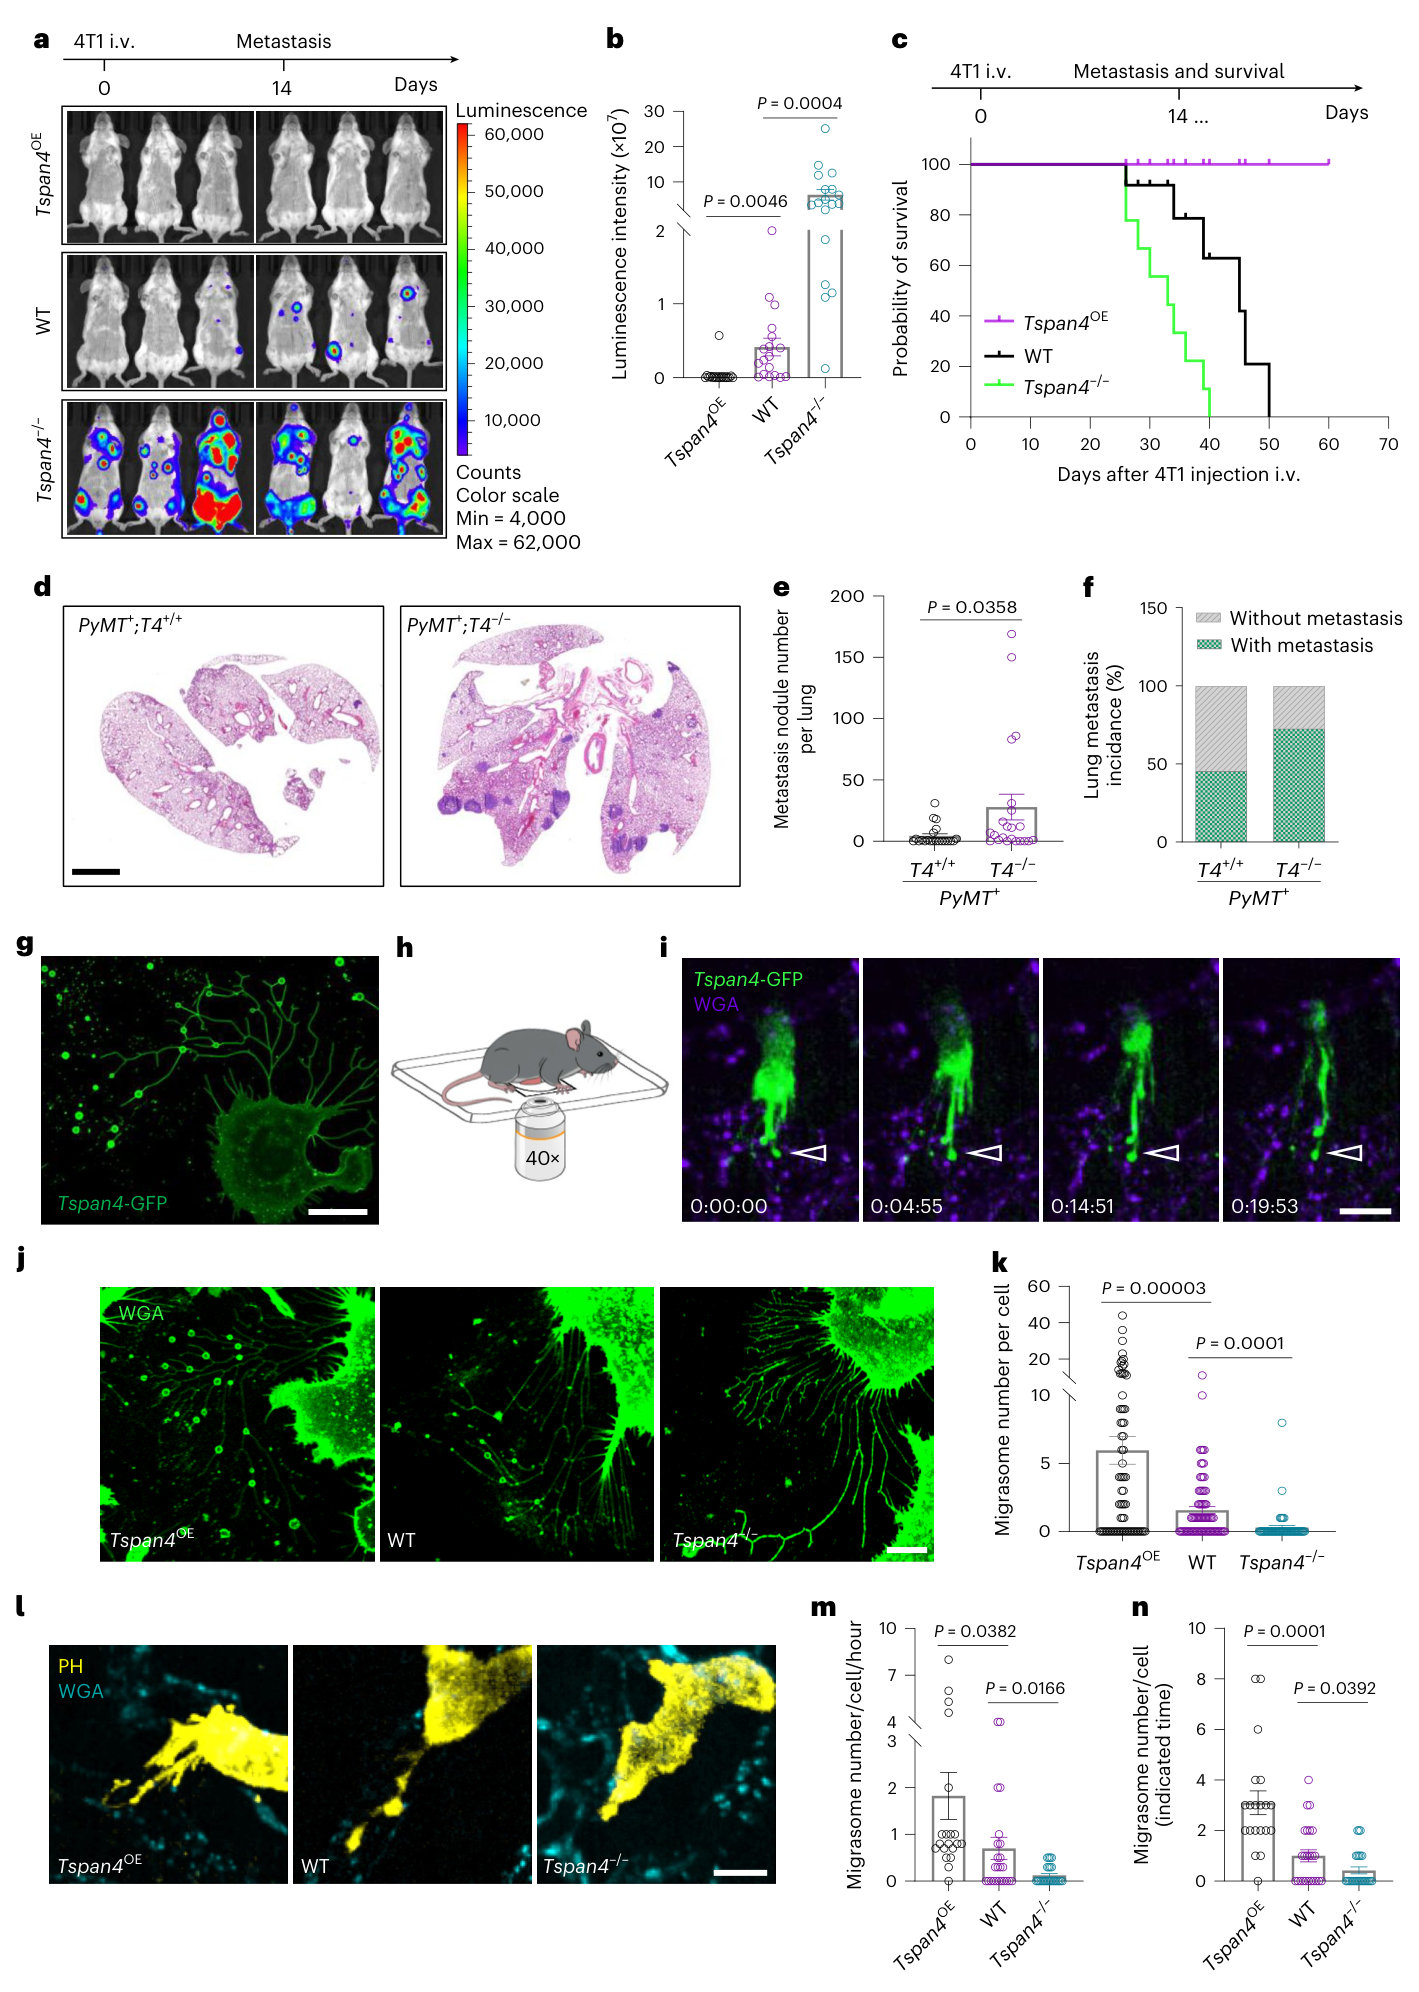
图1 · Tspan4与迁移体形成及转移负荷 · 图片PDF第3页,图注第2页。
补充肿瘤来源迁移体后,Tspan4缺失细胞的高转移表型下降。作者还从荷瘤鼠血中富集迁移体,观察到转移减少和生存延长;侧腹皮下4T1模型也显示后续肺转移结节减少。多数补充实验在肿瘤挑战前给予迁移体。(图2;PDF第2、4–5页)
等蛋白量比较中,迁移体组优于所测试的小型细胞外囊泡、细胞裂解物和凋亡小体条件。(扩展图1d–f)
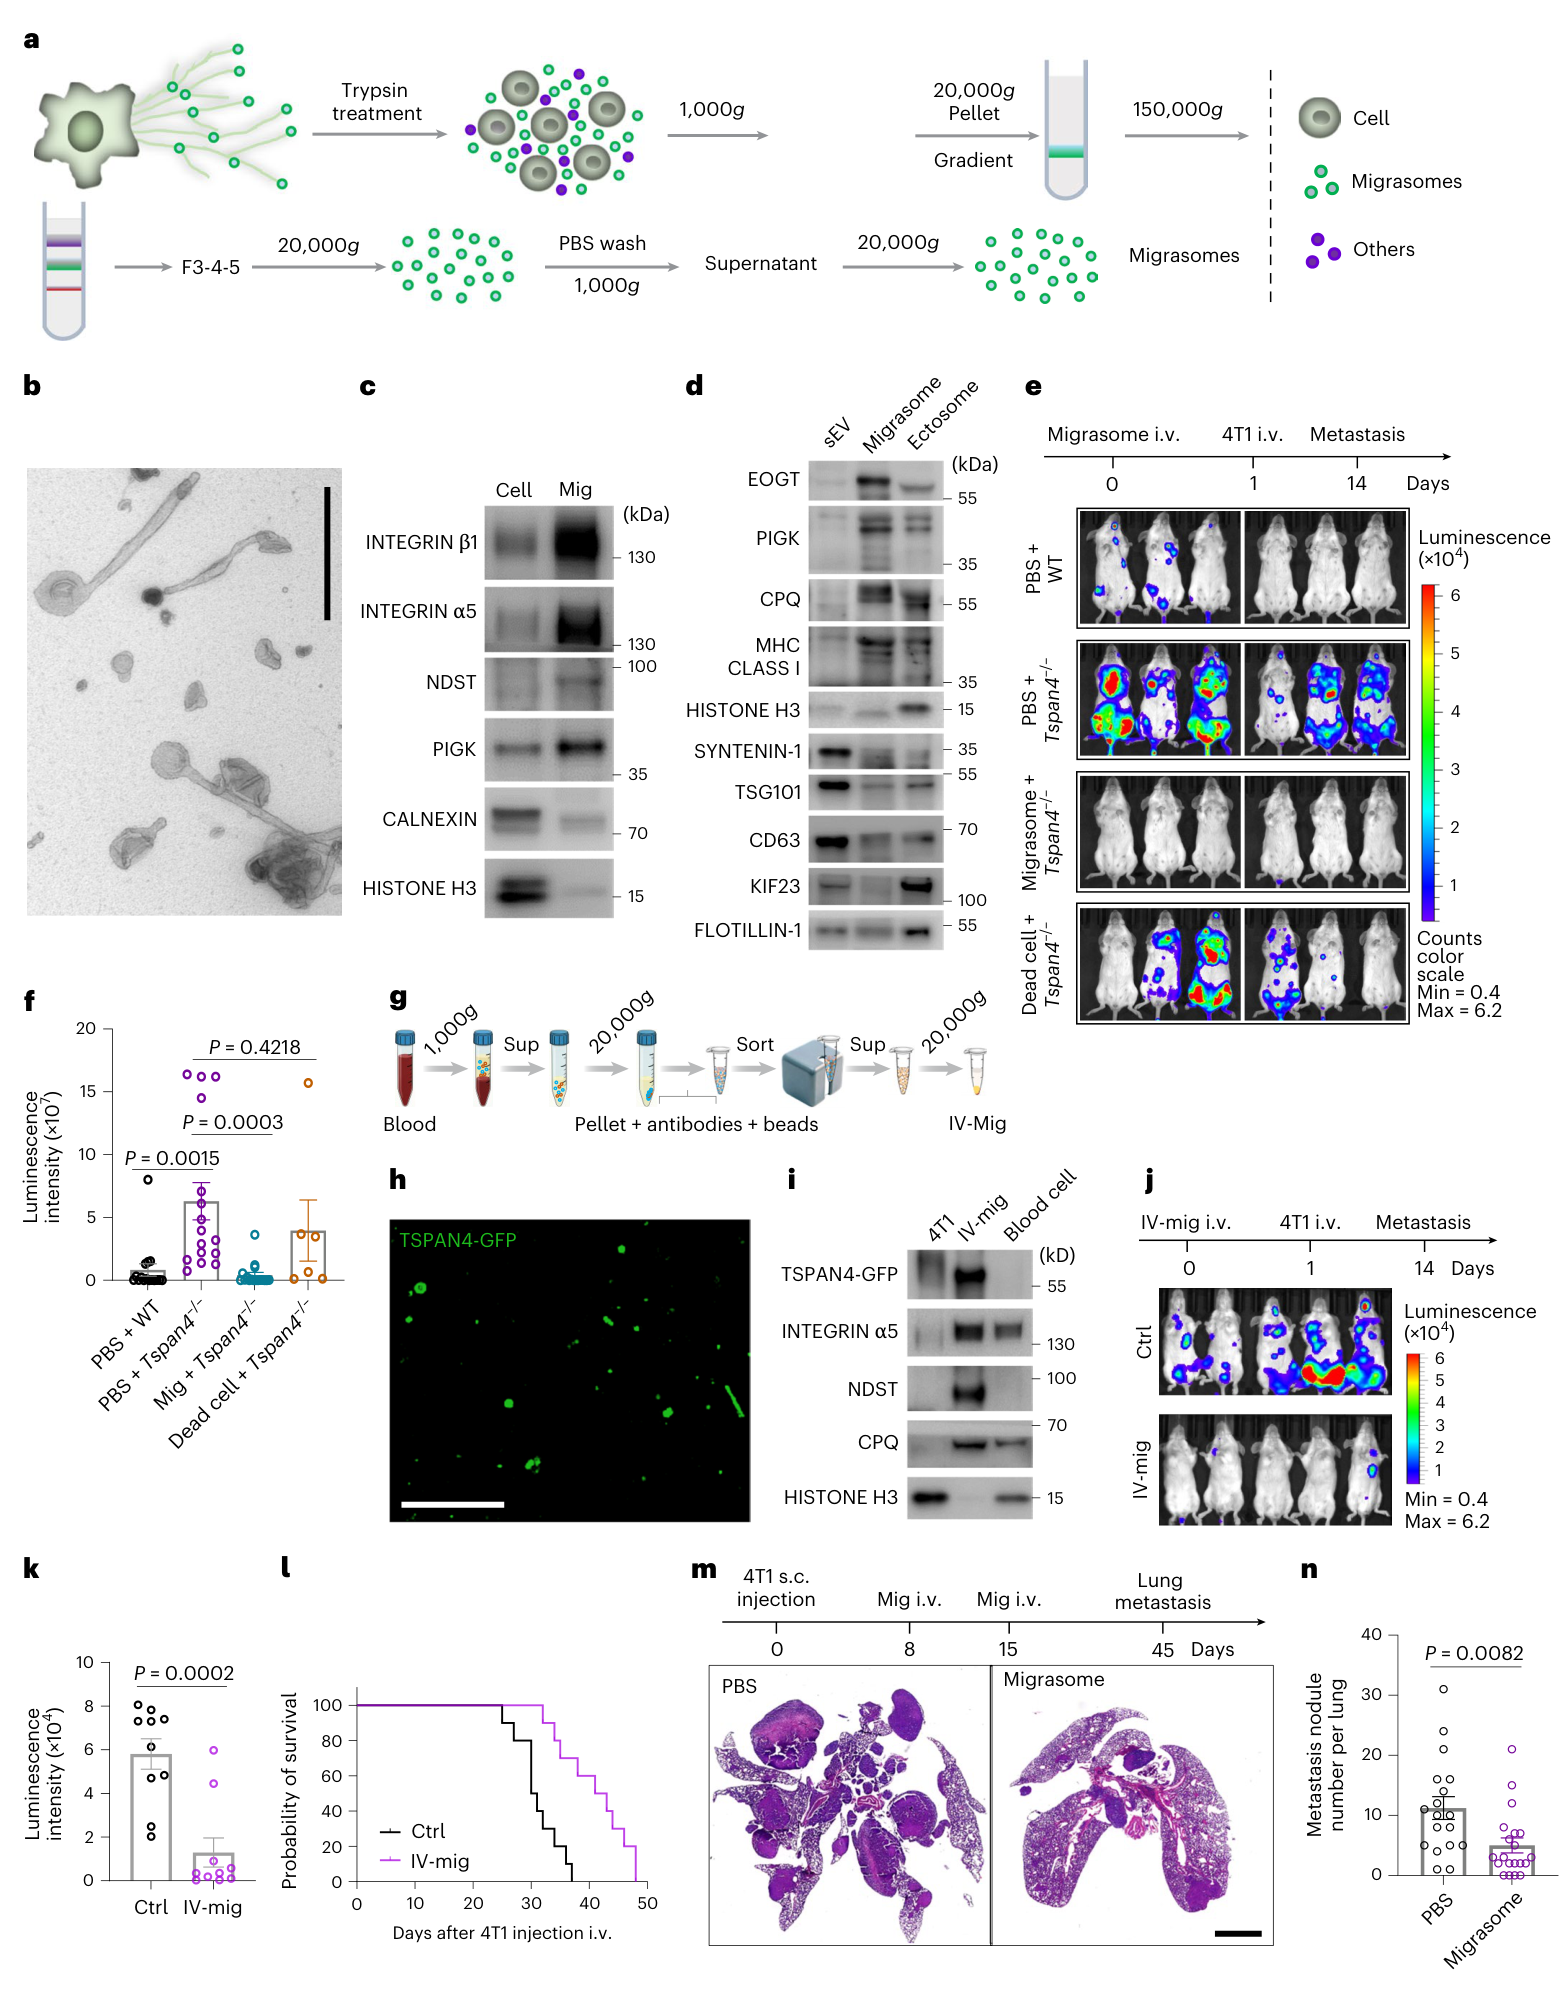
图2 · 补充迁移体后的转移抑制 · 图片PDF第4页,图注第5页。
抗原呈递细胞与CD8⁺ T细胞参与保护
免疫背景改变后,结果随之改变:裸鼠中,Tspan4缺失不再增加转移,补充迁移体也未显示抑制作用。Tspan4过表达组相对野生型的转移均值较高,但这一比较P=0.1403,差异未达统计学显著。CD8耗竭实验则支持CD8⁺ T细胞参与迁移体的保护作用。(图3a–d;PDF第5–6页)
迁移体中富集MHC-I。体外实验中,迁移体单独处理不足以激活初始CD8⁺ T细胞,加入巨噬细胞或树突状细胞后才观察到激活;体内分布和摄取图像提供相应支持。(扩展图2–4、补充图1)
在LLC-OVA模型中,野生型骨髓受体的肺转移灶随迁移体处理减少,而B2m缺失骨髓受体未见显著减少。Batf3缺失也削弱保护效果。这些结果共同支持宿主抗原呈递和交叉呈递参与。额外去除巨噬细胞后的变化仅呈趋势。(图3e–j;PDF第5–7页)
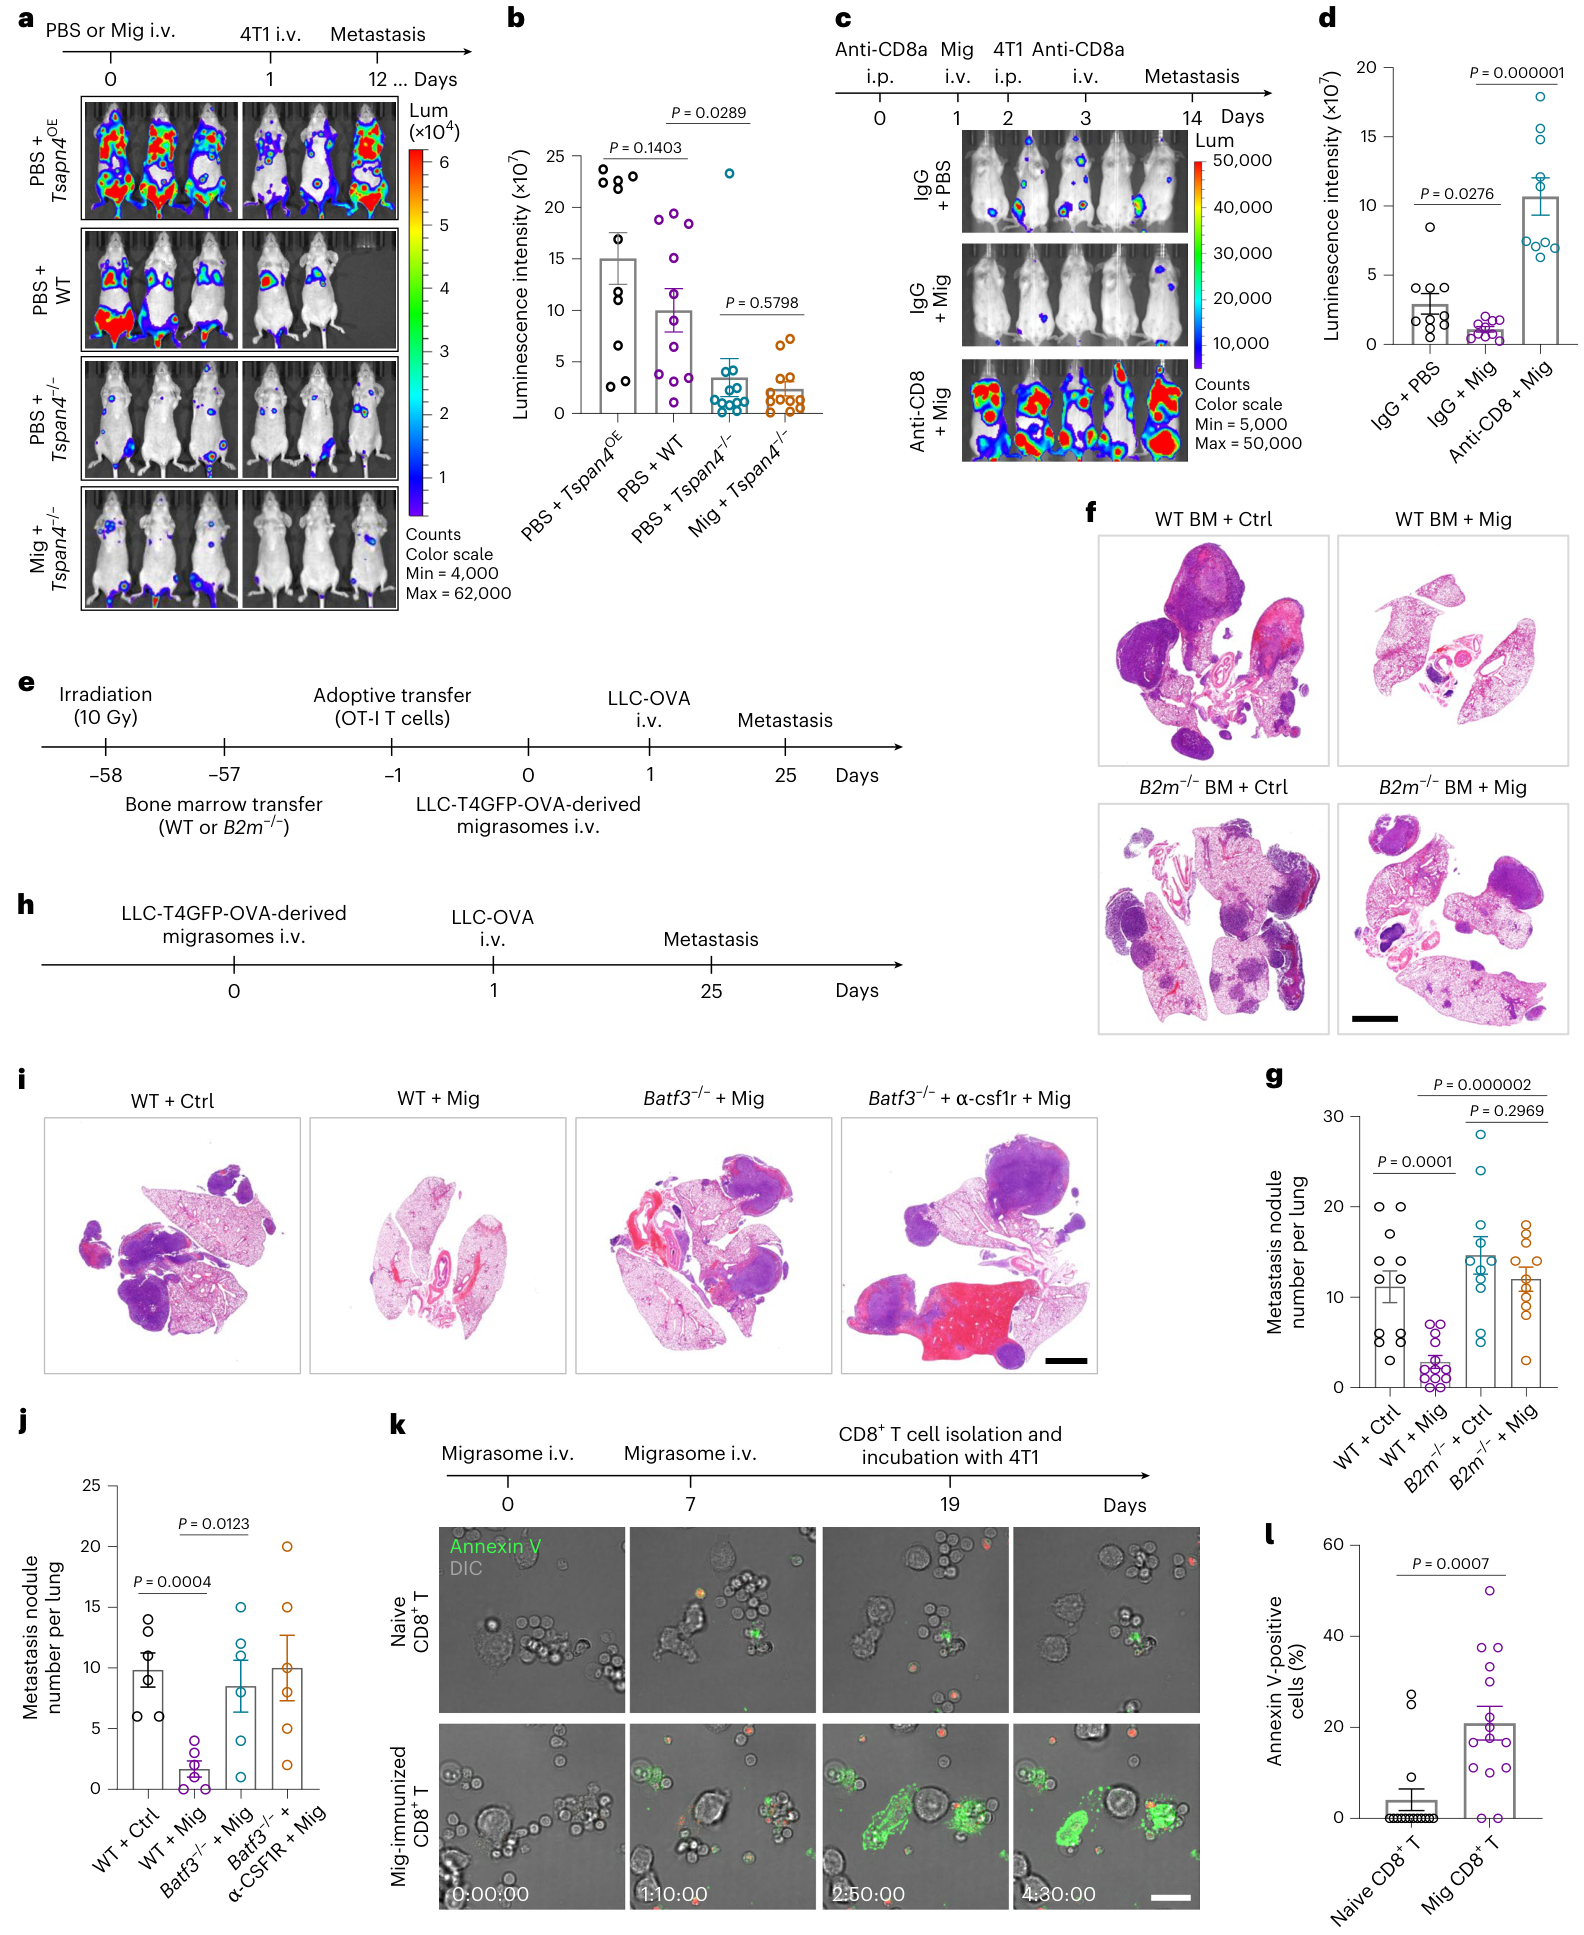
图3 · 迁移体作用的免疫依赖性 · 图片PDF第6页,图注第5页。
抗原富集与功能贡献
蛋白组与基因组的交叉分析发现,迁移体携带癌睾抗原BRDT,以及DDHD1、SDC2等带突变的候选抗原。部分候选肽的免疫实验降低了后续4T1转移负荷,支持其免疫原性。(图4;PDF第7–8页)
上述筛选分析迁移体的蛋白货物,不同候选肽的免疫实验效果有所差异。
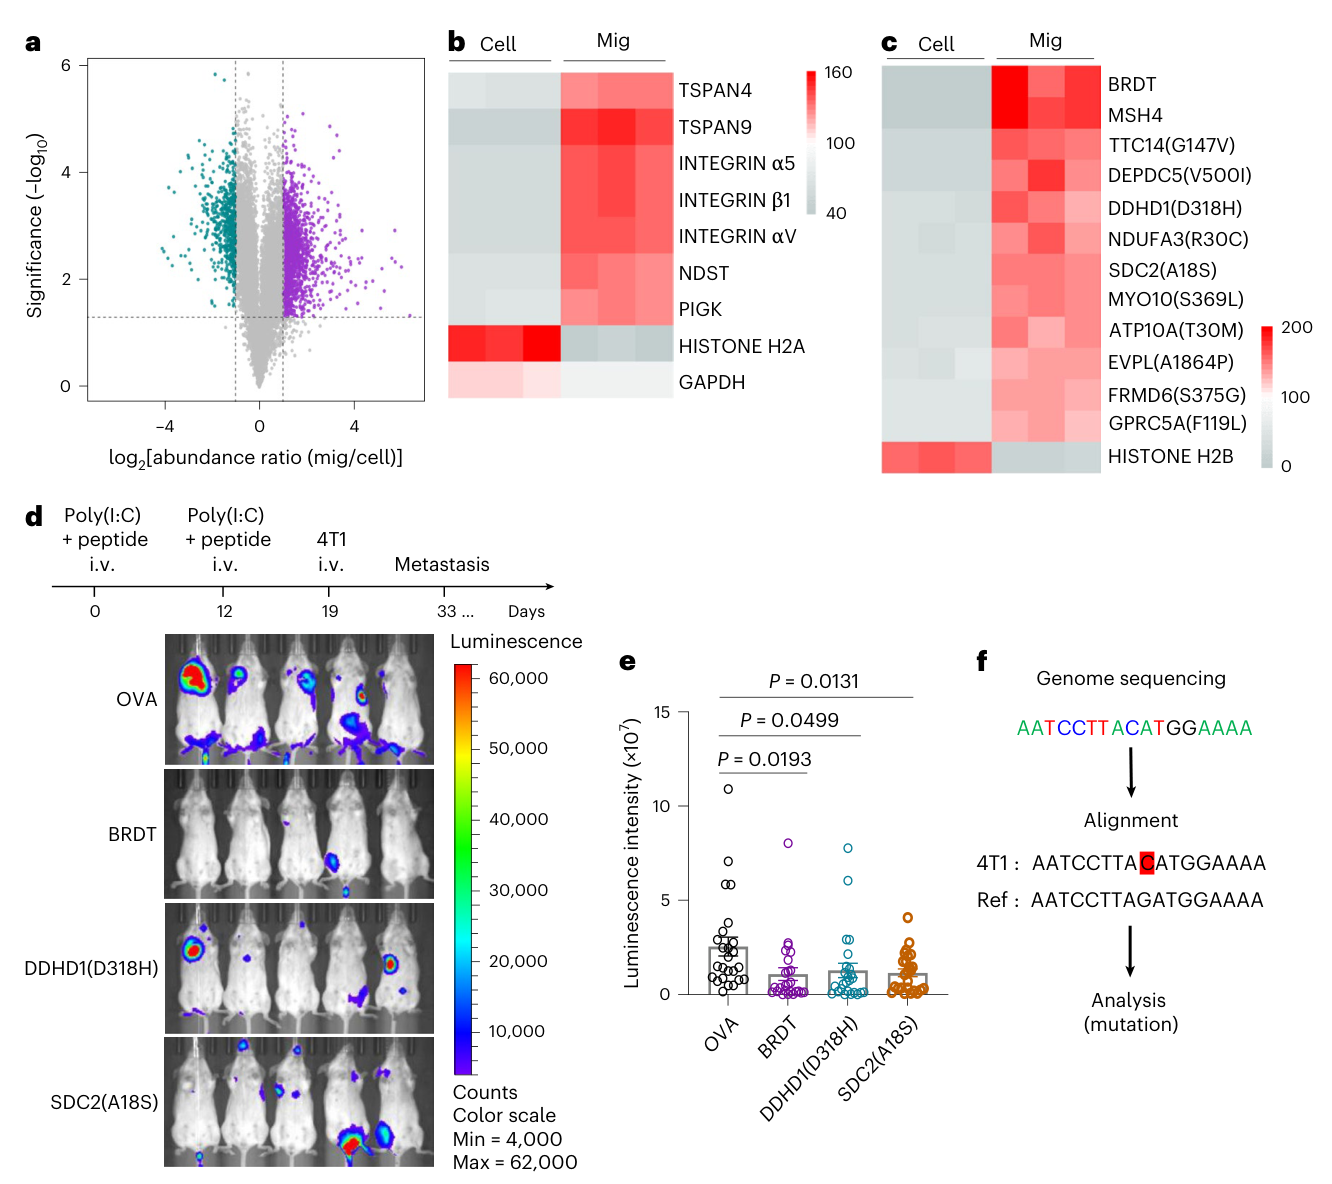
图4 · 迁移体中的候选肿瘤抗原 · PDF第7页。
BRDT的功能证据更强:Brdt缺失来源的迁移体,抑制转移的能力弱于野生型来源迁移体。相对PBS,其残余抑制未达显著(P=0.2963);与野生型迁移体的差异则为P=0.0229。相反,单独去掉Ddhd1或Sdc2后,迁移体仍能降低转移负荷,提示完整货物中存在其他有效抗原。(图5g–j;PDF第8–10页)
这些结果支持BRDT是4T1迁移体的重要免疫原性成分;作者据此提出,多种抗原货物可能共同参与免疫刺激。
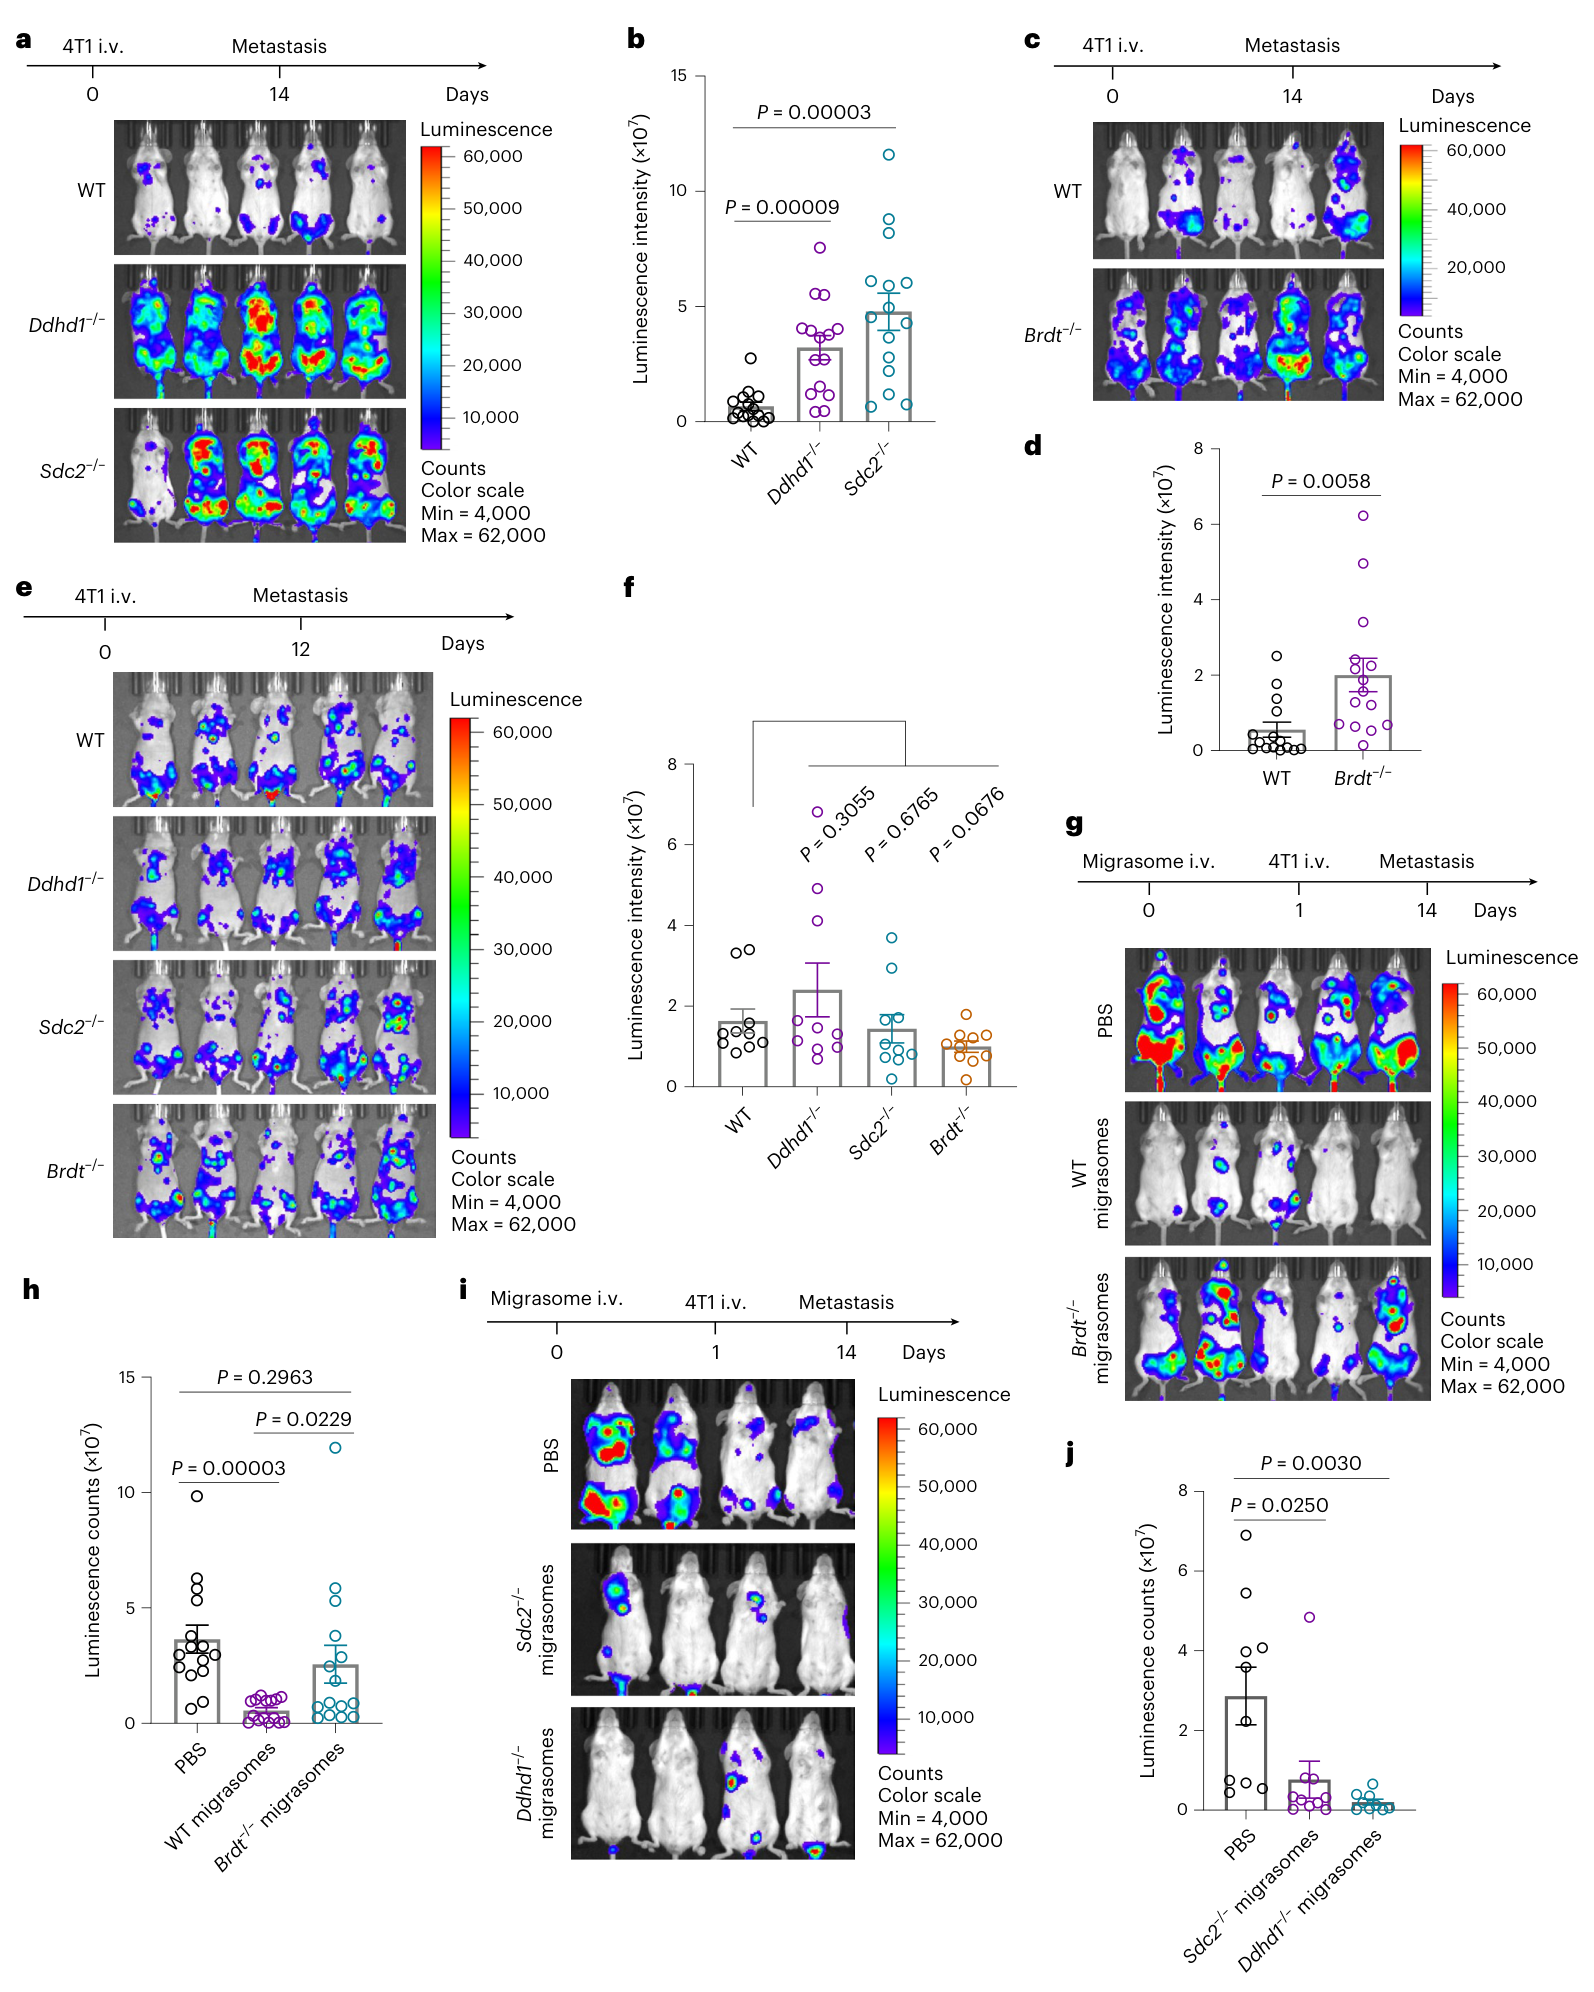
图5 · 抗原缺失与迁移体的功能变化 · 图片PDF第9页,图注第8页。
治疗实验与联合PD-1
作者在输入4T1细胞后的第5、7天给予迁移体,观察到后续转移负荷降低。该实验评价早期荷瘤阶段的干预。(图6a–b;PDF第10、12页)
联合抗PD-1组的平均转移负荷最低,但图6d及源数据列出的统计比较都是各组对PBS:迁移体、抗PD-1及联合组的P值分别为0.0121、0.9207和0.0017。(每组12只小鼠;Source Data Fig. 6)
在MMTV-PyMT自发肿瘤中,肿瘤来源迁移体也降低肺转移结节数,PBS与迁移体组分别为15、17只小鼠。图6g的量化终点是结节数。(图6e–g)
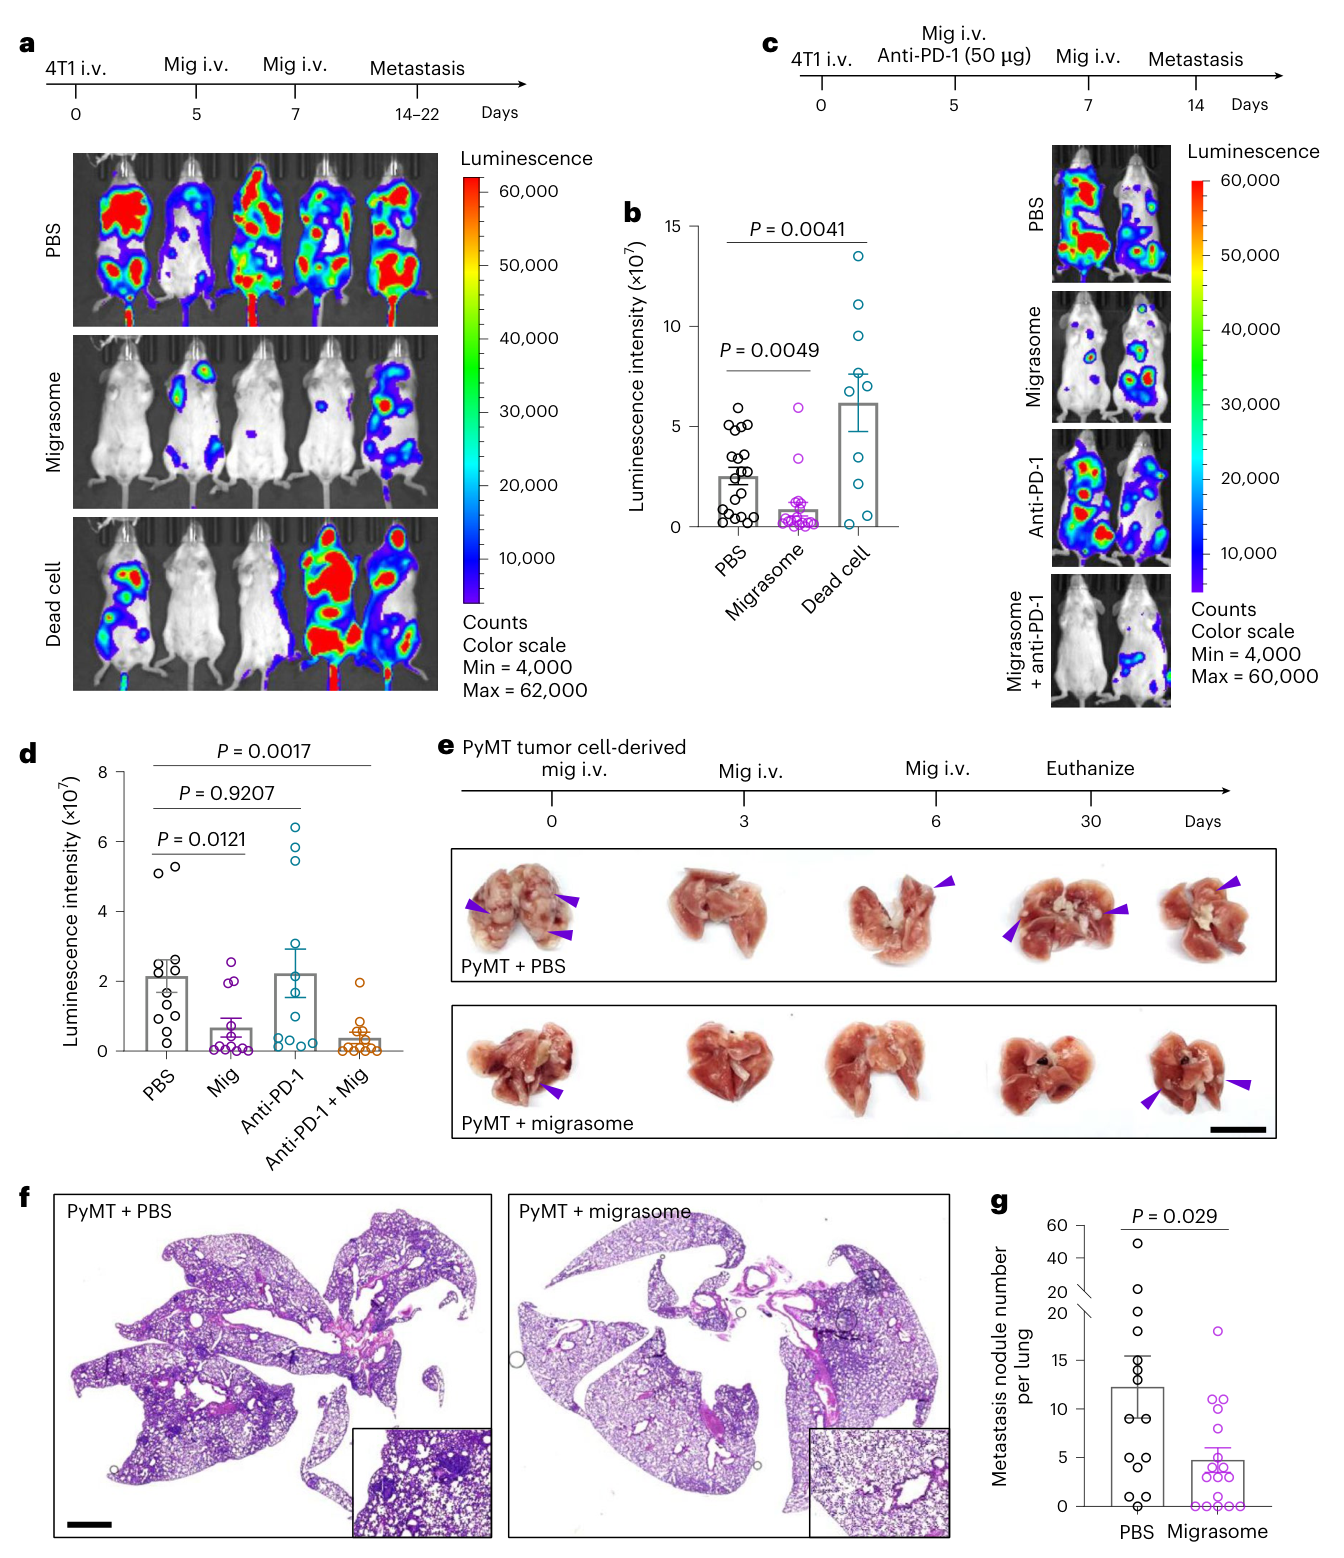
图6 · 小鼠治疗实验及联合PD-1 · PDF第10页。
人源样本与预后分析
3例未经治疗的口腔鳞癌样本,经离体培养后产生带有候选抗原的迁移体。乳腺癌和肺癌患者血浆中也可富集具有相应形态和标志物的结构。上述结果描述了人源迁移体及候选抗原的可检测性。(图7a–e、扩展图8;PDF第12、27页)
TSPAN4生存分析存在需要保留的图文差异:正文强调高表达组十年后曲线较好,但图7g中1,070例患者按中位数分成535+535例,全程log-rank P=0.65,HR=1.1,HR检验P=0.66。全程生存差异未达统计学显著。图7f的表达比较另用了1,085份肿瘤和291份正常组织。(PDF第11–12页)
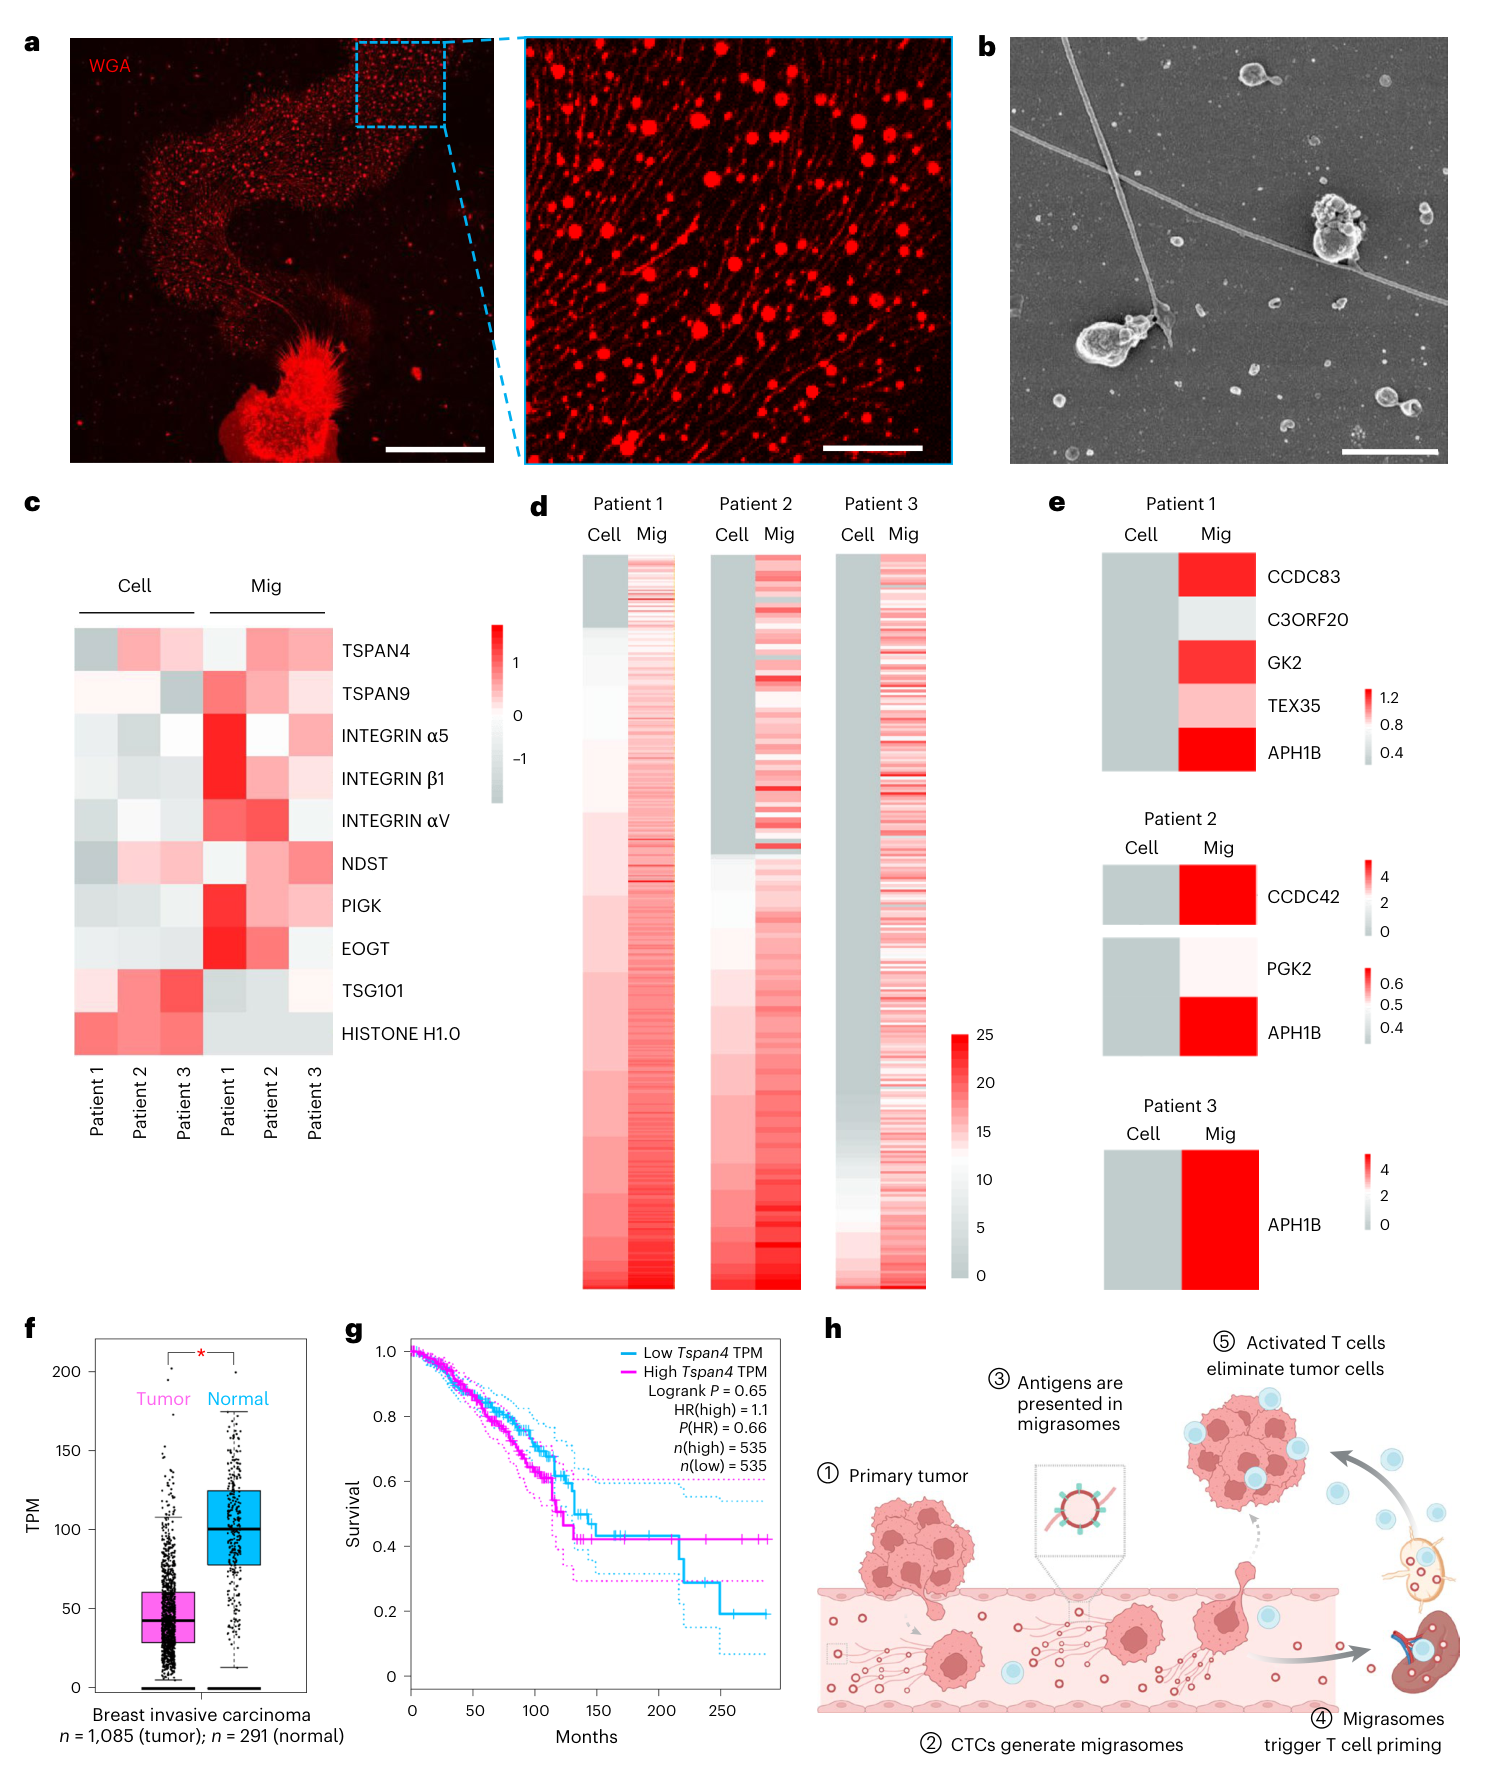
图7 · 人源迁移体与探索性临床关联 · PDF第11页。
机制模型、局限与待解问题
本文支持的机制链是:癌细胞迁移形成迁移体,抗原随之释放,被宿主抗原呈递细胞摄取,并通过CD8⁺ T细胞反应限制部分转移灶生长。该抗原释放路径的净效应依赖免疫背景。
机制实验的特异性仍有局限:全身Tspan4缺失和骨髓B2m缺失涉及多类细胞,Batf3组及巨噬细胞干预尚难定量分离各类呈递细胞的贡献;蛋白货物筛选与候选肽实验,也仍需直接的MHC肽呈递及T细胞识别证据衔接。BRDT的主导作用目前集中于4T1模型,不同抗原可能存在互补(图1、3–5)。
转化证据主要来自预防和早期荷瘤模型。联合PD-1尚缺联合组对迁移体单药的比较及交互作用检验;人血浆富集物可能混入正常来源成分,患者治疗效果尚待研究。TSPAN4全程生存比较不显著,正文对十年后曲线的解释尚缺正式分段检验及独立验证(图6–7)。
仍待解决的问题包括:哪些人肿瘤能产生足够有效的抗原货物,患者中能否形成持续的特异性T细胞反应,以及迁移体的免疫刺激和其他促肿瘤作用如何平衡。线粒体DNA提供内源佐剂、个体化疫苗和改变抗原装载等设想,主要属于讨论中的转化方向,本研究未完成临床验证。(PDF第12–13页)
相关原始研究线索:
- Ma等,2015:Discovery of the migrasome, an organelle mediating release of cytoplasmic contents during cell migration。迁移体概念的原始研究。
- Huang等,2019:Migrasome formation is mediated by assembly of micron-scale tetraspanin macrodomains。迁移体形成与四跨膜蛋白大尺度微区。
- Chen等,2018:Exosomal PD-L1 contributes to immunosuppression and is associated with anti-PD-1 response。用于比较细胞外囊泡的不同免疫效应。
以上题录及链接已在本篇出版社参考文献表核对,未在本轮重读三篇全文。
主图与表格 · 7 张
Figure 1 · PDF 第 3 页
Fig. 1 | Tspan4 regulates the metastasis of 4T1 cells and the production of migrasomes during this process. a, Cells (4T1) were injected i.v., and in vivo photo emission of 4T1 cells was detected by d-Luciferin injection and imaged using an IVIS spectrum imaging system on day 14. b, Statistics of the luminescence counts of 4T1 cells. n = 18 mice for each group. c, Survival plots for mice injected with WT, Tspan4−/− and Tspan4OE 4T1 cells. Tspan4OE, n = 13 mice; WT, n = 12 mice; Tspan4−/−, n = 9 mice. d, H&E-stained lung images of MMTV-PyMT;Tspan4+/+and MMTV-PyMT;Tspan4−/− mice. Scale bar, 2 mm. e, Quantification of the number of metastasis nodules in lung. T4+/+, n = 21 mice, T4−/−, n = 22 mice. f, Quantification of the incidence of lung metastasis. g, Confocal imaging of Tspan4-GFP expressing 4T1 cells after seeding on fibronectin (10 μg ml−1) and laminin (1 μg ml−1) for 24 h in vitro. Scale bar, 20 μm. h, Diagram of intravital imaging. i, Tspan4-GFP stably expressing 4T1 cells were injected into the mice for liver intravital imaging. Vessels were labeled with AF647-conjugated wheat germ agglutinin (AF647-WGA). Scale bar, 10 μm. Arrowheads indicate migrasomes. j, Confocal imaging of WT, Tspan4−/− and Tspan4OE 4T1 cells seeded in fibronectin (10 μg ml−1) and laminin (1 μg ml−1)-coated dishes and stained with WGA (1 μg ml−1). Scale bar, 10 μm. k, Quantification of the number of migrasomes in WT, Tspan4−/− and Tspan4OE 4T1 cells. Tspan4OE, n = 73 cells; WT, n = 80 cells; Tspan4−/−, n = 56 cells. l, WT, Tspan4−/− and Tspan4OE 4T1 cells were transfected with PH-mCherry and injected into mice for intravital imaging. m,n, Quantification of the number of migrasomes produced by WT, Tspan4−/− and Tspan4OE 4T1 cells in vivo. Tspan4OE, n = 20 cells; WT, n = 24 cells; Tspan4−/−, n = 26 cells. Statistical data in b, e, k, m and n are presented as the mean ± s.e.m. P values were calculated using a two-tailed, unpaired t-test.
Figure 2 · PDF 第 4 页
Fig. 2 | Injection of 4T1-derived migrasomes inhibits metastasis. a, Purification of migrasomes (mig) from in vitro-cultured 4T1 cells stably expressing Tspan4-GFP. b, TEM image of purified 4T1 migrasomes. Scale bar, 1 μm. c, Western blot analysis of 4T1 cells and purified 4T1 migrasomes using indicated antibodies. d, Western blot analysis of sEV markers (CD63, TSG101, SYNTENIN-1), ectosome marker (KIF23), migrasome markers (EOGT, PIGK, CPQ), MHC class I and flotillin-1 in migrasome, sEV and ectosome fractions isolated from 4T1 cells. e, Migrasomes (from 4T1 cells), UV-irradiated 4T1 cells (dead cells) or PBS were i.v. injected into mice, and WT or Tspan4−/− 4T1 cells were i.v. injected, at 16 h after injection of migrasomes. In vivo photo emission of 4T1 cells was detected by d-luciferin injection and imaged with an IVIS spectrum imaging system on day 14. f, Statistics of the luminescence counts of 4T1 cells. PBS + WT, n = 16 mice; PBS + Tspan4−/−, n = 16 mice; migrasome + Tspan4−/−, n = 17 mice; Dead-cell + Tspan4−/−, n = 6 mice. g, Diagram of negative selection of in vivo 4T1-derived migrasomes. h, Confocal imaging of negatively selected 4T1-derived migrasomes. Scale bar, 20 μm. i, Western blot analysis of 4T1 cells, blood cells and IV-migs using the indicated antibodies. j, IV-migs or PBS were i.v. injected into mice, and 4T1 cells were i.v. injected at 16 h after injection of migrasomes. In vivo photo emission of 4T1 cells was detected by d-luciferin injection and photographed with an IVIS spectrum imaging system on day 14. k, Statistics of the luminescence counts of 4T1 cells. n = 10 mice for each group. l, Survival plots for mice from k. m, H&E-stained lung images from mice treated with PBS or 4T1 migrasomes (10 μg each). n, Quantification of the number of metastasis nodules per lung. PBS, n = 18; migrasome, n = 20. Statistical data in f, k and n are presented as the mean ± s.e.m. P values were calculated using a two-tailed, unpaired t-test. s.c., subcutaneous; sup, supernatant; ctrl, control.
Figure 3 · PDF 第 6 页
Fig. 3 | Migrasomes induce CD8+ T cell priming. a, PBS or purified migrasomes were i.v. injected into BALB/c-nude mice on day 0. After 16 h, 4T1 cells were i.v. injected, and bioluminescence imaging (IVIS) was performed on day 12. b, Quantification of bioluminescence signals. PBS + Tspan4OE, n = 11 mice; PBS + WT, n = 11 mice; PBS + Tspan4−/−, n = 12 mice; Mig + Tspan4−/−, n = 12 mice. c, Anti-CD8a or IgG (160 μg) was injected intraperitoneally (i.p.) as the time bar indicates. After 24 h, migrasomes or PBS were i.v. injected, and 16 h later WT 4T1 cells were i.v. injected. Bioluminescence imaging was performed on day 14. d, Quantification of bioluminescence. n = 10 mice for each group. e, Schematic diagram of the experimental timeline for bone marrow transplantation and migrasome treatment. Eight‑week‑old C57BL/6J mice were irradiated (10 Gy) and reconstituted with WT or B2m−/− bone marrow. After 8 weeks, all mice received OT‑I CD8+ T cells, followed by migrasomes or vehicle, and LLC‑OVA challenge. Lungs were collected at the endpoint. f, Representative H&E staining of lung tissue sections from each group, revealing metastatic tumor foci. Scale bar, 2.5 mm. g, Quantification of metastatic tumor foci per lung section. n = 12 mice for WT BM + Ctrl, n = 13 mice for WT BM + Mig, n = 11 mice for B2m−/− BM + Ctrl and B2m−/− BM + Mig groups. h, Schematic diagram of the experimental timeline. i, Representative H&E-stained lung sections showing metastatic foci. Scale bar, 2.5 mm. j, Quantification of metastatic foci. n = 6 mice per group. k, In vitro killing assay. Mice were i.v. injected with migrasomes or PBS on days 0 and 7. On day 19, splenic CD8+T cells were co-cultured with 4T1 cells, stained with annexin V, and imaged. Scale bar, 20 μm. l, Quantification of annexin V-positive cells. n = 15 fields per group. Statistical data are presented as the mean ± s.e.m. P values were calculated using a two-tailed, unpaired t-test.
Figure 4 · PDF 第 7 页
Fig. 4 | Tumor-associated antigens are enriched in migrasomes. a, Volcano plot showing mass spectrometry-based quantification of TMT-labeled proteins. Upper‑right dots represent a migrasome/cell abundance ratio ≥ 2, P < 0.05; upper‑left dots represent a migrasome/cell abundance ratio < 0.5, P < 0.05. n = 3 independent experiments. P values were calculated using a two-tailed, two-sample unequal variance t-test. b, Heat map plot showing the distribution of migrasome marker proteins in 4T1 cells and migrasomes. c, Heat map plot showing testis-specific proteins and a top 10 list of mutated proteins that are enriched in migrasomes. d, BRDT, DDHD1(D318H) and SDC2(A18S) peptides (100 μg) were mixed with Poly I:C (50 μg) and injected (i.v.) into mice on day 0 and day 12. Seven days later, 4T1 cells were injected (i.v.) and in vivo photo emission of 4T1 cells was detected by d-luciferin injection and imaged using an IVIS spectrum imaging system on day 33. e, Statistics of the luminescence counts of 4T1 cells. n = 25 mice for each group. f, Genome sequencing of 4T1 cells to identify single-nucleotide mutations. The reference genome sequence of BALB/c was from the UCSC database. Statistical data in e are presented as the mean ± s.e.m. P values were calculated using a two-tailed, unpaired t-test.
Figure 5 · PDF 第 9 页
Fig. 5 | Tumor-associated antigen depletion aggravates 4T1 metastasis. a, WT, Ddhd1−/− and Sdc2−/− 4T1 cells were injected (i.v.), and in vivo photo emission of 4T1 cells was detected by d-luciferin injection and imaged using an IVIS spectrum imaging system on day 14. b, Statistics of the luminescence counts of 4T1 cells. n = 15 mice for each group. c, WT and Brdt−/− 4T1 cells were injected (i.v.), and in vivo photo emission of 4T1 cells was detected by d-luciferin injection and imaged using an IVIS spectrum imaging system on day 14. d, Statistics of the luminescence counts of 4T1 cells. n = 15 mice for each group. e, WT, Ddhd1−/−, Sdc2−/− and Brdt−/− 4T1 cells were injected (i.v.) into BALB/c-nude mice and in vivo photo emission of 4T1 cells was detected by d-luciferin injection and imaged using an IVIS spectrum imaging system on day 12. f, Statistics of the luminescence counts of 4T1 cells in BALB/c-nude mice. n = 10 mice for each group. g, Migrasomes were purified from Tspan4-GFP stably expressing WT and Brdt−/− 4T1 cell lines and injected (i.v.) into BALB/c mice. PBS served as a negative control. 4T1 cells were injected (i.v.) on the next day after migrasome injection. In vivo photo emission of 4T1 cells was detected by d-luciferin injection and imaged using an IVIS spectrum imaging system on day 14. h, Statistics of the luminescence counts of 4T1 cells. n = 15 mice for each group. i, Mice were i.v. injected with PBS control or Sdc2-/Ddhd1-deficient migrasomes, followed by i.v. injection with 4T1 cells the next day. In vivo photo emission of 4T1 cells was detected by d-luciferin injection and imaged using an IVIS spectrum imaging system on day 14. j, Statistics of the luminescence counts of 4T1 cells. n = 10 mice for PBS and Sdc2−/− groups, n = 9 mice for Ddhd1−/− group. Statistical data in b, d, f, h and j are presented as the mean ± s.e.m. P values were calculated using a two-tailed, unpaired t-test.
Figure 6 · PDF 第 10 页
Fig. 6 | Migrasomes have therapeutic vaccine potential for cancer immunotherapy. a, Cells (4T1) were injected (i.v.) at day 0. Migrasomes were purified from Tspan4-GFP expressing 4T1 cells and injected (i.v.) into mice on day 5 and day 7. PBS and UV-irradiated 4T1 cells (Dead-cell) served as controls. In vivo photo emission of 4T1 cells was detected by D-luciferin injection and imaged using an IVIS spectrum imaging system on day 14. b, Statistics of the luminescence counts of 4T1 cells. PBS, n = 20 mice; migrasome, n = 19 mice; Dead-cell, n = 10 mice. c, 4T1 cells were injected (i.v.) on day 0. Migrasomes were purified from Tspan4-GFP-expressing 4T1 cells and injected (i.v.) into the mice on day 5 and day 7. Anti-PD-1 was also injected (i.p.) on day 5 (2.5 mg per kg body weight). PBS and IgG served as controls. In vivo photo emission of 4T1 cells was detected by d-luciferin injection and imaged using an IVIS spectrum imaging system on day 14. d, Statistics of the luminescence counts of 4T1 cells. n = 12 mice for each group. e, Anatomical lung images of MMTV-PyMT mice treated with PBS or PyMT tumor cell-derived migrasomes (10 μg per mouse, each time) from 10 weeks (day 0) for three times at the indicated time points. Arrowheads indicate the metastasis nodules. f, Representative H&E-stained anatomical and histological lung images from e. Insets: higher-magnification views. g, Quantification of the metastasis nodule number per lung image. PBS, n = 15 mice; migrasome, n = 17 mice. Statistical data in b, d and g are presented as the mean ± s.e.m. P values were calculated using a two-tailed, unpaired t-test.
Figure 7 · PDF 第 11 页
Fig. 7 | Migrasomes have clinical significance in human cancers. a, Confocal images of OSCC primary tumor cells seeded in collagen-coated dishes and stained with WGA for imaging. Scale bars, 50 μm and 10 μm (enlarged). b, SEM image of purified OSCC-derived migrasomes. Scale bar, 1 μm. c, Heat map plots show migrasome marker proteins enriched in OSCC-derived migrasomes. d, Heat map plots show mutated proteins enriched in OSCC-derived migrasomes. e, Heat map plots show testis-specific proteins enriched in OSCC-derived migrasomes. The values of the mass spectrometry results in e were normalized according to the amount in the cell and then plotted. f, Tspan4 RNA expression in transcripts per million (TPM) in breast invasive carcinoma tumors and normal tissues from the UCSC Xena Toil RNA-sequencing dataset (TCGA + GTEx). In the box plots, the center line denotes the median, the box represents the interquartile range (25th–75th percentiles), whiskers extend to 1.5 times the interquartile range (excluding outliers), and jitter points represent individual samples. Data were analyzed at https://gepia.cancer-pku.cn/. g, The survival curves of Tspan4-low and Tspan4-high groups dichotomously divided by Tspan4 median in breast invasive carcinoma using TCGA dataset. Data were analyzed at https://gepia. cancer-pku.cn/. HR, hazard ratio. h, Diagram illustrating migrasome-mediated antigen release during metastasis to unlock immunogenicity. Illustration in h created in BioRender; Lam, R. https://biorender.com/r8v3lz6 (2026).
完整阅读记录与证据表
文献卡:迁移体介导的抗原释放与抗转移免疫
- Paper ID:p-0020-art-metastasis-enables-immunogenicity
- 分析日期:2026-09-23;晨会日期:2026-09-24。
- 技能:article-read、morning-report、pdf、web-publish;源数据表只读核对使用Spreadsheets。
- 期刊:Nature Immunology,2026;DOI:10.1038/s41590-026-02641-0。出版社记录在线发表日期2026-09-22,来稿首页仍有日期占位符,原件保留。
- 阅读范围:主PDF32页,含7主图、8扩展图、方法与5页Reporting Summary;另读2页Supplementary Information及4页未裁切条带。独立Reporting Summary为重复附件。9份XLSX已检查结构、关键数据区和统计比较,未重算全部蛋白组与生存数据。2份视频已归档,未播放或逐帧核验。
- 人工核对:pending。图集20 PNG及完整图注见figures/README.md;网页选7主图。
一句话结论
在所研究的小鼠模型中,迁移体将迁移癌细胞的抗原传递给宿主免疫系统,形成依赖免疫背景的抗转移作用;人体部分仍属样本与相关性探索。
研究问题与贡献
研究将抗原释放与活细胞迁移联系起来,补充了细胞死亡和其他细胞外囊泡之外的抗原来源。比较对象包括Tspan4不同表达状态、迁移体补充、其他肿瘤材料、不同免疫背景,以及不同抗原缺失来源的迁移体。研究聚焦肿瘤迁移过程中释放抗原并启动免疫的具体机制。
方法与验证
4T1静脉转移模型、皮下肿瘤后的肺转移观察及MMTV-PyMT自发模型并用;活体显微成像确认回缩纤维与迁移体。迁移体形态、标志物及其他囊泡标志物用于表征。T细胞缺陷、CD8耗竭、LLC-OVA/OT-I、骨髓B2m缺失及Batf3缺失用于验证宿主免疫参与。蛋白组与基因组交叉筛选后,以候选抗原免疫和抗原缺失功能实验补强。人体部分包括3例未经治疗OSCC、乳腺癌及肺癌血浆富集物、TCGA/GTEx相关分析。
核心证据
| 主张或结果 | 条件、数量与解释 | 来源 | 依据与核对 |
|---|---|---|---|
| Tspan4与4T1转移相关 | 免疫完整鼠图1b每组18;KO升高、OE降低转移负荷 | 主PDF第2–3页,图1a–c | 正文、图、MOESM5表1b计数一致;生存组n另为13/12/9 |
| 自发模型同向 | PyMT背景Tspan4 WT 21、KO 22只;KO肺结节更多 | 第2–3页,图1d–f | 主图及MOESM5核对;全身缺失不是癌细胞特异缺失 |
| 血管内产生迁移体 | 活体图像见细胞相关纤维与囊泡 | 第2–3页,图1i、l–n | 原图已看;视频1归档未播放;该处观测单位为细胞 |
| 补充迁移体可救援 | 图2f四组n=16/16/17/6;多为挑战前补充 | 第2、4–5页,图2e–f | 图注与MOESM6数值区一致 |
| 血源迁移体与皮下模型 | 图2k每组10;图2n PBS 18、迁移体20,结节数减少 | 第4–5页,图2j–n | 原图、图注、源表;图2m标s.c.,不采用正文orthotopic的概称 |
| 其他材料比较有条件限制 | 等蛋白量;迁移体相对PBS显著,其余并非统一有效 | 第18–19页,扩展图1d–f | 原图及图注;比较限于所选材料及等蛋白量条件 |
| 裸鼠中保护失效 | 图3b OE/WT各11,KO与KO+Mig各12;KO+Mig对KO P=0.5798,OE对WT P=0.1403 | 第5–6页,图3a–b | 原图与MOESM7 H8/J8/L8及样本数;不把不显著写成等效或OE显著促转移 |
| CD8参与 | CD8耗竭后迁移体保护不再出现;三组各10只 | 第5–6页,图3c–d | 原图、图注及源表 |
| APC依赖的激活 | 迁移体单独不足,加入BMDM/BMDC后初始/OT-I CD8激活 | 第20–23页,扩展图2–4;SI第2页 | 吞噬、分布、流式及门控图已查看;不直接量化细胞群必要性贡献 |
| 宿主MHC-I依赖 | WT骨髓Ctrl/Mig n=12/13,B2m缺失骨髓各11;对应组内P=0.0001/0.2969 | 第5–6页,图3e–g | MOESM7 C40:F54计数及均值一致;B2m影响不局限于APC |
| Batf3相关树突细胞作用 | 图3j四组各6;Batf3缺失削弱保护;加α-CSF1R仅趋势 | 第6–7页,图3h–j | 只有WT Ctrl,无Batf3缺失未处理组;各类APC独立贡献的估计受对照设置限制 |
| 候选抗原富集 | 蛋白组3次独立实验;BRDT与若干突变蛋白富集;候选肽实验图4e各25 | 第7–8页,图4 | 不等同于突变肽-MHC的直接免疫肽组鉴定;未重算12370行源表 |
| BRDT贡献较大 | 图5h每组15;WT迁移体对Brdt缺失来源P=0.0229;Brdt缺失来源对PBS P=0.2963 | 第8–10页,图5g–h | 原图及MOESM9 C40:E62;不声称BRDT是唯一抗原 |
| 单个突变抗原并非必需 | 图5j PBS/Sdc2缺失各10、Ddhd1缺失9;去掉单个抗原仍有抑制 | 第8–10页,图5i–j | 原图及源表;源表标题Ddhd12为拼写异常,正文与图为Ddhd1 |
| 治疗实验 | 4T1进入机体后第5/7天处理;图6b n=20/19/10 | 第10、12页,图6a–b | 早期荷瘤情境;示意时间范围14–22与图注第14天并列记录,不假设统一晚期疾病 |
| 联合PD-1解释 | 每组12;源表只列对PBS:Mig P=0.0121,PD-1 P=0.9207,联合P=0.0017 | 第10页,图6c–d;MOESM10 H27:M41 | 不把共同对照的P值当作联合对单药差异,不称已证明协同 |
| PyMT治疗终点 | PBS 15、Mig 17;图6g结节数降低P=0.029 | 第10、12页,图6e–g | 源表均值约12.27与4.76,非发生率或患者生存终点 |
| 人体候选抗原 | 3例OSCC离体培养;血浆结构为富集而非绝对纯化 | 第11–12、27页,图7a–e、扩展图8 | 未做患者治疗或抗原特异T细胞功能验证;血浆供者总数未在所读材料明确 |
| TSPAN4预后不成立为确定结论 | 生存n=535+535,log-rank P=0.65,HR=1.1,P(HR)=0.66 | 第11–12页,图7g | 与正文“十年后较好/positive prognostic”措辞有落差;无正式分段检验、风险人数表或独立验证 |
局限
作者明确指出或方法中披露
- 免疫背景和癌种可改变净效应;作者承认低免疫原性情境可能出现免疫无关的促转移效应(第13页)。
- 患者血浆经阴性选择富集,所得结构中仍可能包含正常细胞来源成分(第12页)。
- 未事先进行样本量计算、未对结局采集和分析设盲;假设数据正态但未正式检验。动物随机分组,未排除数据(第17、29页)。
- L.Y.为Migrasome Therapeutics科学创始人,其他作者声明无利益冲突(第17页)。
AI分析与理由
- 静脉挑战覆盖转移后段,自然侵袭和入血过程仍待其他模型研究;PyMT全身Tspan4缺失也无法完全分离癌细胞和宿主贡献。
- 多个两两t检验、偏态/零膨胀的转移负荷和跨实验批次合并值得进一步审视;本轮未重建统计模型,统计实现仍列为待核项。
- 裸鼠图3b中OE与WT的比较未达显著性阈值;图3j加入巨噬细胞清除后呈趋势,各类细胞的独立必要性仍需进一步验证。
- 肿瘤基因全敲除可能同时改变内在生物学;裸鼠对照和迁移体补充增强免疫解释,但不等同于仅删除某个突变表位。
- 图6d没有联合对迁移体单药或交互检验;图7g全程不显著。正文强措辞不作为确定结论沿用。
- 人体OSCC数量小,血浆样本仅形态/标志物层面;无临床疗效、长期安全性或可靠预后预测验证。
待核对与后续阅读
完整覆盖、原图标注差异、源表定位见coverage.md及supplementary/data-check.md。2份视频未播放,原始测序/蛋白组数据库未下载重算,完整风险集和分段生存检验未取得。三个延伸题录仅核对出版社参考文献列表,未重读全文。