研究问题与核心发现
肠道菌群与免疫检查点阻断治疗(ICB)的疗效有关,但连接肠道变化与远端肿瘤免疫的代谢环节仍不完整。这篇研究集中于胆汁酸的组成、回肠MAdCAM-1和肿瘤T细胞状态,并考察常规检验指标γ-谷氨酰转移酶(γGT)与患者结局的关系。
在小鼠中,抗生素或Enterocloster clostridioformis相关菌群失调伴随胆汁酸谱改变;补充甘氨脱氧胆酸(GDCA)或使用回肠FXR激动剂fexaramine,可在相应实验条件下改善ICB反应。患者数据则显示,γGT较高与牛磺酸结合型胆汁酸增多、可溶性MAdCAM-1降低及较差预后相关。论文2026年7月29日在线发表,收于8月10日期刊卷期(PDF第2–3、18页)。
研究设计
| 证据层级 | 模型与资料 | 主要读出 |
|---|---|---|
| 动物干预 | MCA205纤维肉瘤、RET来源黑色素瘤的皮下移植模型;抗生素、细菌干预、胆管结扎、胆汁酸与fexaramine | 肿瘤生长、不同组织的胆汁酸组成、T细胞表型 |
| 机制实验 | 内皮细胞胆汁酸受体敲除、Madcam1缺失小鼠、淋巴结细胞示踪、流式及单细胞测序 | FXR与Madcam1表达、肠道来源T细胞迁移、肿瘤免疫状态 |
| 患者关联 | ONCOBIOTICS代谢组与菌群资料;六个生存分析队列 | 胆汁酸分型、γGT、PFS及OS |
| FMT相关分析 | MIMic、FMT-LUMINATE及随机对照TACITO的样本 | 粪菌移植前后胆汁酸随时间的变化 |
依据:第4–16、25–36页。不同分析使用的样本集并不相同,人数在下文分别列出。
菌群失调改变胆汁酸组成
胆汁酸先由宿主合成,再受到细菌酶的转化。DCA是脱氧胆酸,GDCA和TDCA分别为其甘氨酸、牛磺酸结合形式;TCDCA是牛磺鹅去氧胆酸。鼠胆酸MCA及其衍生物则是本研究中需要区分人鼠的成分。
作者在两个动物设施检测血浆、肝脏、回肠和结肠。抗生素处理后,多种次级胆汁酸减少,TCDCA和牛磺酸结合型鼠胆酸等成分增加;E. clostridioformis干预呈现其中部分变化。在肿瘤组织中,牛磺酸结合型鼠胆酸、TCA与TUDCA所占比例升高;TCDCA的该项比较未达显著(图1G,P=0.105)。图1多个面板测量的是各成分在胆汁酸中的占比(第4–5页)。
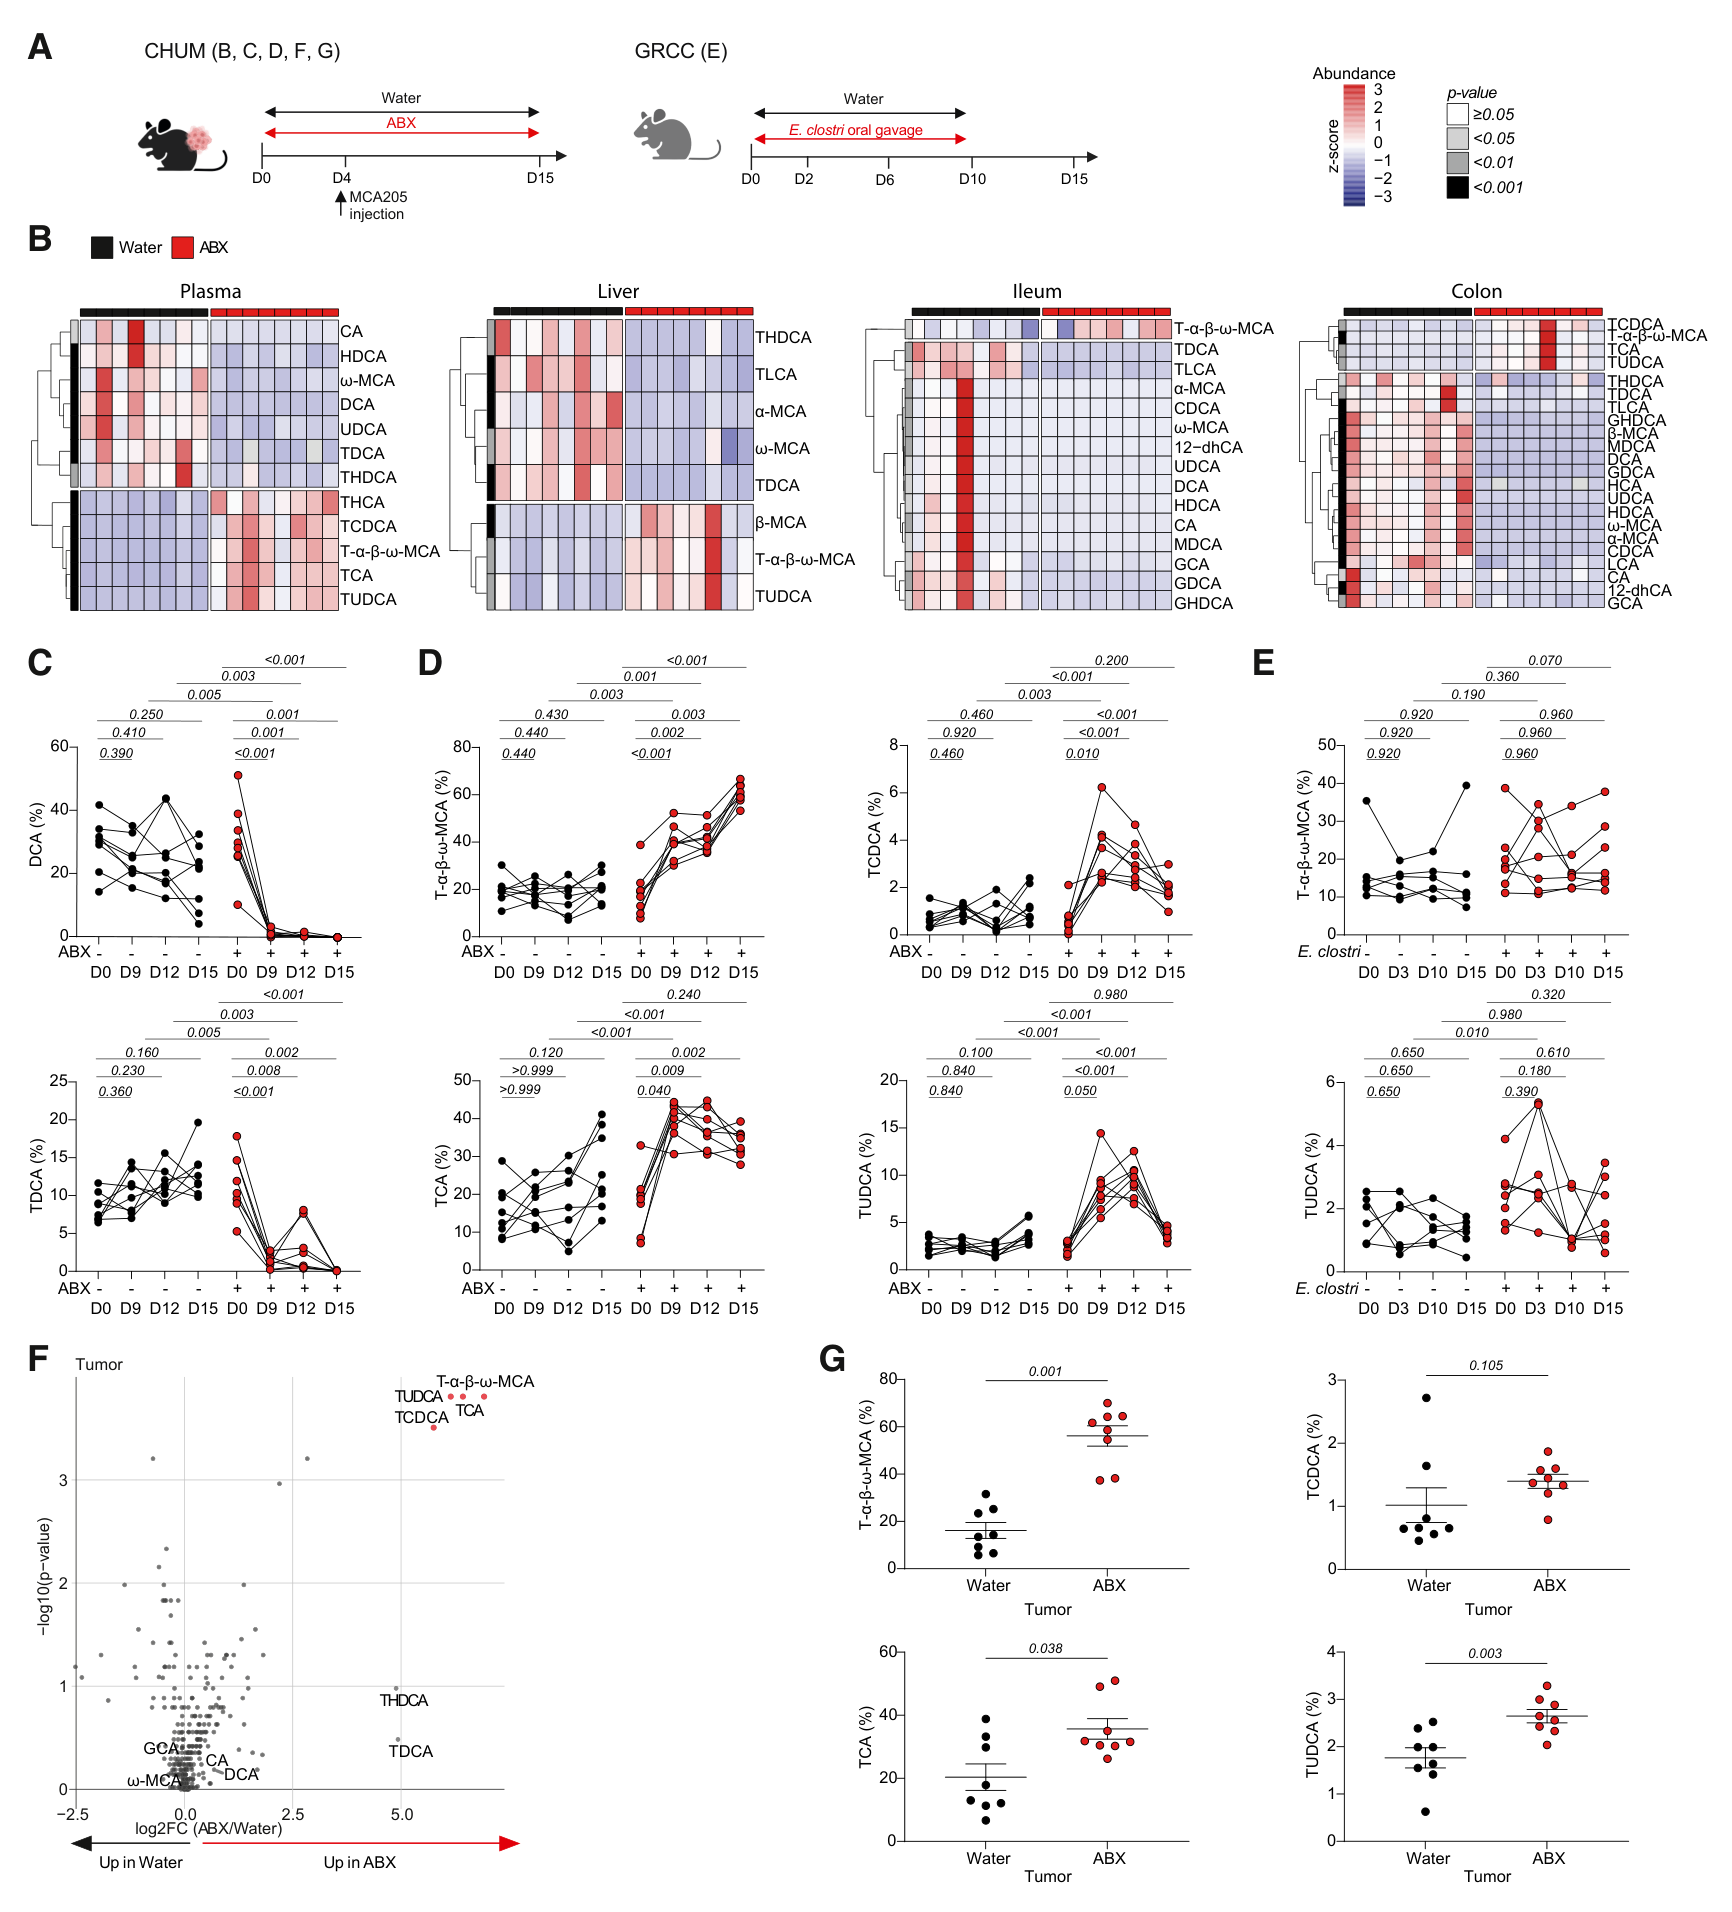
图1 · PDF第5页。血浆、肝肠组织与皮下肿瘤中的胆汁酸变化。
GDCA改善小鼠免疫治疗反应
在MCA205模型中,E. clostridioformis削弱抗PD-1的抑瘤作用,GDCA可改善这一条件下的治疗反应;同一实验中LCA与UDCA未呈现相同效果。在RET来源黑色素瘤的抗PD-1联合抗CTLA-4实验中,GDCA和UDCA均显示抑瘤作用,LCA未显示。该模型中细菌干预造成疗效下降的单时点比较为趋势(图2D,P=0.061)。
GDCA和TDCA干预也改变了循环胆汁酸谱,包括DCA相关成分的增加。不同胆汁酸、肿瘤模型和观察时间的结果有差别,本文的有效干预证据具体落在这些实验条件上(第6–7页)。
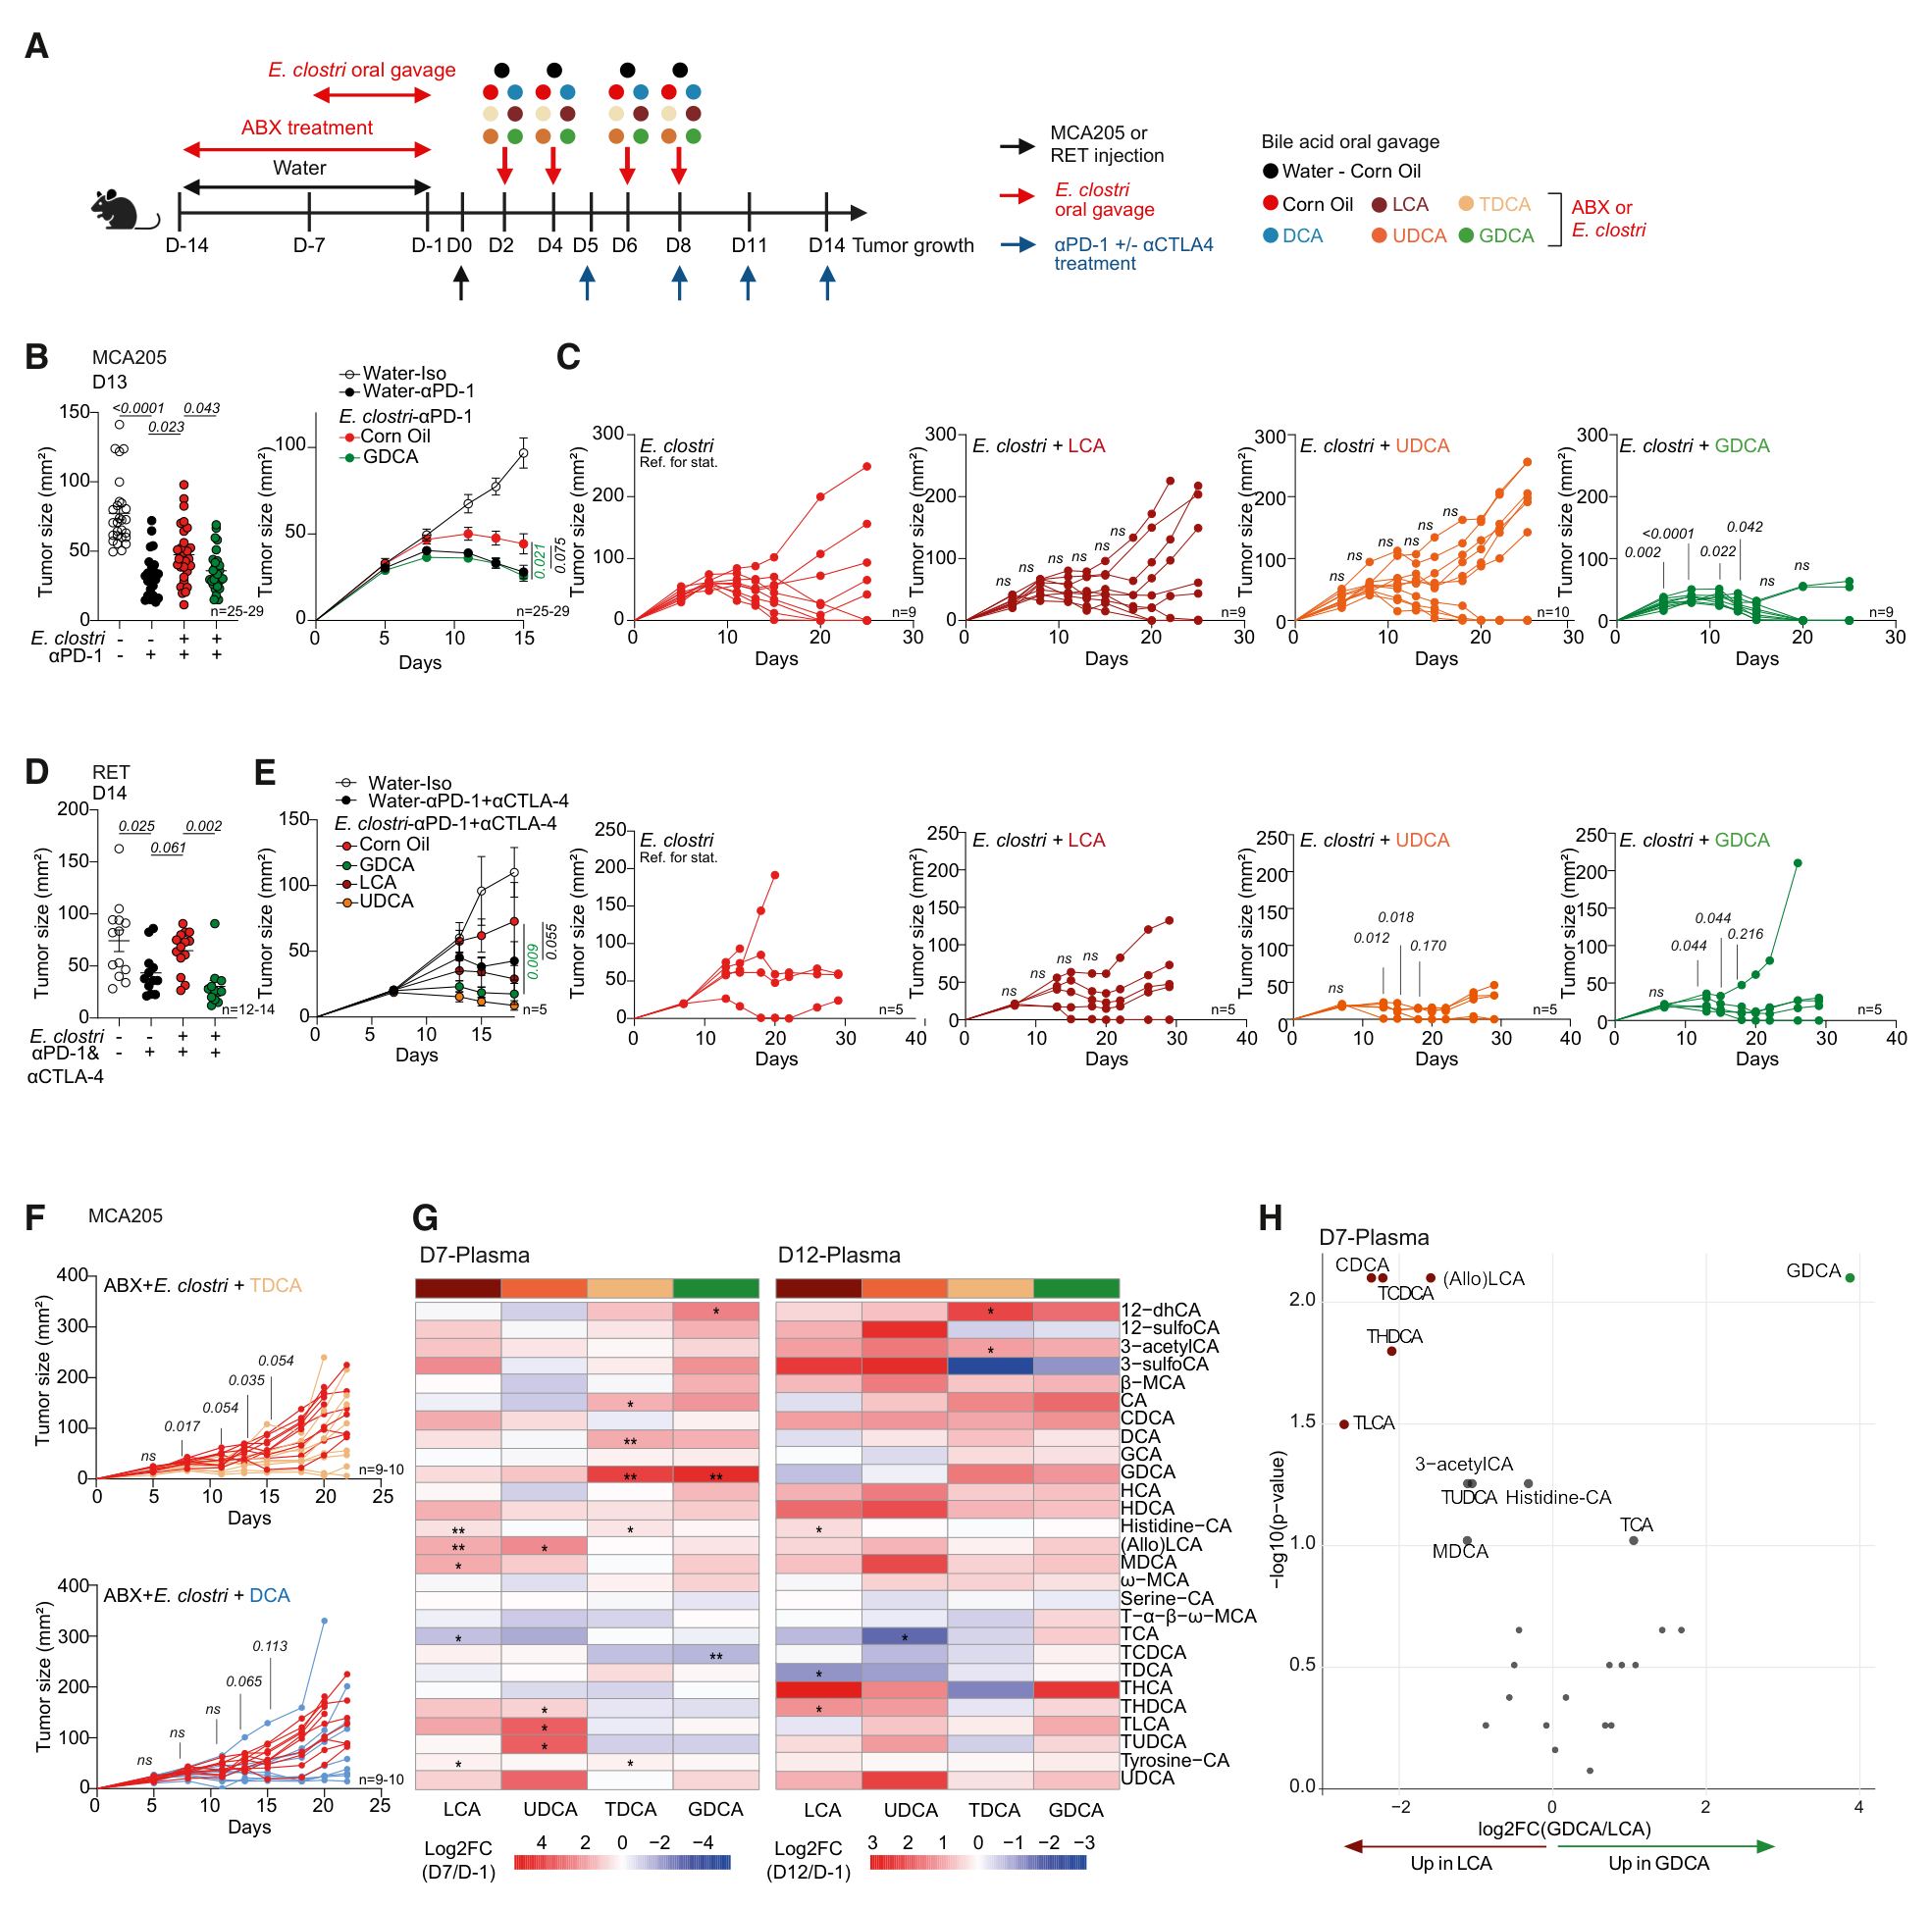
图2 · PDF第7页。MCA205与RET模型的肿瘤生长及血浆代谢组。
胆管结扎与FXR干预提供功能证据
胆管结扎造成明显胆汁淤积及肝损伤,同时改变胆汁酸组成;在这一模型中,抗PD-1的抑瘤作用消失。另一组实验中,回肠FXR激动剂fexaramine改善抗生素与细菌干预背景下的肿瘤控制(图3G,肿瘤生长比较P<0.0001),并改变部分肿瘤T细胞表型(第6、8页)。
离体实验进一步显示,TCDCA与T-β-MCA在测试浓度下减少活T细胞及活的Ki67阳性CD8 T细胞数量,GDCA的结果不同。这里的实验点是培养孔,属于短期细胞暴露读出。图3K右图纵轴为绝对细胞数,本文据此描述;其图注写作百分比,二者存在不一致。
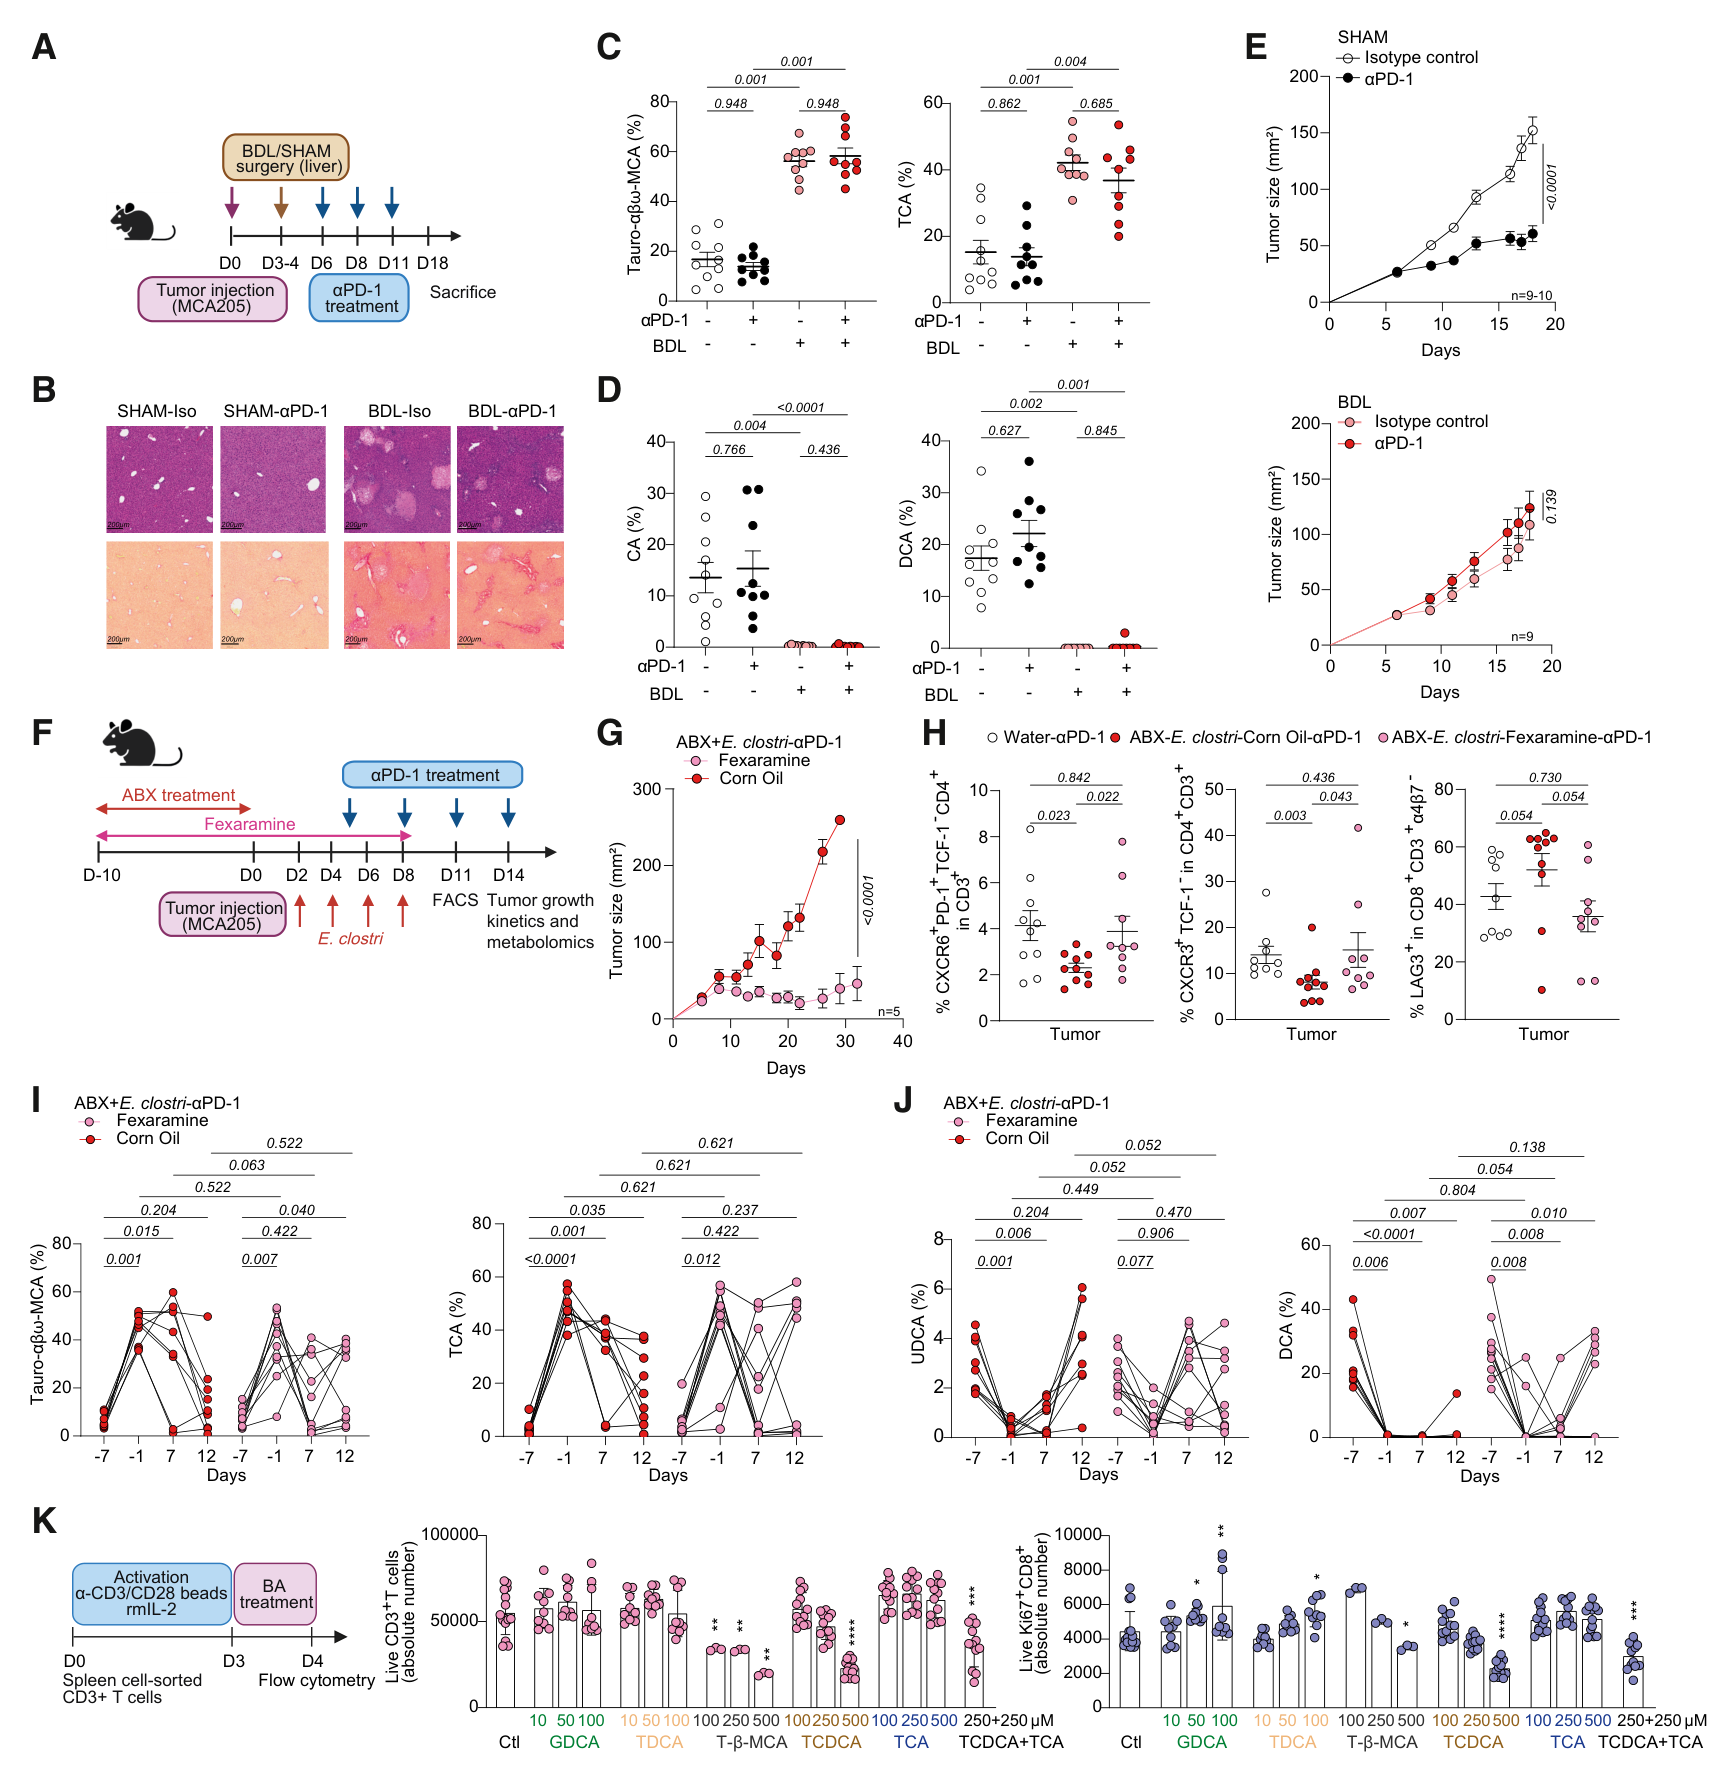
图3 · PDF第8页。胆管结扎、fexaramine干预及离体T细胞实验。
GDCA、MAdCAM-1与肿瘤T细胞状态
GDCA处理后,肿瘤内牛磺酸结合型鼠胆酸减少,部分CD4 T细胞的LAG-3表达降低。肿瘤内GDCA本身的升高未达显著(图4A,P=0.144),因此作者进一步考察其在肠道端的作用。单细胞分析显示部分耗竭相关转录本降低;作者将增殖中的T细胞群与可能的前体耗竭状态联系起来(第9–11页)。
在TNF-α刺激的内皮细胞系中,GDCA增强Madcam1表达,敲除FXR编码基因Nr1h4后该作用减弱。回肠组织也观察到Madcam1表达恢复。GDCA联合抗PD-1条件下,野生型与Madcam1缺失小鼠的肿瘤生长不同,支持MAdCAM-1参与这一效应。
淋巴结示踪提供迁移方面的线索:与LCA相比,GDCA组到达肿瘤引流淋巴结的标记α4β7阳性CD4 T细胞和Treg较少;与玉米油对照的两项比较未达显著(图4P,P=0.122、0.179)。
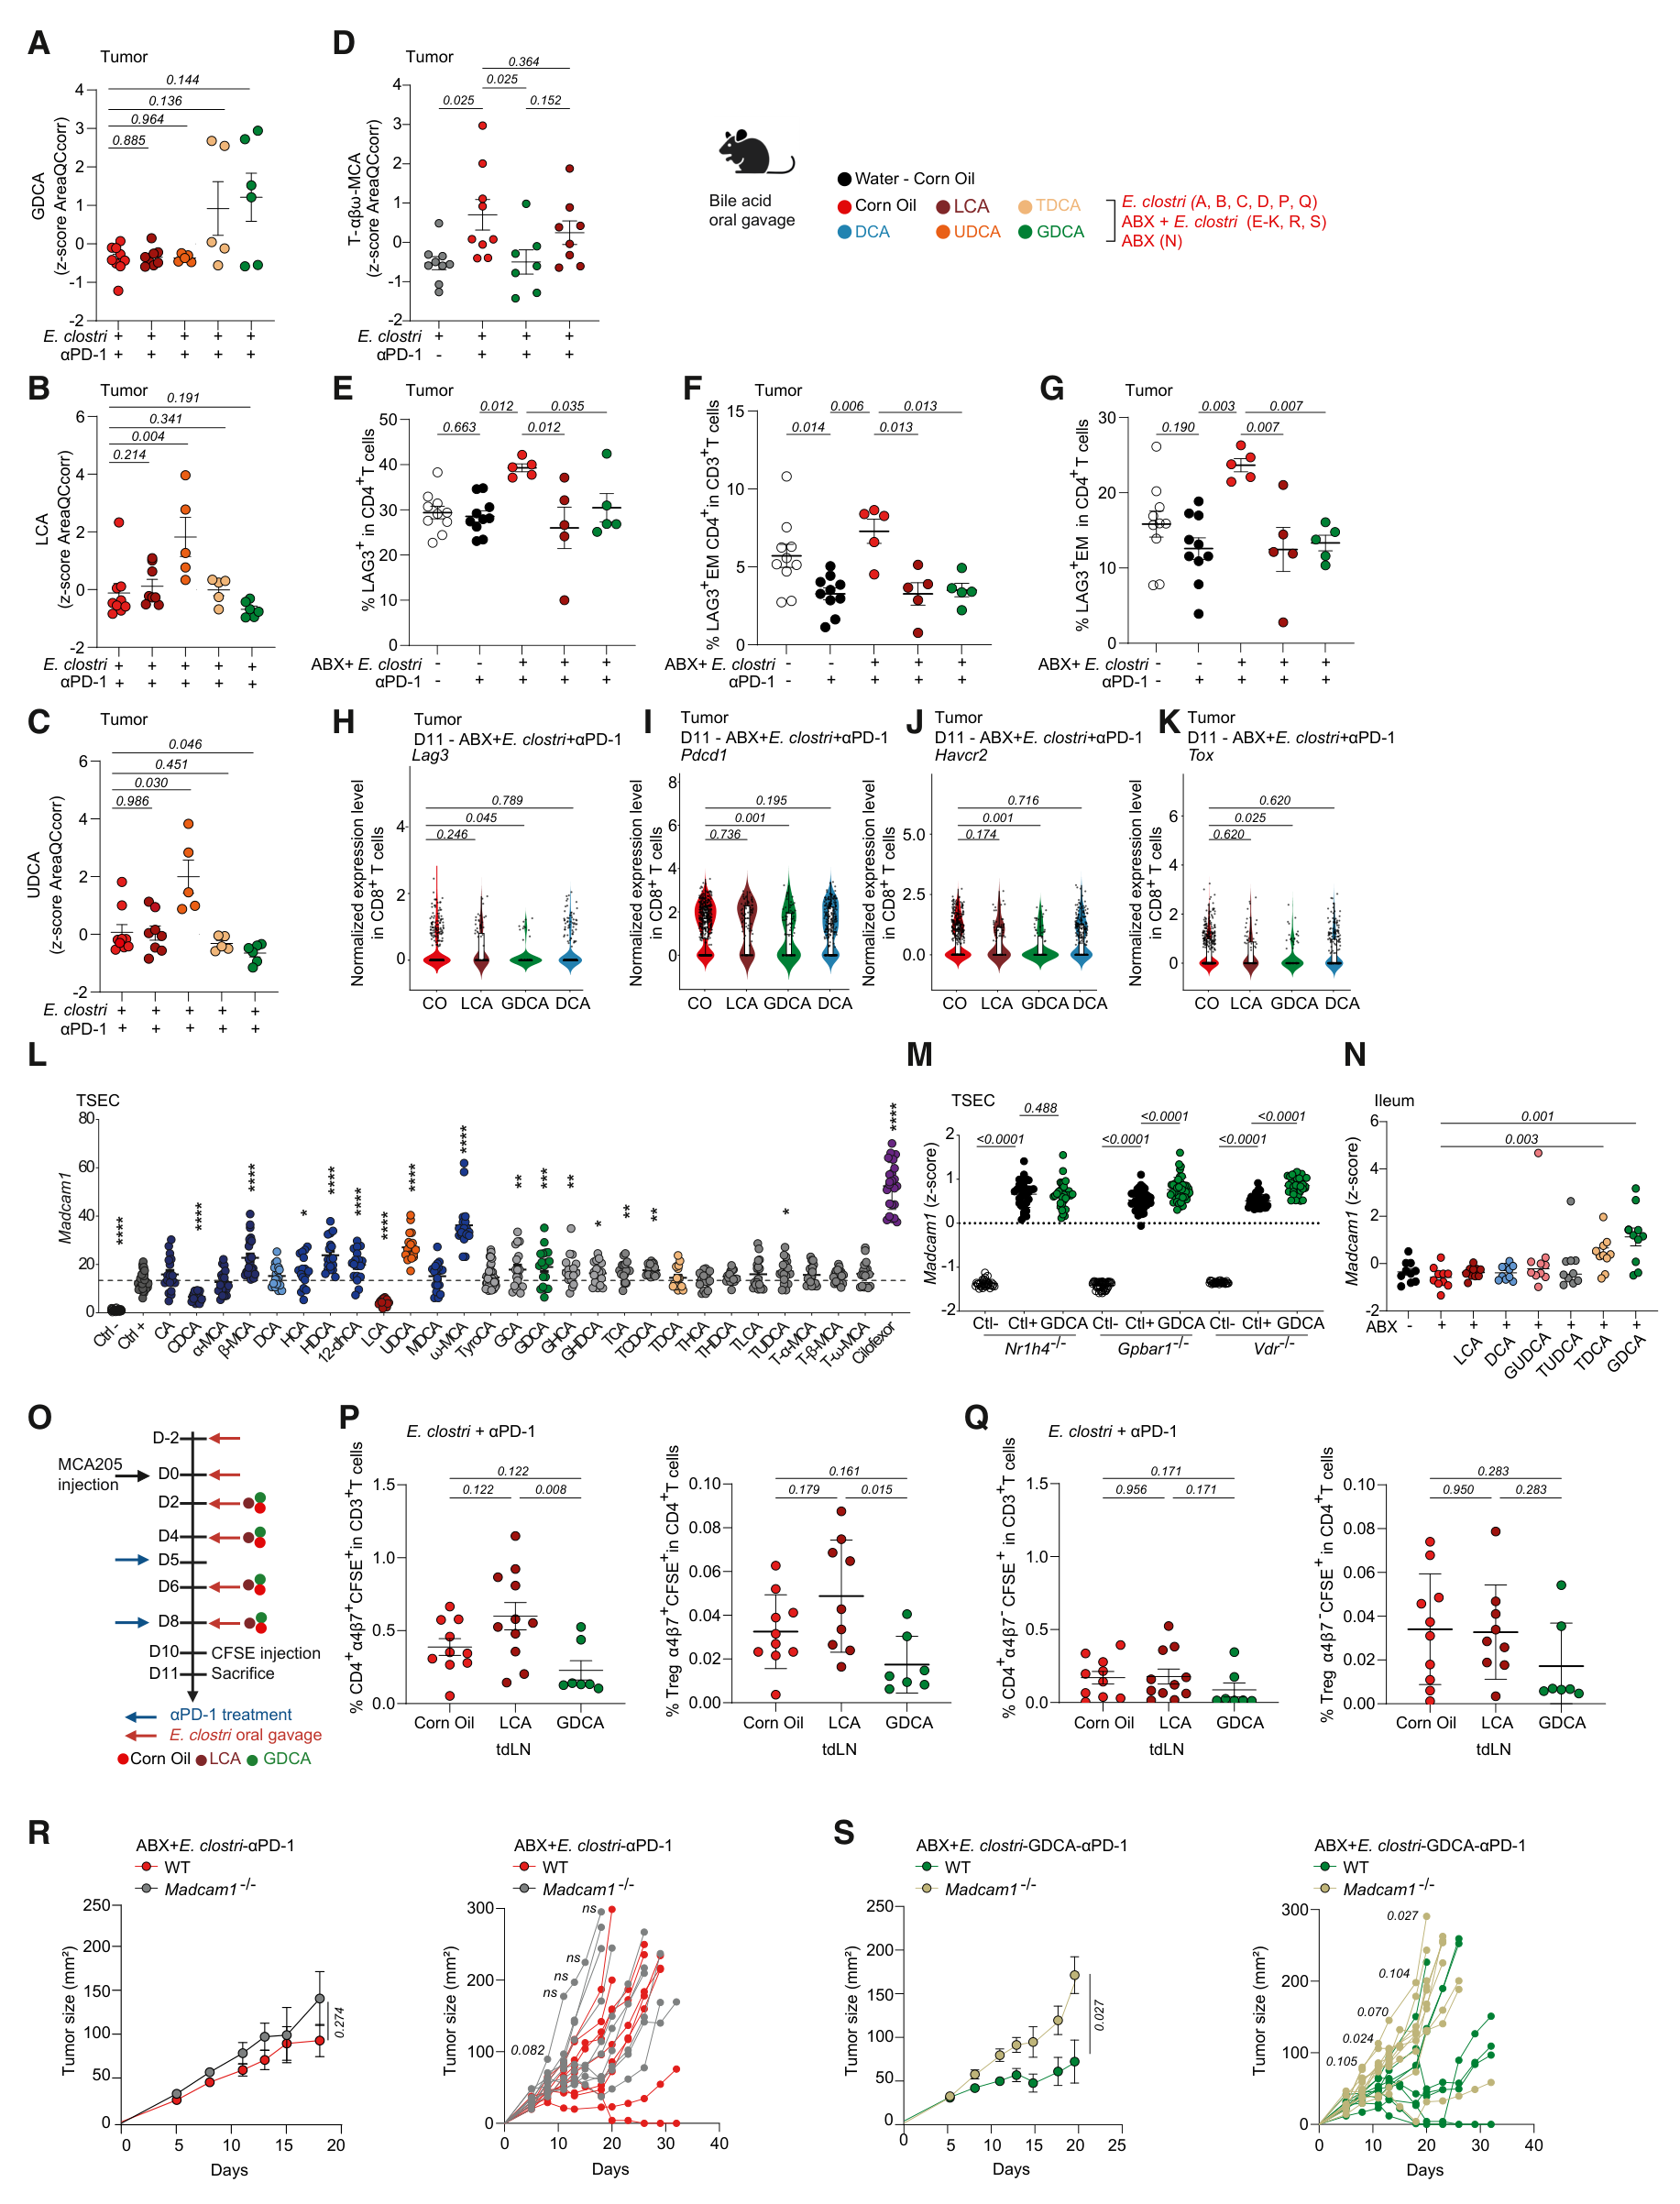
图4 · PDF第9页,图注续第10页。肿瘤胆汁酸、T细胞状态、内皮细胞及迁移实验。
患者中的胆汁酸谱与生存分型
ONCOBIOTICS的代谢分析包含133名患者的138份样本。近期使用抗生素者的UDCA占比较低、TCDCA占比较高;不同停药时间窗的结果并不一致。61名具有配对粪便和血浆资料的患者中,DCA占比与S-score呈弱正相关,牛磺酸结合型胆汁酸占比与S-score呈弱负相关。该评分较低对应较不利的菌群状态(图5F,r分别为0.27、−0.30;第11–12页)。
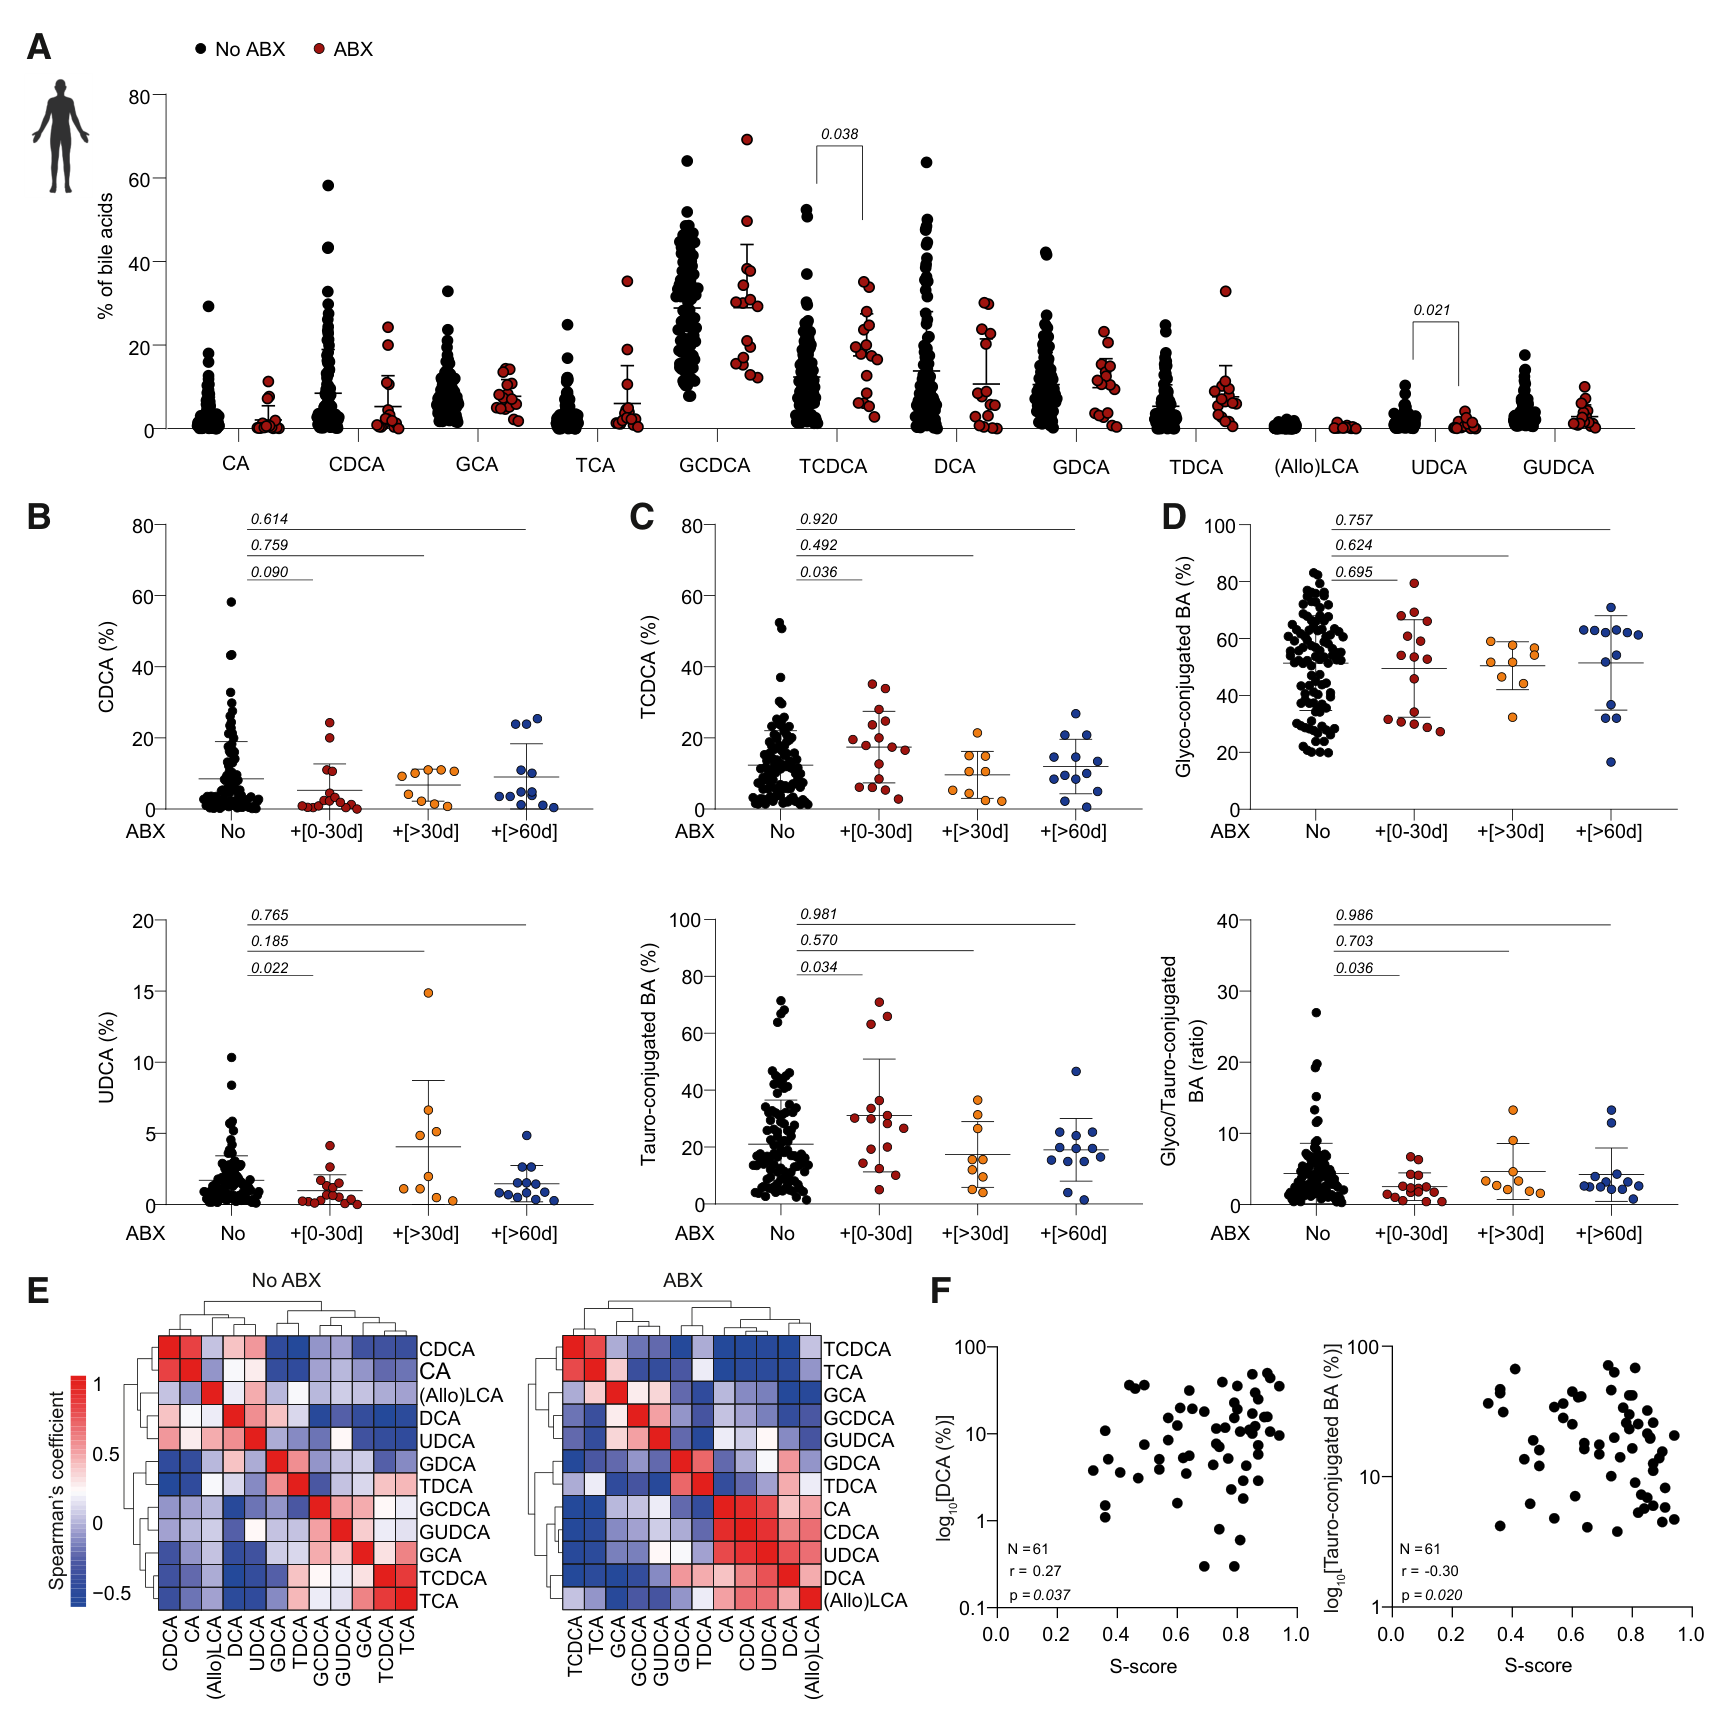
图5 · PDF第12页。各胆汁酸占比及其与菌群评分的关系。
对111名患者治疗前至治疗后42天内的胆汁酸组成进行无监督聚类,得到未结合型、甘氨酸结合型和牛磺酸结合型成分相对富集的三类。牛磺酸结合型富集组的总生存曲线较低,但三组总体比较P=0.08;图中同时给出部分两两比较结果。这一分型仍属于探索性观察(第11、13页)。
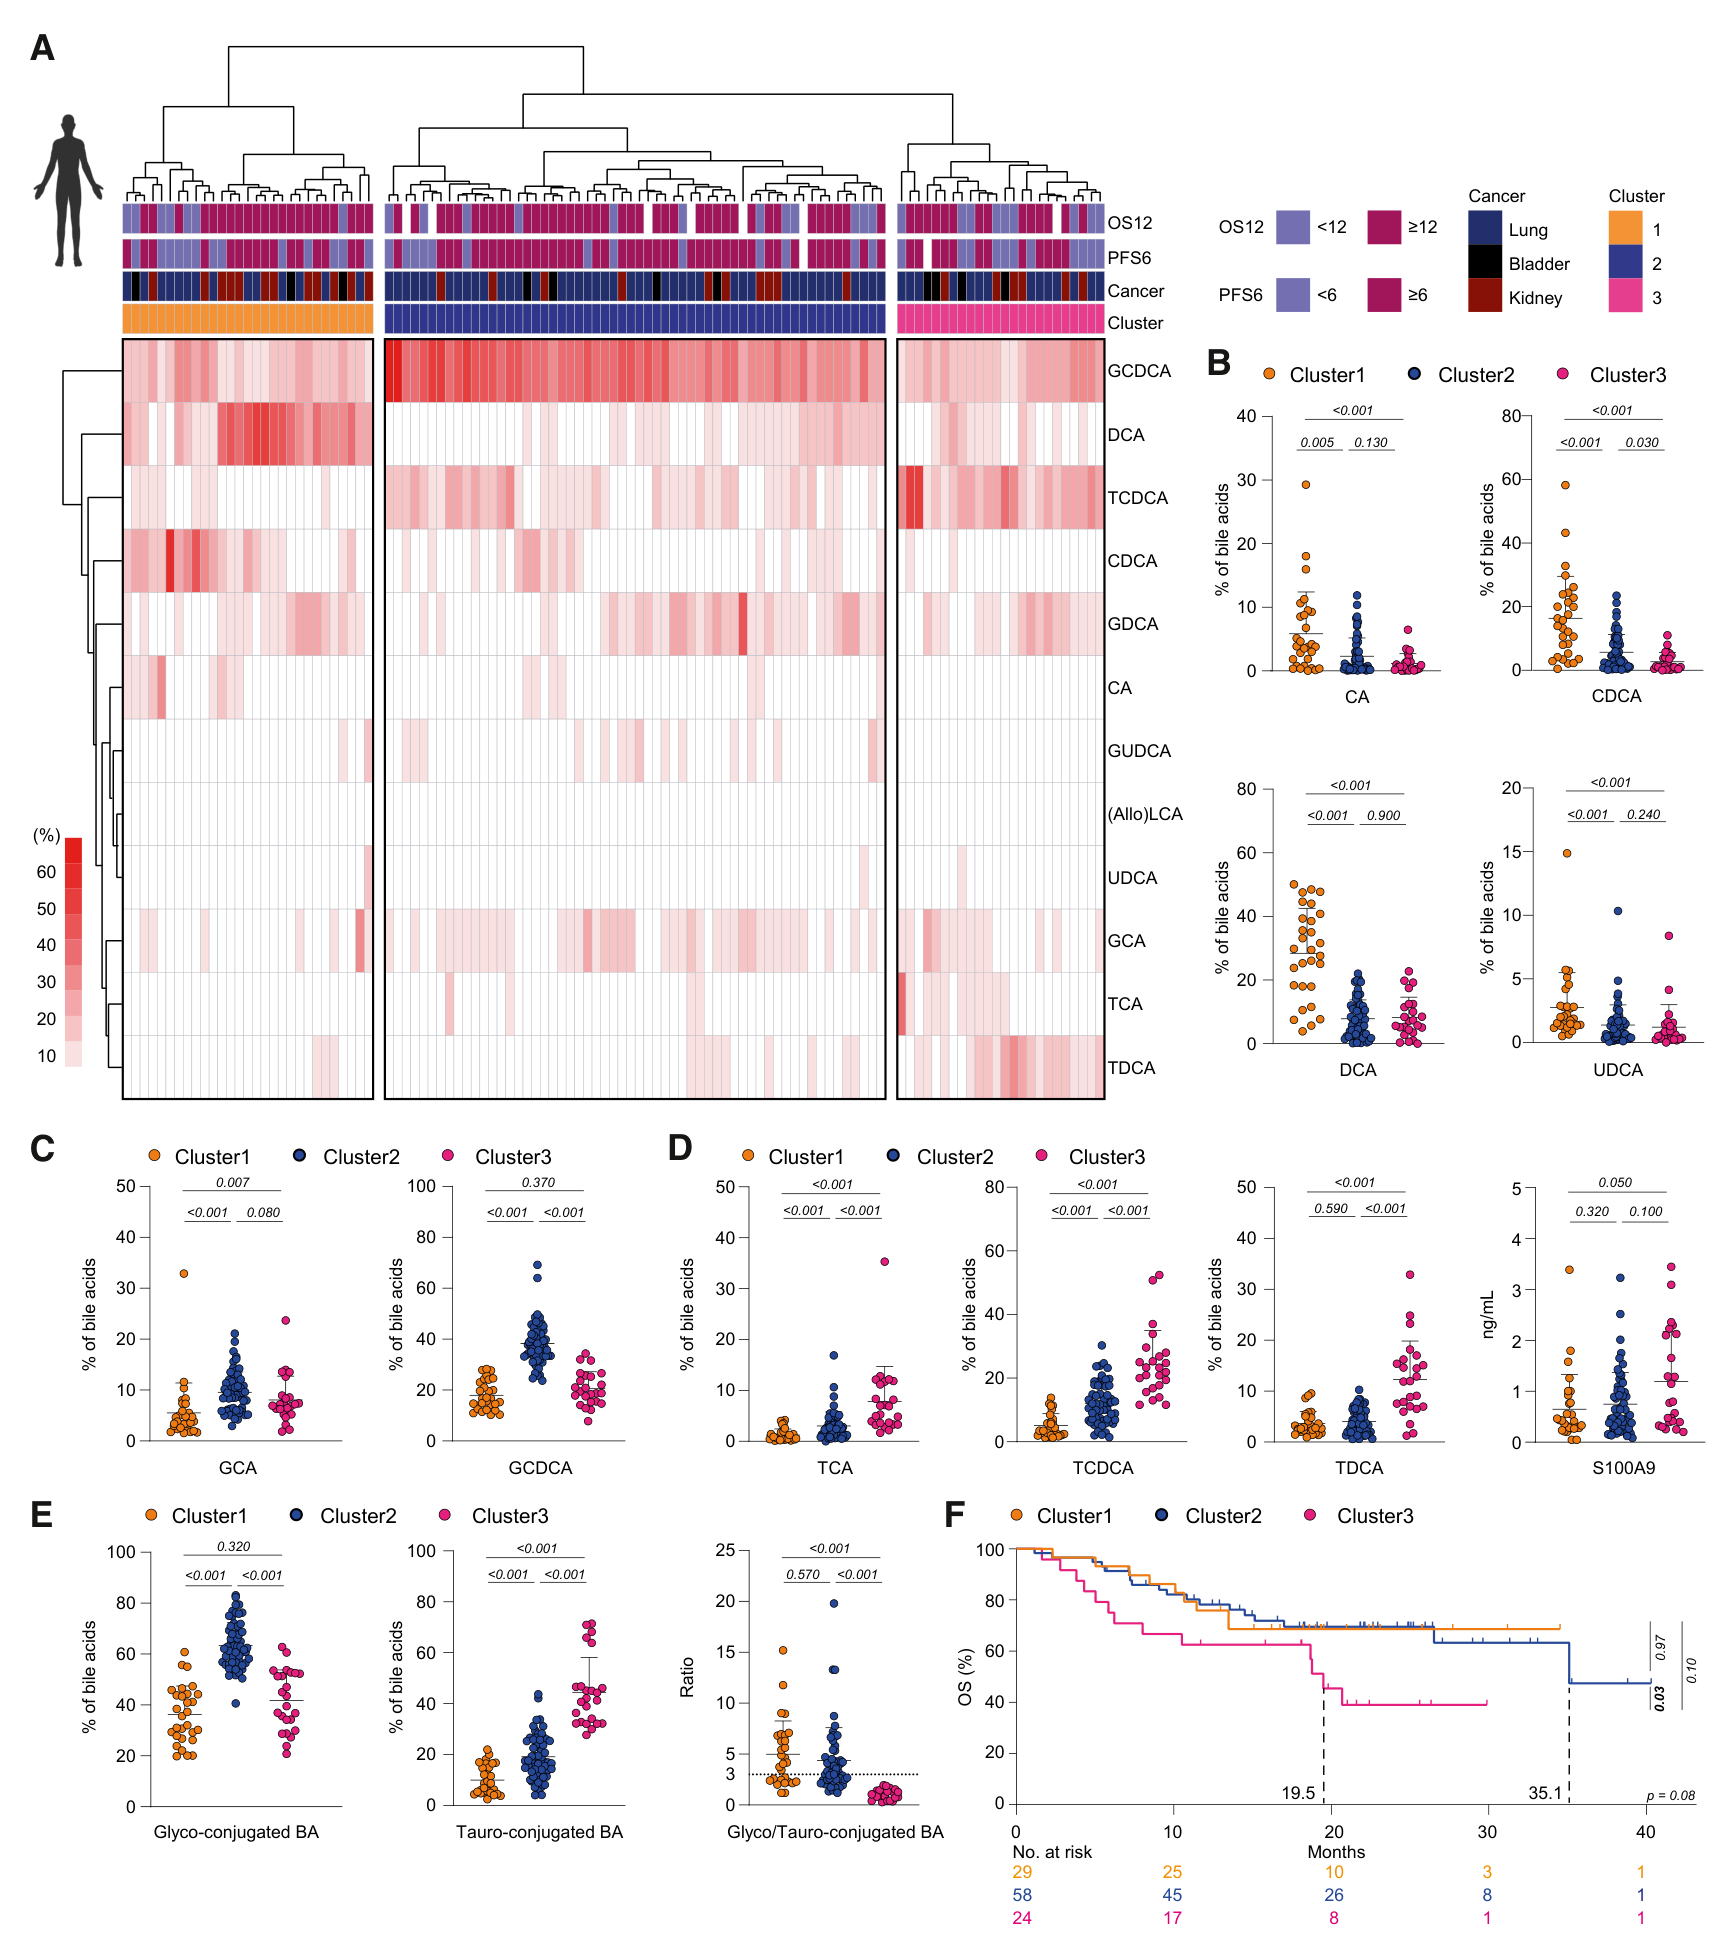
图6 · PDF第13页。111名患者的聚类、代谢差异及OS曲线。
γGT升高与较差预后相关
作者以γGT达到正常上限的两倍(≥2 ULN)划分高值组。图7注释列出的正常上限为男性45 U/L、女性35 U/L;按两倍上限换算,对应90和70 U/L。这里沿用论文的研究口径。
六个生存分析队列共599人:ONCOBIOTICS 111、PREMIS 185、G2R 100、MEDITREME 54、METIMMOX 38、AtezoTRIBE 111。其中AtezoTRIBE包含36名未加入ICB的对照组患者与75名ICB组患者(图7A、F、G)。
正文报告的多变量分析中,γGT与PFS的关联在ONCOBIOTICS、G2R及MEDITREME达到显著,与OS的关联在PREMIS、MEDITREME及AtezoTRIBE达到显著。各队列的癌种、治疗及显著终点不同;独立补表S6尚未取得,以下保留正文结果,不补填未核实的调整后HR(第12–14页)。
| 多变量终点 | 正文列出的队列及P值 |
|---|---|
| PFS | ONCOBIOTICS 0.024;G2R 0.015;MEDITREME 0.013 |
| OS | PREMIS 0.014;MEDITREME 0.048;AtezoTRIBE 0.039 |
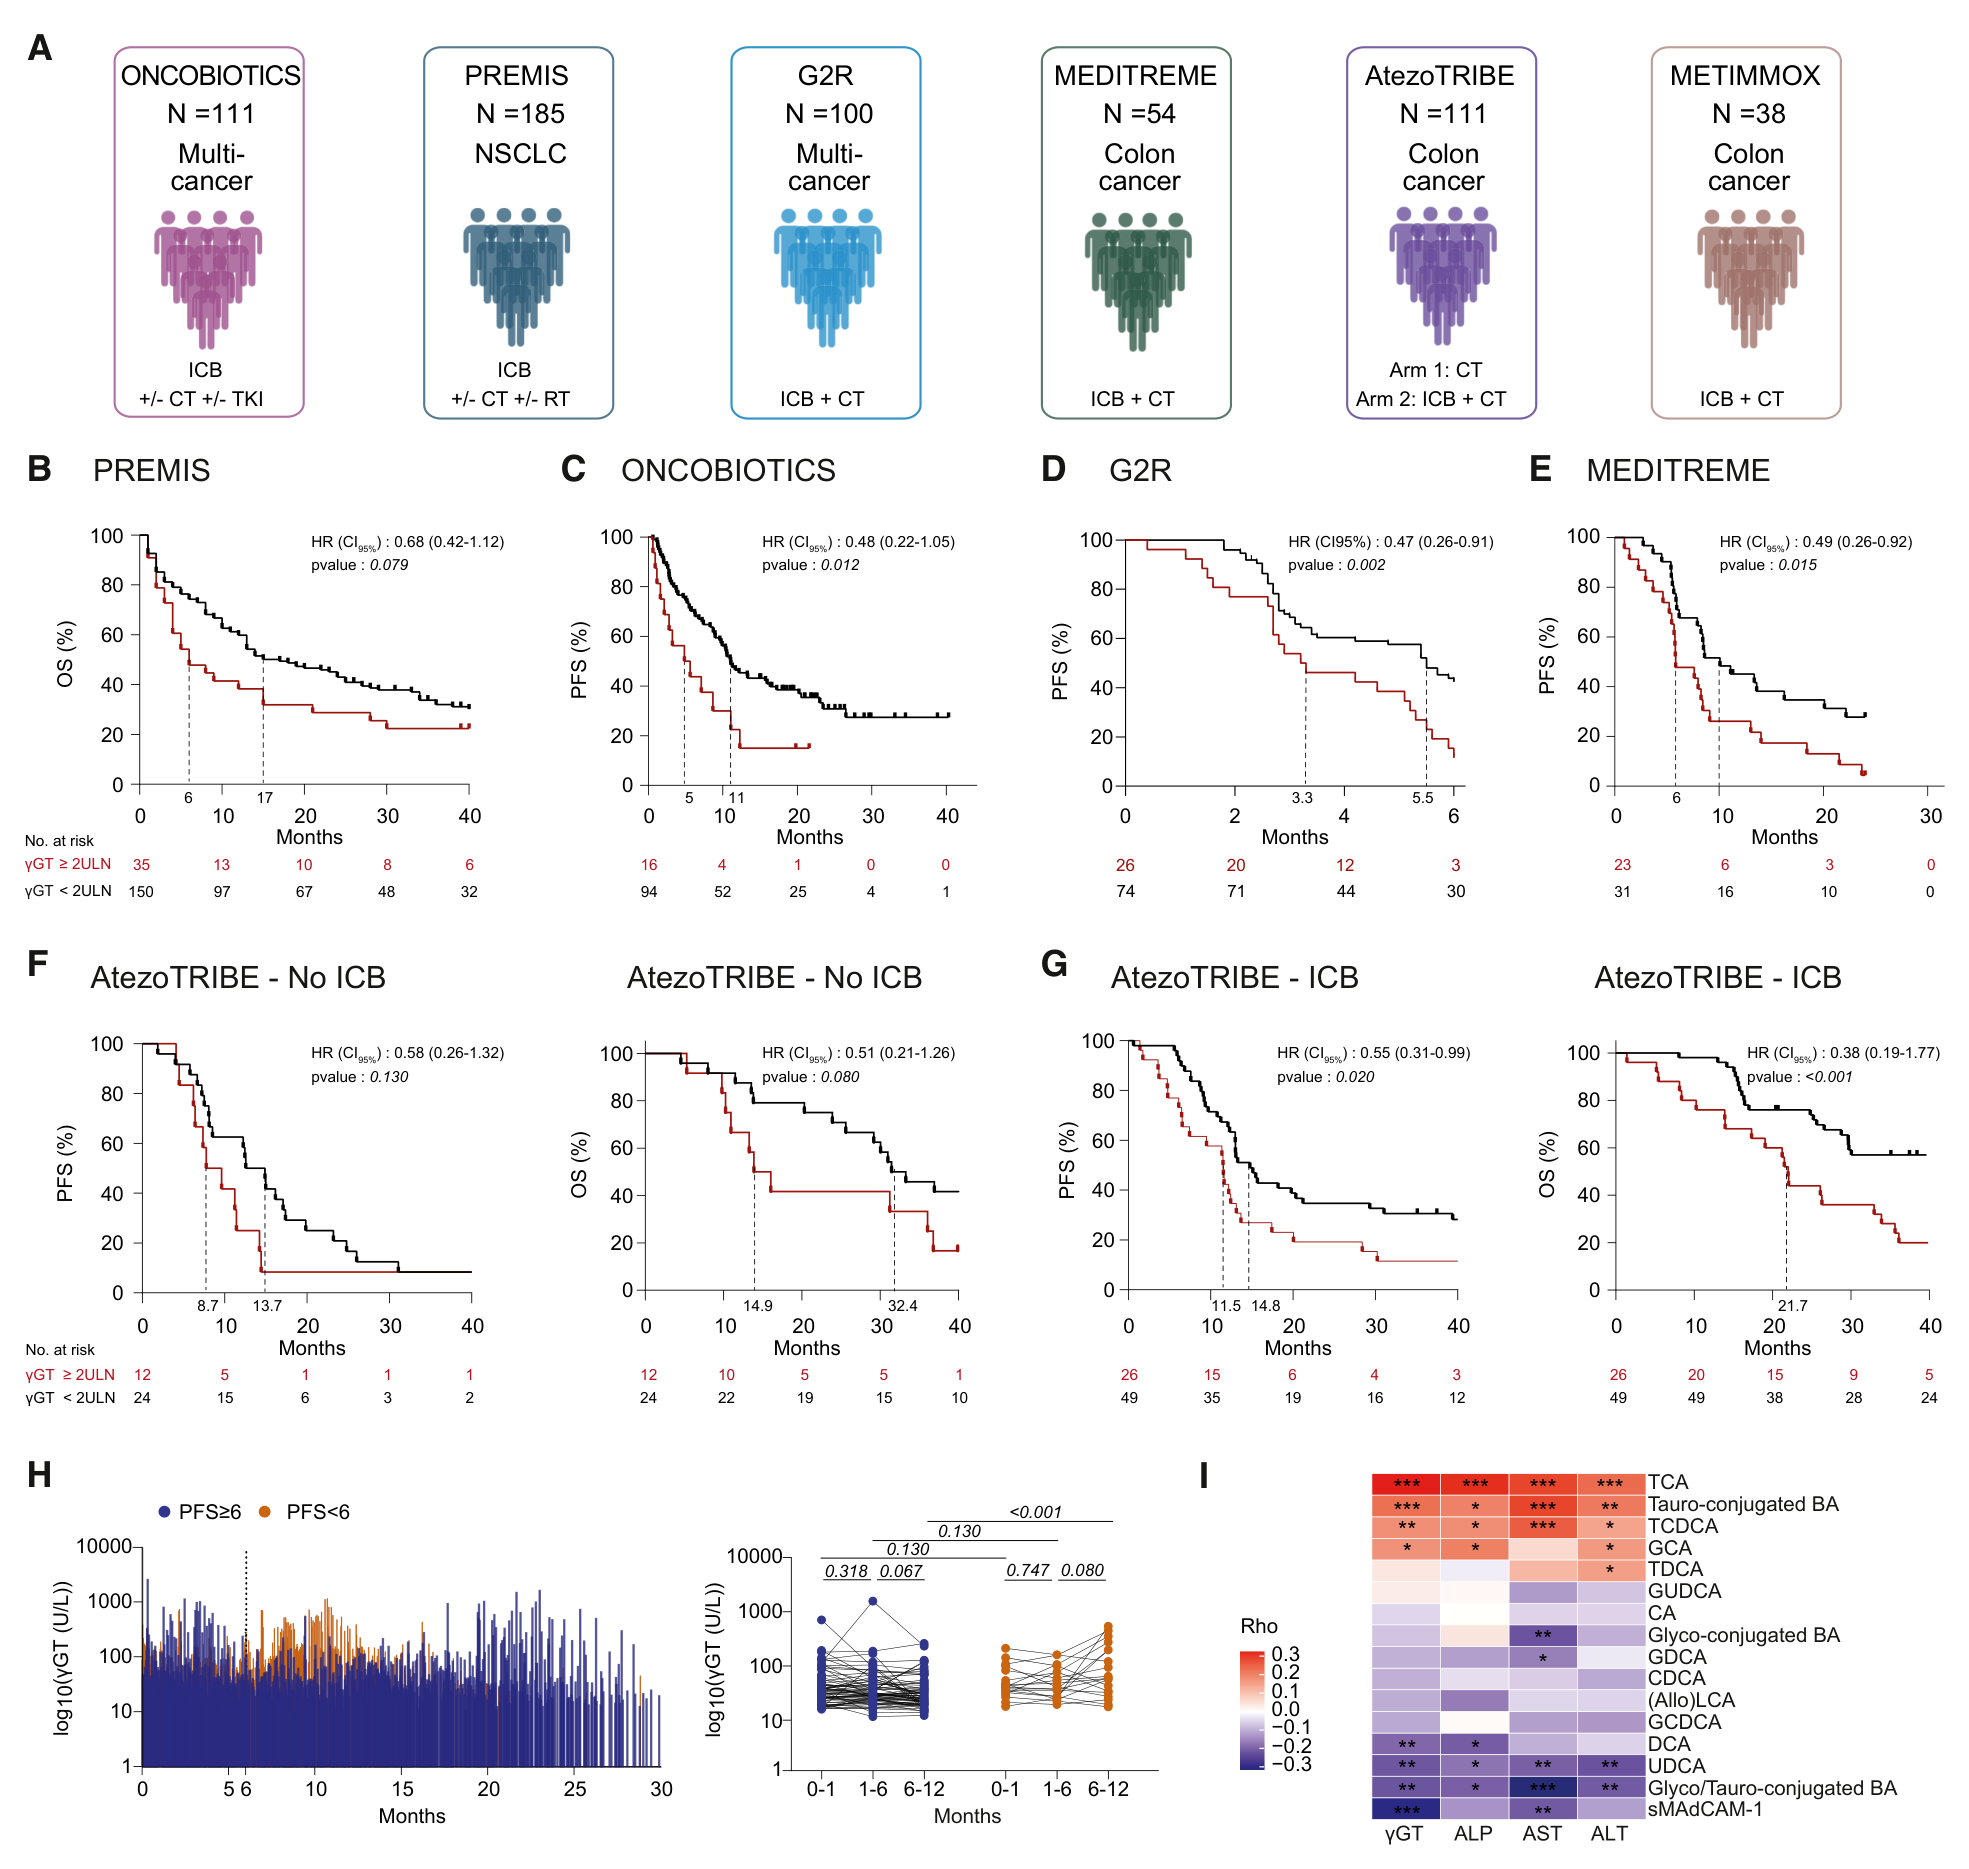
图7 · PDF第14页。主图为未调整生存分析,上表来自正文的多变量结果。图7G的OS置信区间标注与P值有待核实,保留原图,详见文末。
FMT后的胆汁酸变化
γGT较高还与不利菌群、炎症相关指标及较低可溶性MAdCAM-1相关。其中γGT与可溶性MAdCAM-1的相关系数约为−0.2,关联强度较弱(图8E)。
MIMic与FMT-LUMINATE合并分析使用32人的血浆及34人的粪便资料。血浆TCDCA在应答者中的随时间变化达到显著(P=0.023),非应答者未达显著(P=0.980);这是各组内部的时间效应。粪便TCDCA在非应答者中随时间增加。
TACITO是FMT与安慰剂随机比较、联合帕博利珠单抗和阿昔替尼的肾癌研究,本篇使用45人的相关代谢资料。FMT组TCDCA、TCA随时间呈下降相关,安慰剂组未见相同结果;图8H–I采用各组内Spearman相关。上述代谢变化与治疗反应的联系,为后续检验代谢通路的临床作用提供依据(第15–16、27、30页)。
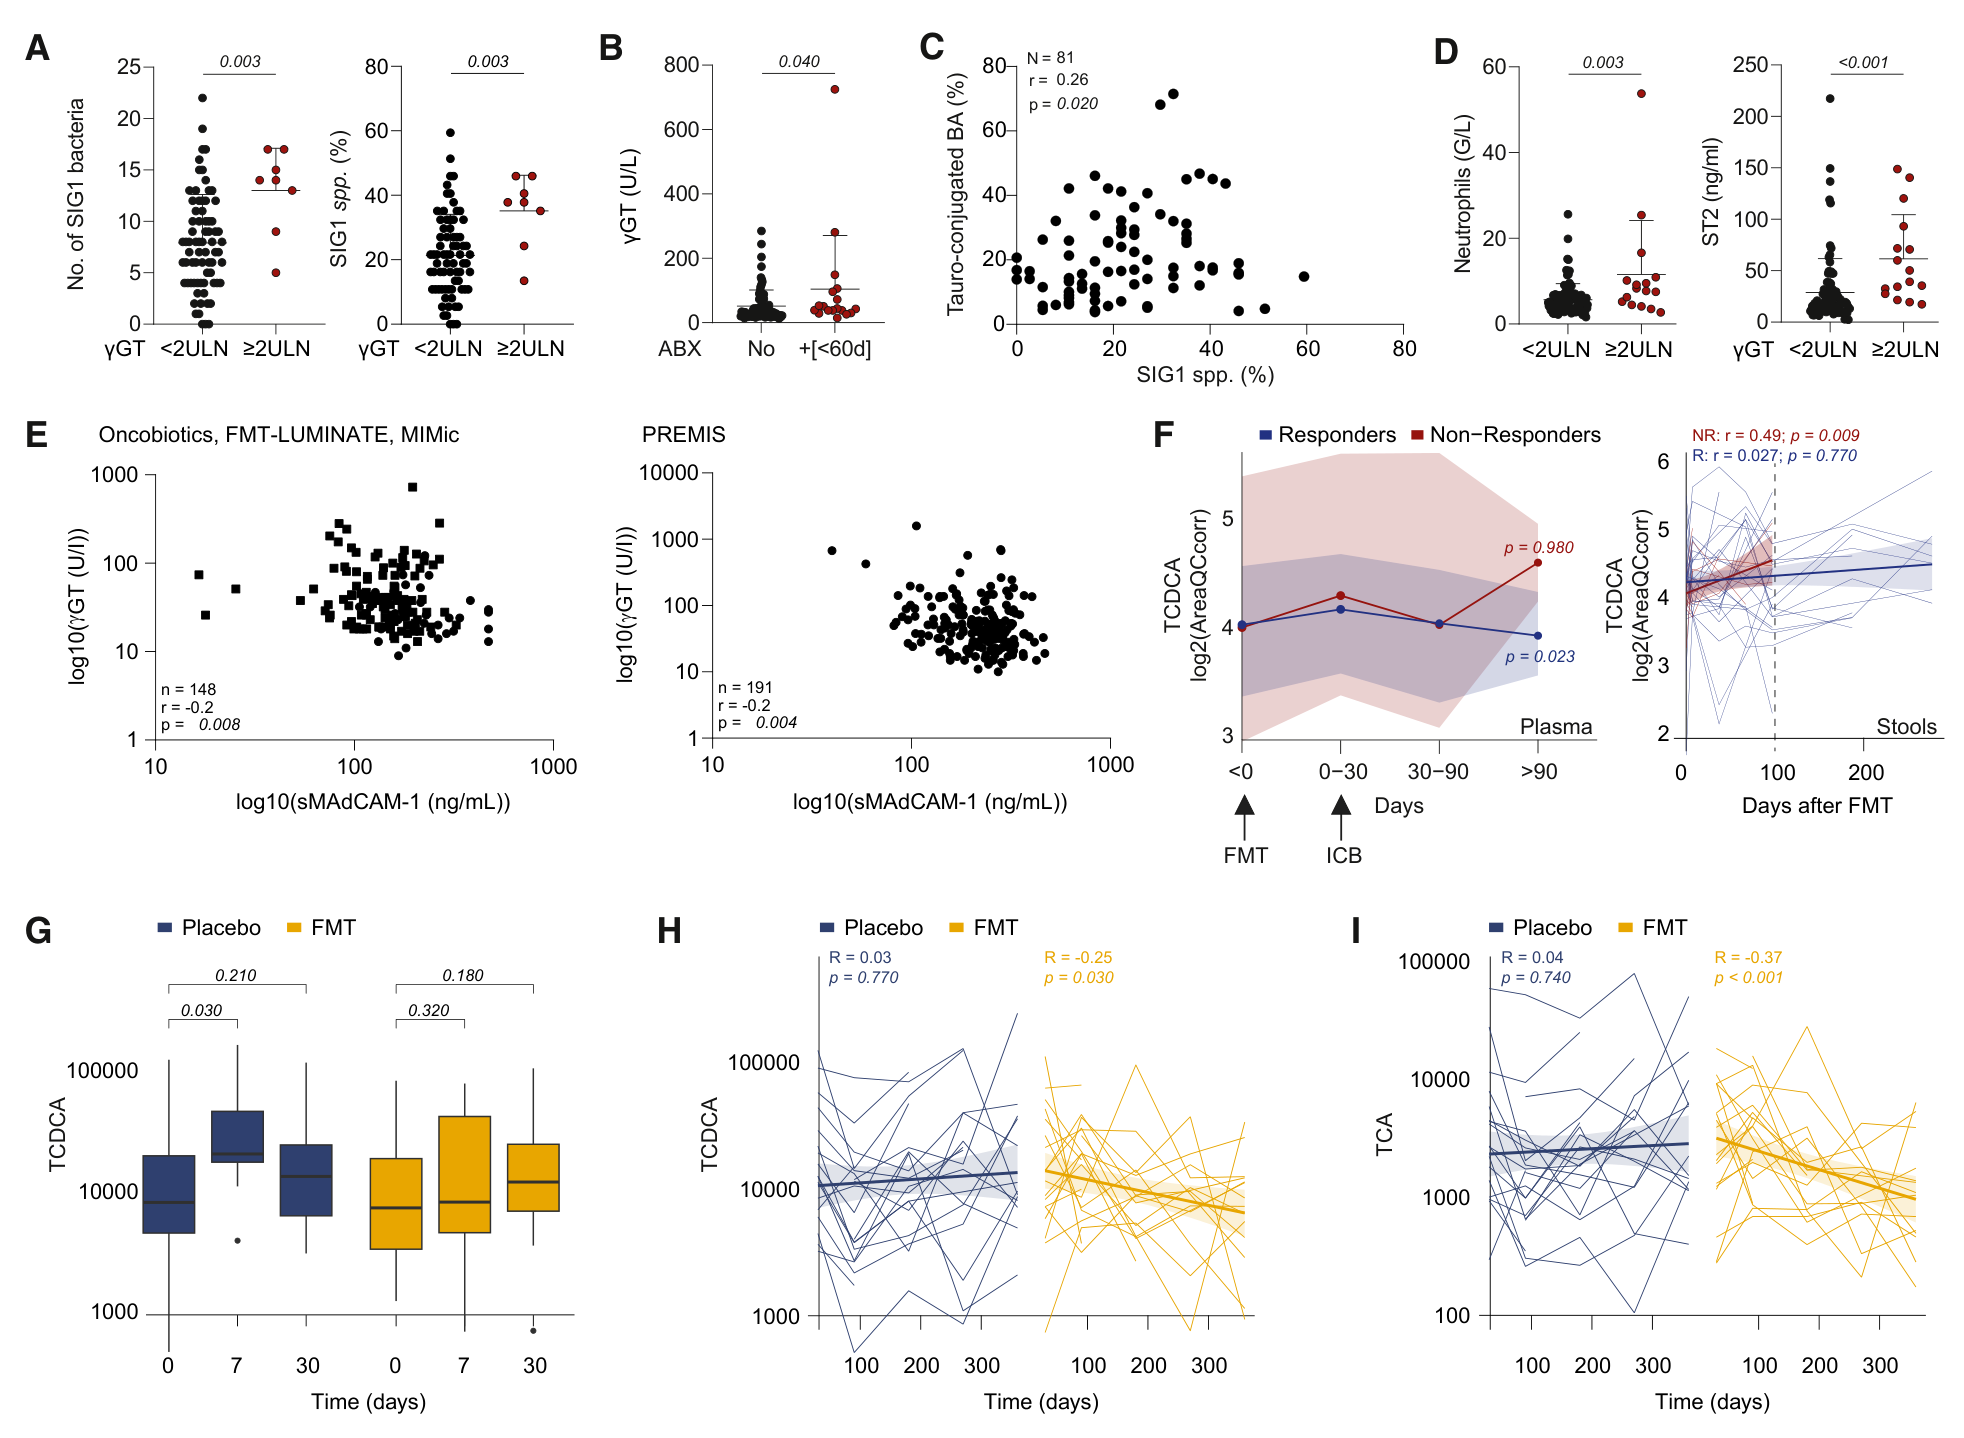
图8 · PDF第15页。患者关联分析及FMT队列的纵向代谢数据。
机制整合与后续线索
作者提出的路径是:菌群失调改变胆汁酸池,影响肠道FXR—MAdCAM-1及免疫细胞迁移,并伴随远端肿瘤T细胞状态改变和ICB反应下降。小鼠中的干预和基因缺失实验支撑部分因果环节;患者的γGT、菌群和代谢分析提供临床关联。
与既往MAdCAM-1研究相比,本篇补入了胆汁酸这一可测量、可干预的代谢层。后续可追踪三条原始文献线索:Fidelle等关于肠道免疫细胞迁移的Science研究、Varanasi等关于肝癌胆汁酸与T细胞反应的Science研究、FMT联合治疗的TACITO随机试验。本次对这些论文仅核对了本篇引文与转述,未完成独立全文核查。
局限与待解问题
- 模型与物种范围。 E. clostridioformis干预只模拟抗生素相关变化的一部分;胆管结扎造成明显肝损伤,与患者以γGT识别的亚临床状态不同。小鼠鼠胆酸代谢也与人类有差别,GDCA和fexaramine的抗肿瘤效应仍需临床验证。
- 机制环节。 尚缺内皮细胞特异性FXR缺失实验来连接体内GDCA效应与MAdCAM-1。耗竭相关标志物或转录本下降,与持久抗原特异性功能恢复之间还需要功能实验衔接;单细胞数量也不等于独立动物重复数。
- 临床解释。 γGT是多因素影响的指标;饮酒、合并药物、肝脏免疫性反应等残余混杂尚存。预后价值与预测ICB相对获益是不同待验证问题,后者需要治疗交互检验及前瞻验证。各组内部显著性不同,也应通过组间差异检验进一步评价。
- 原文与资料缺项。 图7G打印的OS HR为0.38、95% CI为0.19–1.77,同时标P<0.001;需要源表或作者说明进一步核对,本文不据此转述效应量。独立补图S1–S11与补表S1–S6尚未取得,涉及它们的细节保留为正文转述;来稿36页及其中8张主图、图形摘要、关键资源表已核读。
主图与表格 · 8 张
Figure 1 · PDF 第 5 页
Figure 1. Gut dysbiosis perturbs BA composition (A) Experimental settings at two different centers; D, day. (B) Supervised hierarchical clustering of BAs significantly different between ABX and water-fed tumor bearers assessed by metabolomics. (C and D) Kinetics of the percentages of distinct circulating BAs among the total BA. (E) Id. in the plasma of naive mice at GRCC and orally gavaged with E. clostridioformis or water controls. (F and G) Metabolite levels in tumor beds after 15 days of ABX. Volcano plot comparing ABX vs. drinking water (F), red dots indicate metabolites significantly increased after ABX. Dot plots depicting the percentages of distinct BA (G). Error bars indicate mean ± SEM (G). One representative experiment containing 8 mice/group (B, C, D, F, and G) and 6 and 7 mice/group (E) is depicted. Comparisons between groups were performed using non-parametric Mann-Whitney U test (2 groups), followed by multiple-comparisons test controlling the false discovery rate (FDR) (B, F, and G), or non-parametric Friedman test (>2 paired groups for longitudinal metabolomics analysis), followed by two stage set-up method of Benjamini, Krieger, and Yekutieli (C, D, and E). See also Figures S1–S3 and Table S1.
Figure 2 · PDF 第 7 页
Figure 2. GDCA rescues gut dysbiosis-associated resistance to immunotherapy (A) Experimental setting at GRCC. (B–F) Effect of E. clostridioformis with or without GDCA on the response to PD-1 blockade (B and C) or PD-1+CTLA-4 blockade (D and E) against MCA205 fi- brosarcomas (B and C) or RET (D and E). Tumor size at day 13–14 (B and D, left) or tumor growth kinetics (B right and E left) in three (C) or two (D) concatenated experiments comprising 25–29 (B), 9–10 (C), and 12–14 or 5 mice/group (E) and one representative experiment (E). (F) MCA205 tumor growth kinetics in mice treated with ABX (2 weeks) and orally gavaged twice with E. clostridioformis and BA (TDCA and DCA) treated with α-PD-1. Two pooled independent experiments of 4–5 animals/group. Comparisons between groups were performed using non-parametric Kruskal-Wallis H test (>2 groups), followed by multiple-comparisons test controlling the false discovery rate (FDR). p values were calculated at each time point comparing each group with E. clostridioformis + corn oil (red curves) with the Mann-Whitney U test (2 groups) (C, E right, and F). The tumor growth kinetics were analyzed using the online tool ‘‘TumGrowth’’ (see STAR Methods) (B right and E left). Mean ± SEM (B, D, and E left) or individual tumor growth kinetics (C, E four right panels, and F) are depicted. (G) Heatmaps representing the log2FC of BA levels between before (at D-1) and after oral BA at day 7 (left) and day 12 (right) in 5 mice/group. p value (*, p < 0.05; **, p < 0.01) on the log2FC between oral BA versus corn oil (Mann-Whitney U test, 2 groups). (H) Volcano plot contrasting plasma metabolites after GDCA versus LCA in dysbiotic mice at day 7 (n = 5 mice/group). Green and red dots are significant metabolites (Mann-Whitney U test, 2 groups). See also Figures S4 and S5 and Tables S1 and S2.
Figure 3 · PDF 第 8 页
Figure 3. Modulations of tauro-conjugated primary BAs and efficacy of PD-1 blockade (A) Surgical bile duct ligation (BDL) in MCA205 tumor-bearing mice treated with anti-PD-1 Abs at Centre de Recherche des Cordeliers. (B) Livers were stained with hematoxylin and eosin (top) as well as Sirius Red (bottom). One representative photograph of each liver in each group of 8–10 mice is shown. (C and D) Percentages of distinct BAs influenced by BDL. (E) Mean tumor growth curves in both groups. The tumor growth kinetics were analyzed using the online tool ‘‘TumGrowth’’ (see STAR Methods). (F) Experimental setting of ABX + E. clostridioformis-induced gut dysbiosis compensated by fexaramine in MCA205 tumor bearers at GRCC. (G) Tumor growth kinetics were analyzed as in (E). A representative experiment comprising 5 mice/group is shown, out of two yielding similar results. (H) Flow cytometric analysis of TILs in mice receiving ABX and/or fexaramine and treated with α-PD-1 mAb. One representative experiment comprising 10 mice/ group is depicted. One dot represents one tumor. (I and J) Longitudinal plasma metabolomics analyzing various BAs (in percentages of the total BA) over time. Each dot represents one mouse housed at GRCC animal facility. (K) Ex vivo stimulation of CD3+ T splenocytes exposed to various concentrations of BAs (left), followed by flow cytometry analysis of the co-culture for cell viability and proliferation. The absolute number of live CD3+ T cells or percentage of Ki67+ in CD8+ T cells recovered at 24 h of BA exposure is shown (middle and right, respectively). Also refer to Figures S6F and S6G for CD4+ T cells and fold change calculations. Each dot represents one well, and each experiment was performed in triplicate wells and performed between three to five times (n = 9–15 wells), except for T-β-MCA condition that was performed once (n = 3 wells). n = 9–10 mice/group (B–E and H–J). Error bars indicate mean ± SEM (C, D, E, G, H, and K). Comparisons between groups were analyzed using non-parametric Mann-Whitney U test (2 groups) or Kruskal-Wallis H test (>2 groups), followed by multiple-comparisons test controlling the false discovery rate (FDR) (C, D, H, and K), or non-parametric Friedman test (>2 paired groups for longitudinal metabolomics analysis), followed by two stage set-up method of Benjamini, Krieger, and Yekutieli (I and J). The tumor growth kinetics (E and G) were analyzed using the online tool ‘‘TumGrowth’’ (see STAR Methods). See also Figure S6 and Table S1.
Figure 4 · PDF 第 9 页
Figure 4. GDCA acts at sites distal from the liver to reprogram the TME (A–D) Intratumoral abundance of orally gavaged BAs determined by mass-spectrometry-based metabolomics in E. clostridioformis dysbiotic mice treated with α-PD-1 on day 12 post MCA205 injection, comparing BA vs. water + corn oil controls using Z scores of AreaQCcorr. Shown is the concatenation of 2 experiments including 3–5 mice/group. (legend continued on next page) (E–G) Flow cytometric analysis of LAG-3 expression on various CD4+ T subsets infiltrating the tumor of dysbiotic mice receiving BA and α-PD-1 mAb. One representative experiment comprising 5–10 mice/group is depicted. (H–K) Violin plots showing the expression levels of selected genes encoding the exhaustion signature in all CD8+ TILs in each treatment group on day 11. See also Figure S7. (L and M) In vitro screening of several BAs at 100 μM or cilofexor at 50 μM on Madcam1 relative expression by RT-qPCR in TSECs exposed to TNF-α (vs. negative control [Ctrl-]) (L) or TSECs genetically modified by means of CRISPR-Cas9 gene editing (M). Results from 3–4 independent experiments were pooled, and each dot represents one well; n = 18–42 (L) and 24 (M). (N) In vivo effects of orally gavaged BA on Madcam1 expression in the ileum of mice treated with ABX. Results from 2 independent experiments are pooled using Z score, and each dot represents one mouse; n = 10. (O–Q) Experimental setting (O) and flow cytometric determination of the percentage of CFSE+ T cell subsets reaching the tdLN in day 12 tumor-bearing mice at 24 h after CFSE injection into mLN (P and Q). Results from 2 independent experiments are pooled, and each dot represents one mouse; n = 7–11. (R and S) Differential effects of corn oil (R) versus GDCA (S) in WT vs. Madcam-1−/−MCA205-bearing mice treated with PD-1 blockade. Two pooled experiments comprising n = 9–10 mice/group, showing individual kinetics and mean + SEM tumor growths. p values were calculated at each time point, comparing the two groups. Error bars indicate mean ± SEM (A–N and P–S). Comparisons between groups were performed using non-parametric Kruskal-Wallis H test (>2 groups), followed by multiple-comparisons test controlling the false discovery rate (FDR), except written otherwise (A–G, L–N, P, and Q), or significance was calculated with Wilcoxon rank-sum test and adjusted for multiple testing using Benjamini-Hochberg correction (H–K). The tumor growth kinetics (R left and S left) were analyzed using the online tool ‘‘TumGrowth’’ (see STAR Methods). For R (right) and S (right), p values were calculated at each time point comparing the two groups together using the Mann-Whitney U test. See also Figures S4–S8 and Tables S1 and S3.
Figure 5 · PDF 第 12 页
Figure 5. Gut dysbiosis alters BA composition in cancer patients (A–D) Percentages of each BA among the total BAs in the plasma, assessed using metabolomics in 133 cancer patients (n = 138 samples) from the ONCOBIOTICS cohort who took ABX (n = 16 + [0–30 days] (A–D); n = 9 +[>30 days] and n = 13 + [>60 days] (B–D)) or did not take ABX (n = 100) (A–D) within different time windows post-ABX cessation as well as for plasma ratio of glyco- over tauro-conjugated BAs (D, bottom). Error bars indicate mean ± SD. Comparisons between groups were performed using non-parametric Mann-Whitney U test (2 groups) in (A) and non-parametric Kruskal-Wallis H test (>2 groups) in (B)–(D). (E) Clustering of Spearman’s correlation coefficients of plasma BAs in patients who took ABX (n = 13 +[0–30 days], left) or did not take ABX (n = 85, right). (F) Spearman’s correlations between distinct plasma BAs (in percentages of total BA) and the paired stool S-score,36 calculated in 61 ONCOBIOTICS patients before and until 15 days after immunotherapy initiation. See also Figures S9–S11 and Tables S4, S5, and S6..
Figure 6 · PDF 第 13 页
Figure 6. Cancer patients can be stratified based upon plasma BA composition (A) Non-supervised hierarchical clustering of the percentages of plasma BAs in 111 ONCOBIOTICS patients before and until 42 days post ICB initiation. (B–E) Dot plots of the percentages of BAs or conjugated BAs and calprotectin (S100A9) measured in the plasma according to the three clusters illustrated in (A). Also refer to Table S4 and Figures S9 and S10. Each dot represents plasma levels in one patient (n = 111). Error bars indicate mean ± SD. Comparisons between groups were performed using non-parametric Kruskal-Wallis H test (>2 groups), followed by multiple-comparisons test controlling the false discovery rate (FDR). (F) Kaplan-Meier survival curves and univariate Cox regression to assess the prognostic value of each BA cluster (Cox-Mantel test). See also Figures S9–S11 and Tables S4, S5, and S6
Figure 7 · PDF 第 14 页
Figure 7. Subclinical cholestasis reduces cancer patient survival (A) Patient cohorts amenable to immunotherapy (ICB), +/− chemotherapy (CT), radiotherapy (RT), or tyrosine kinase inhibitors (TKI) and randomized in 2 arms (AtezoTRIBE) for whom γGT and alkaline phosphatase (ALP) levels were assessed in the plasma. (B–G) Univariate analyses for overall survival (OS) (B, F, and G) and progression-free survival (PFS) (C–G), using the Kaplan-Meier estimator and Cox regression with indicated hazard ratios (HRs) and log rank (Mantel Cox) test p values to assess the prognostic value of γGT in each cohort aligned in (A). Also refer to Tables S5 and S6 for univariate and multivariate analyses, respectively. (H) Longitudinal evolution of the mean γGT levels in U/L (scale in log10) for 111 patients who progressed (PFS < 6, orange) or not (PFS ≥6, blue) within 6 months of ICB initiation in the ONCOBIOTICS cohort, as well as for different periods of time. Comparisons between time points (0–1, 1–6, and 6–12 months) were performed using non-parametric Wilcoxon matched-paired test for each PFS group. Comparisons between groups (PFS <6 or ≥6) were performed using non-parametric Kruskal-Wallis H test (>2 groups), followed by multiple-comparisons test controlling the false discovery rate (FDR). (I) Clustering of Spearman’s correlation coefficients between BAs (%), liver parameters, and sMAdCAM-1 (in ng/mL) in the plasma of patients from ONCOBIOTICS, FMT-LUMINATE, MIMIC, and AtezoTRIBE cohorts (p values: *, <0.05; **, <0.01; ***, <0.001). High γGT levels were defined as ≥2ULN (ULN: male patients ≥45U/L; female patients ≥35U/L). See also Figures S9–S11 and Tables S4, S5, and S6.
Figure 8 · PDF 第 15 页
Figure 8. Subclinical cholestasis is a surrogate marker of gut dysbiosis (A) Absolute number and percentages of SIG1 bacteria among the 37 SIG136 in patient feces according to plasma γGT < or ≥2 ULN (n = 73 and 8 samples, respectively). (B) Plasma γGT levels (in U/L) in patients treated with ABX according to the window of blood sampling before ABX (n = 85 in no ABX and 18 samples in ABX cessation less than 60 days, respectively). (C) Spearman’s correlation between percentages of tauro-conjugated BAs and SIG1 bacteria species among 37 SIG1 at baseline.36 (D) Increase in neutrophil blood counts and plasma soluble ST2 levels in patients with γGT ≥2ULN versus those with γGT < 2ULN (n = 16 and 95, respectively). (E) Spearman’s correlation between γGT (U/L) level and sMAdCAM-1 (ng/mL) in ONCOBIOTICS, FMT-LUMINATE, and MIMIC pooled cohorts and PREMIS. (F) Trajectory of TCDCA (in mean and CI95% Log2AreaQCcorr) in the plasma (n = 32 patients) or in the stools (n = 34 patients) of responder vs. non-responder patients before and during ICB in pooled MIMIC and FMT-LUMINATE cohorts. Comparison between responders and non-responders were performed using a longitudinal slope estimation approach. Left: the significance of temporal changes of plasma TCDCA levels within responders and non-responders was assessed from the estimated time effect in each group, and p values are annotated (related to STAR Methods). Right: Spearman’s correlations between fecal TCDCA levels and days after FMT. (G) Boxplots of raw values of TCDCA (AreaQCcorr) at three time points in TACITO (n = 45). The box shows the interquartile range (Q1–Q3), with the median marked inside. Whiskers extend up to 1.5 × IQR beyond Q1 and Q3. Values outside the whiskers are plotted separately as outliers. (H and I) Idem as in (F) right in the 2 arms of TACITO for TCDCA (H) and TCA (I), depicted in trajectories. Also refer to Figure S11I to visualize the differential evolution of all BAs in the two treatment arms. The significance of temporal changes of plasma TCDCA (H) and TCA (I) levels within placebo and FMT arms after the treatment start was assessed using Spearman’s correlations, and p values and coefficients correlation (Rho) are annotated. Comparisons between groups were performed using non-parametric Mann-Whitney U test (2 groups) (A, B, and D) or Kruskal-Wallis H test (>2 groups) (G), followed by multiple-comparisons test, controlling the false discovery rate (FDR). Error bars represent mean ± SD in (A)–(D). See also Figures S9–S11 and Tables S4, S5, and S6.
完整阅读记录与证据表
文献卡:菌群失调相关胆汁淤积与免疫治疗反应
- Paper ID:p-0022-art-subclinical-cholestasis-hallmark-gut
- 原题:Subclinical cholestasis is a hallmark of gut dysbiosis causing resistance to cancer immunotherapy
- Cancer Cell 44,1653–1671.e1–e16;在线2026-07-29,卷期2026-08-10;DOI:10.1016/j.ccell.2026.06.022。
- 阅读日期:2026-09-28;晨报日期:2026-09-29。
- 使用技能:article-read、morning-report、pdf、web-publish。
- 阅读范围:来稿36页,包括主文、8主图及图注、讨论、引文、STAR Methods和5页关键资源表;图形摘要已读。独立补图S1–S11和补表S1–S6未取得,相关结论仅按正文转述;processing_status=partial。
- 图表归档:14 PNG,网页选8主图;详见figures/README.md、manifest.json及captions.md。无已取得超长附表例外。
- 人工核对:pending;未重算公开原始组学或生存数据。
一句话结论
动物干预连接菌群失调、胆汁酸组成、MAdCAM-1与ICB反应;患者资料显示γGT升高与较差生存相关,临床治疗预测价值和GDCA干预效果仍待验证。
研究问题与背景
作者此前提出肠道MAdCAM-1影响免疫抑制性T细胞向远端肿瘤迁移,本篇研究补入胆汁酸代谢这一环节,并考察γGT能否反映相应临床状态。既往Science 2023等工作属于本文转述,未独立全文核查(第2–3、18–20页)。
贡献与比较对象
动物中比较水/抗生素、细菌干预/对照、不同胆汁酸、fexaramine/载体、胆管结扎/假手术,以及Madcam1缺失/野生型。细胞系比较不同胆汁酸受体缺失。患者部分比较抗生素时间窗、胆汁酸聚类、γGT分组与FMT相关时间轨迹。各干预和终点保留其各自对照。
方法与验证
- 小鼠主要为雌性C57BL/6背景,MCA205及RET来源细胞均皮下接种;RET属于来源于转基因模型的移植细胞系,本篇并非直接跟踪自发RET肿瘤。作者报告随机分组,未在已读内容明确所有测量是否盲法(第28、30–31页)。
- 胆汁酸采用UHPLC-MS;部分图为占比,部分为校正峰面积、Z score或log2变化,随具体图轴解释(第29、33–34页)。
- 流式、肠系膜淋巴结CFSE示踪、受体敲除、回肠转录检测及单细胞测序连接机制。单细胞方法报告肿瘤9、淋巴结11个样本标签;初始捕获量77,821/76,529与正文分析细胞18,669/14,842为不同处理阶段的计数(第10、32–33页)。
- 生存曲线采用Kaplan–Meier/log-rank,HR使用Cox模型;多变量调整详细参数需补表核查。FMT-LUMINATE/MIMic血浆时间效应使用线性混合模型;TACITO图8H–I使用Spearman相关(第30、36页及图8注)。
核心证据
| 主张或结果 | 数字、单位与比较条件 | PDF页序/图表 | 依据类型 | 核对状态 |
|---|---|---|---|---|
| 抗生素改变多组织胆汁酸谱 | 图1B–D、F–G每组8鼠;图1E为6或7鼠。多项纵轴为总胆汁酸中的百分比 | 4–5,图1 | 正文、图与图注 | 已核 |
| 肿瘤内牛磺酸结合型成分变化不完全一致 | Tα/β/ω-MCA P=0.001、TCA P=0.038、TUDCA P=0.003;TCDCA P=0.105 | 5,图1G | 原图 | 已核 |
| GDCA改善相应小鼠ICB反应 | MCA205中GDCA有效,LCA/UDCA未显示同样作用;RET中GDCA/UDCA有效,细菌造成疗效下降的D14比较P=0.061 | 6–7,图2B–E | 正文、原图 | 已核 |
| BDL抑制PD-1阻断效果 | BDL对假手术;明显肝损伤,胆汁酸谱及肿瘤生长改变 | 6、8,图3A–E | 正文、原图 | 已核 |
| fexaramine改善肿瘤控制 | 图3G P<0.0001;CD8群LAG-3相关比较P=0.054,不写显著下降 | 8,图3G–H | 原图 | 已核 |
| 胆汁酸纵向与离体读出 | 图3I为组内时间比较;图3K为培养孔重复,通常9–15孔,T-β-MCA仅3孔一次实验;右图纵轴为活Ki67+CD8绝对数 | 8,图3I–K | 图、图注 | 已核;图注口径差异 |
| 肿瘤内GDCA与T细胞状态 | GDCA肿瘤内增加P=0.144;牛磺酸结合型鼠胆酸减少P=0.025;部分LAG3及耗竭相关转录本降低 | 9–10,图4A、D–K | 正文、原图 | 已核 |
| 内皮FXR与MAdCAM-1 | TNF-α刺激TSEC;Nr1h4缺失削弱GDCA诱导Madcam1;图4L/M点为孔,n=18–42/24 | 9–11,图4L–N | 正文、原图、图注 | 已核 |
| 细胞示踪的比较基线 | GDCA对LCA:CD4 α4β7 P=0.008,Treg P=0.015;对玉米油:P=0.122、0.179 | 9–10,图4P | 原图、图注 | 已核 |
| MAdCAM-1参与肿瘤效应 | GDCA+PD-1下WT对Madcam1缺失P=0.027;无GDCA条件P=0.274;未报告正式交互检验 | 9–11,图4R–S | 正文、原图 | 已核 |
| 患者胆汁酸与抗生素 | 133人、138样本;无ABX100,三个ABX时间窗16、9、13份;图5A近期ABX UDCA P=0.021,TCDCA P=0.038 | 11–12,图5 | 正文、原图、图注 | 已核 |
| 菌群评分关联较弱 | 61名配对患者;DCA与S-score r=0.27,P=0.037;牛磺酸结合型BA r=−0.30,P=0.020 | 12,图5F | 原图、图注 | 已核 |
| 胆汁酸分型为探索性生存观察 | 111人,治疗前或治疗后42天内;三组基线29/58/24;OS总体P=0.08,另有两两比较 | 11、13,图6 | 正文、原图、图注 | 已核 |
| γGT分组与分析集 | ≥2ULN;图注ULN男45、女35 U/L;六队列111/185/100/54/38/111,共599;Atezo111含36例非ICB对照 | 11–14,图7 | 正文、原图、图注 | 已核;见coverage |
| 调整后PFS关联 | ONCOBIOTICS P=0.024;G2R 0.015;MEDITREME 0.013 | 12,正文引Table S6 | 正文转述补表 | 源表未得,HR不补填 |
| 调整后OS关联 | PREMIS P=0.014;MEDITREME 0.048;AtezoTRIBE 0.039 | 12,正文引Table S6 | 正文转述补表 | 源表未得,HR不补填 |
| γGT与sMAdCAM-1弱负相关 | 合并队列n=148,r=−0.2,P=0.008;PREMIS n=191,r=−0.2,P=0.004;此处分析集不同于生存185人 | 15,图8E | 原图、图注 | 已核 |
| FMT队列血浆TCDCA时间变化 | 血浆32人,粪便34人;应答者组内时间效应P=0.023,非应答者0.980 | 15–16、30,图8F | 正文、原图、方法 | 已核;不当作组间P值 |
| TACITO胆汁酸轨迹 | 45人;FMT组TCDCA rho=−0.25/P=0.030,TCA rho=−0.37/P<0.001;安慰剂相关未显著 | 15–16,图8G–I | 原图、图注 | 已核;重复观测与统计单位待源数据 |
局限与待解问题
作者明确指出
第16页指出:Enterocloster干预并未完全模拟抗生素效应;尚缺抗生素暴露患者粪便移植到小鼠的相应证据;尚缺内皮特异性Nr1h4删除;临床混杂如免疫性肝病、饮酒、多种合并用药和社会经济条件尚未充分纳入。
分析判断与理由
- 小鼠胆管结扎、患者γGT升高与细胞胆汁酸暴露的生理范围不同;鼠胆酸存在物种差异,因此按模型分别呈现结论。
- γGT当前更直接的证据是预后关联;治疗预测价值需要随机治疗交互与前瞻检验。Atezo非ICB组不显著、ICB组显著本身尚未提供交互检验结果。
- 标志物/转录本变化支持T细胞状态改变;持续功能、抗原特异性及记忆需要额外功能证据。细胞水平差异检验与独立动物重复数应区分。
- FMT后组内时间效应不等于FMT相对安慰剂的时间交互,亦未直接建立胆汁酸变化对临床获益的中介效应。
- 图7多项HR区间与log-rank显著性不完全一致,检验不同可能产生差异;图7G OS区间0.19–1.77尤其需源表核对,不擅自改成其他数值。
- 独立补充材料未取得,补充实验、调整变量及源数据不能视为完整核验;未重算原始统计。
待核对问题与后续阅读
- 优先取得Figures S1–S11和Tables S1–S6,核对临床源表、每队列协变量/分析例数、图7G区间,以及METIMMOX具体生存指标。
- 原文第25页概述“eight trials”,后实际列出九项研究;第36页统计段引Table S4,而生存结果段指S5/S6。保留原记录,待附件核对。
- 本篇第19–20页引文21(Science 2023,10.1126/science.abo2296)、9(Science 2025,10.1126/science.adl4100)、45(TACITO,10.1038/s41591-025-04189-2)为优先追读。此次仅核对本篇引文;期刊请求受阻,未独立全文阅读。
- GDCA调节肠道、肿瘤细胞及全身胆汁酸池的相对贡献,以及γGT与肝转移/基础肝病等因素的关系,需要后续研究分解。