研究问题
BRAF突变结直肠癌依赖MAPK信号,但BRAF抑制后的反馈激活会削弱通路抑制。本文考察另一种干预方式:降解RNA结合蛋白HuR,改变其下游转录本的加工,进而降低BRAF蛋白的生成。
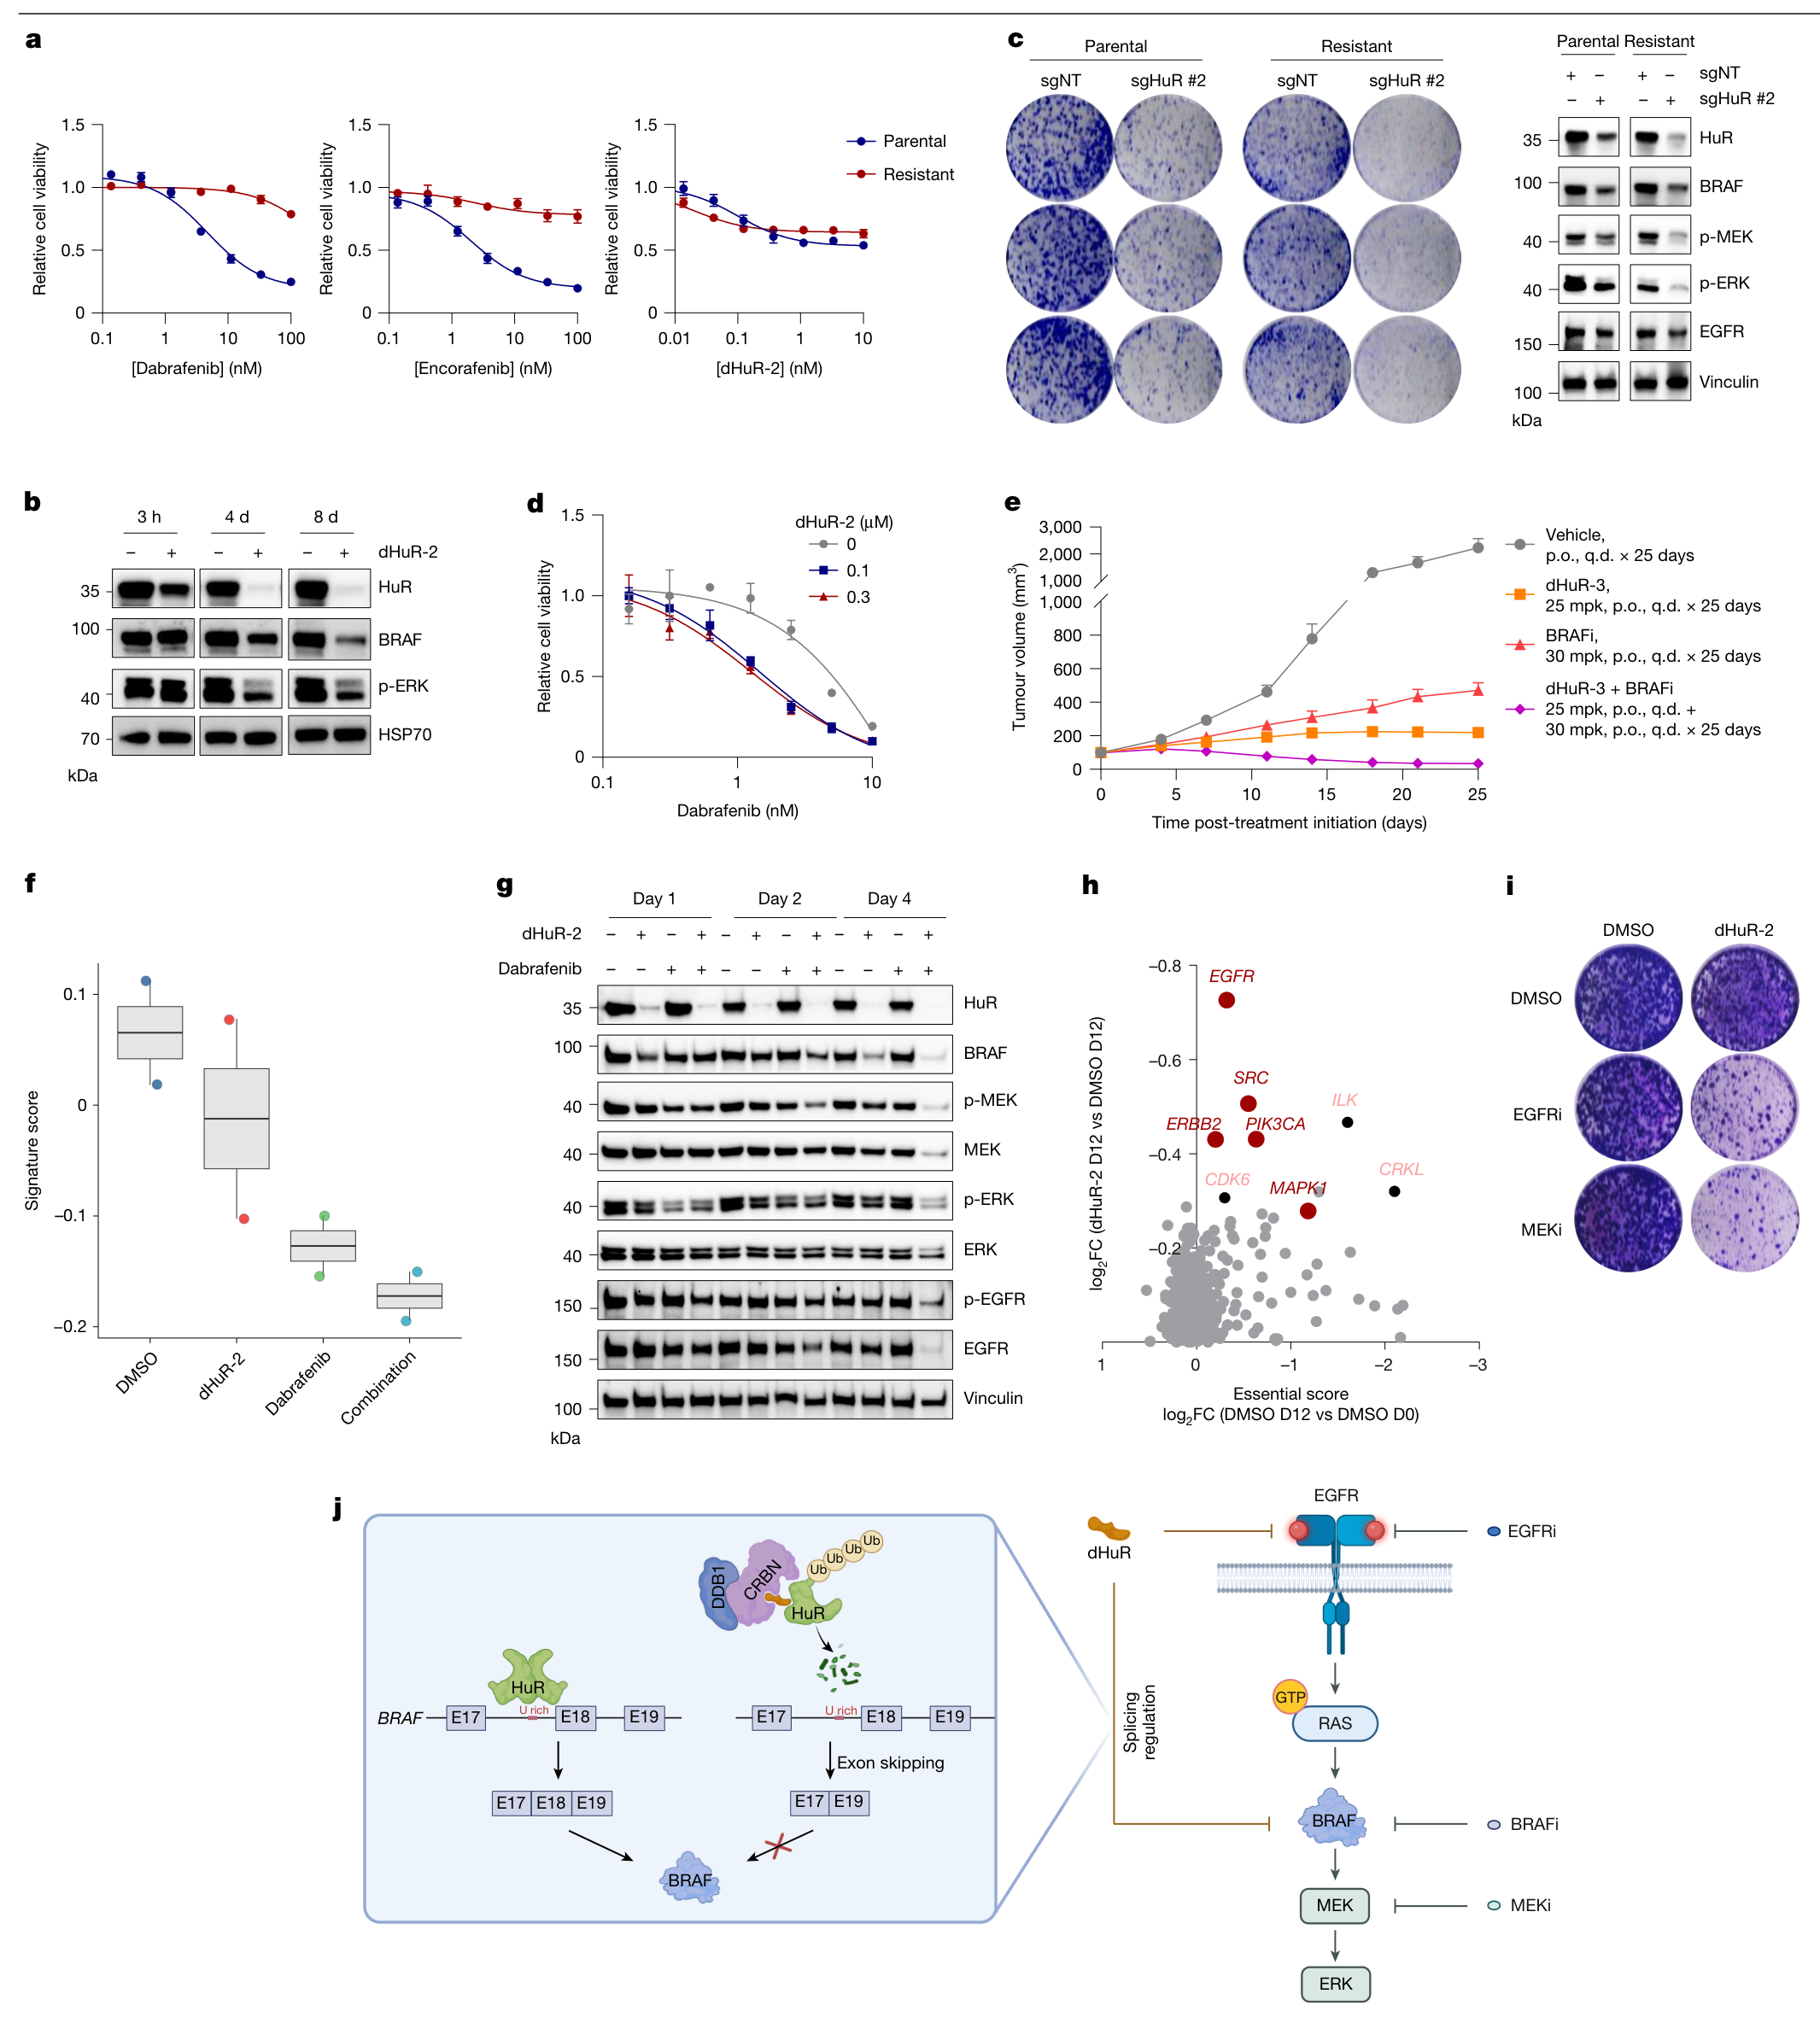
研究把分子胶筛选、三元复合物结构、遗传对照、RNA剪接和动物疗效串在一起。最直接的机制证据是:HuR结合BRAF内含子17的富U区域,帮助保留外显子18;HuR被降解后,外显子18跳读增加,BRAF转向蛋白产出较低的X2异构体。本文使用dHuR-1至dHuR-3作为工具化合物。(图1–5)
研究设计
| 证据层次 | 模型与读出 | 回答的问题 |
|---|---|---|
| 分子胶发现 | CRBN结合筛选;CRBN野生型与敲除细胞蛋白组比较 | 化合物能否依赖CRBN降低HuR蛋白 |
| 降解机制 | 蛋白相互作用、体外泛素化、冷冻电镜与位点突变 | CRBN、分子胶与HuR怎样形成降解复合物 |
| 肿瘤依赖 | DepMap;13个CRC细胞系的8天生长实验;HuR敲除和降解抗性突变 | BRAF突变背景是否更依赖HuR,药物表型是否需要HuR降解 |
| RNA机制 | RNA-seq、RIP、RNA拉下、minigene和多聚核糖体分离 | HuR如何调节BRAF剪接及蛋白产出 |
| 疗效与联合 | Colo205细胞来源异种移植;一个BRAF V600E患者来源异种移植模型 | 单药及联合治疗能否控制肿瘤生长 |
1. 分子胶使HuR进入CRBN依赖的降解通路
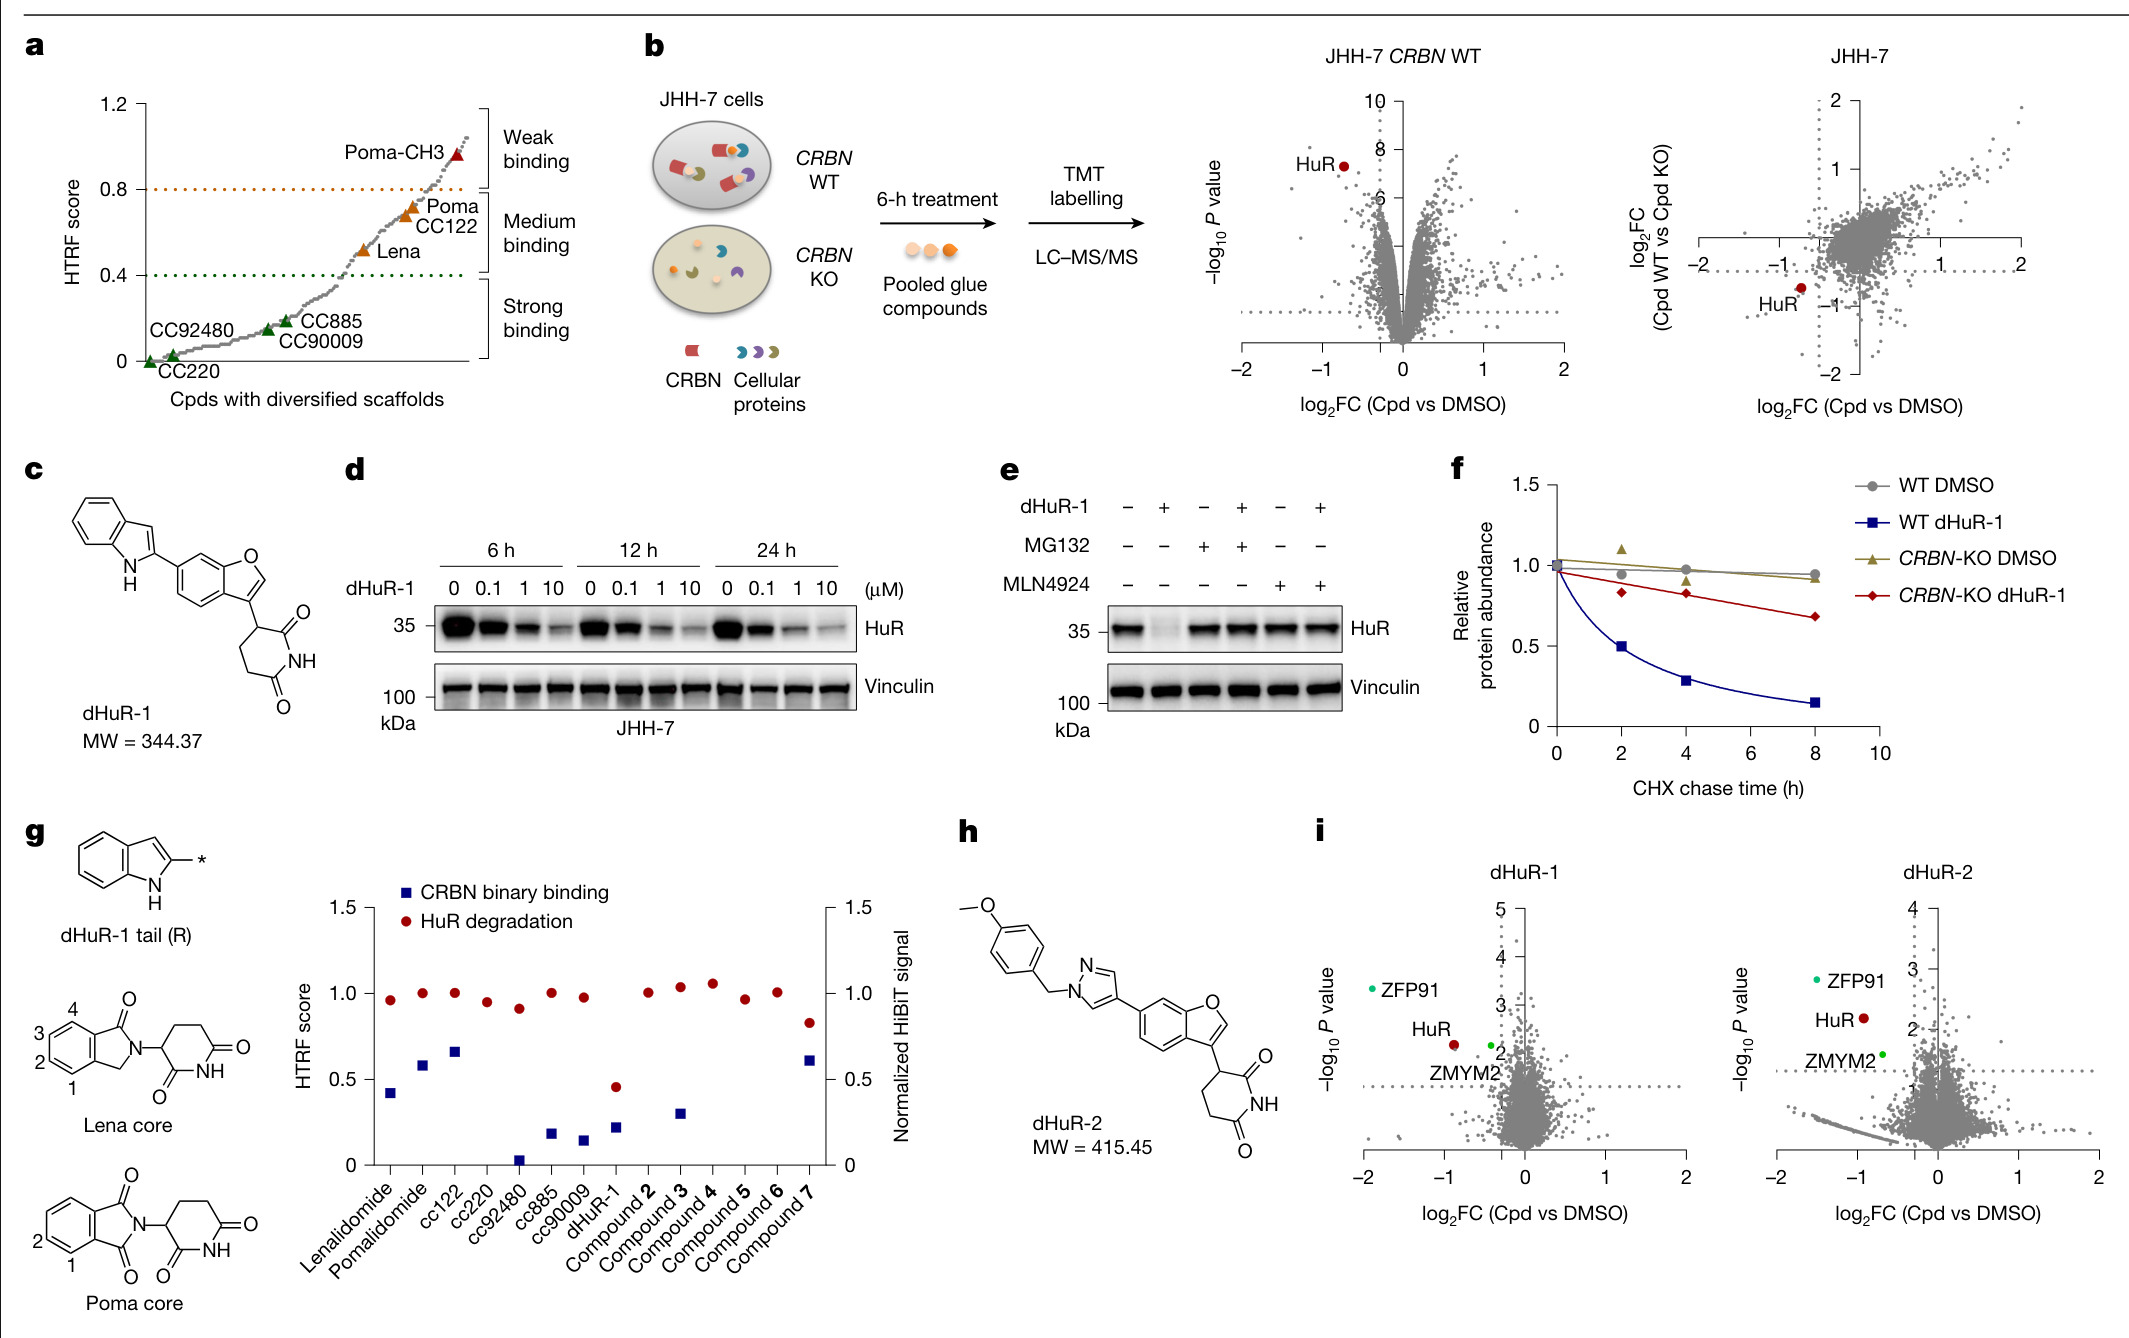
作者建立了超过10,000个化合物的CRBN分子胶库,先用约200个代表性化合物进行结合筛选,再比较CRBN野生型和敲除JHH-7细胞接受化合物池处理后的蛋白组,发现HuR下降,并通过单化合物实验确定dHuR-1。(图1a–d)
dHuR-1降低HuR蛋白;蛋白酶体抑制剂MG132或NEDD8通路抑制剂MLN4924可阻断这一变化。CRBN敲除也削弱HuR的加速消失,支持CRL4–CRBN和蛋白酶体参与降解。(图1e、f)
优化后的dHuR-2,正文报告HuR降解DC50为3.8 nM、最大降解幅度96%、蛋白减少一半所需时间2.45小时。这些指标描述HuR蛋白降解。蛋白组与免疫印迹同时显示,ZFP91和ZMYM2也被降解;在所测条件下,GSPT1及HuB、HuC、HuD得到保留。(图1i;扩展图1)
2. 结构与突变共同定位CRBN–分子胶–HuR界面
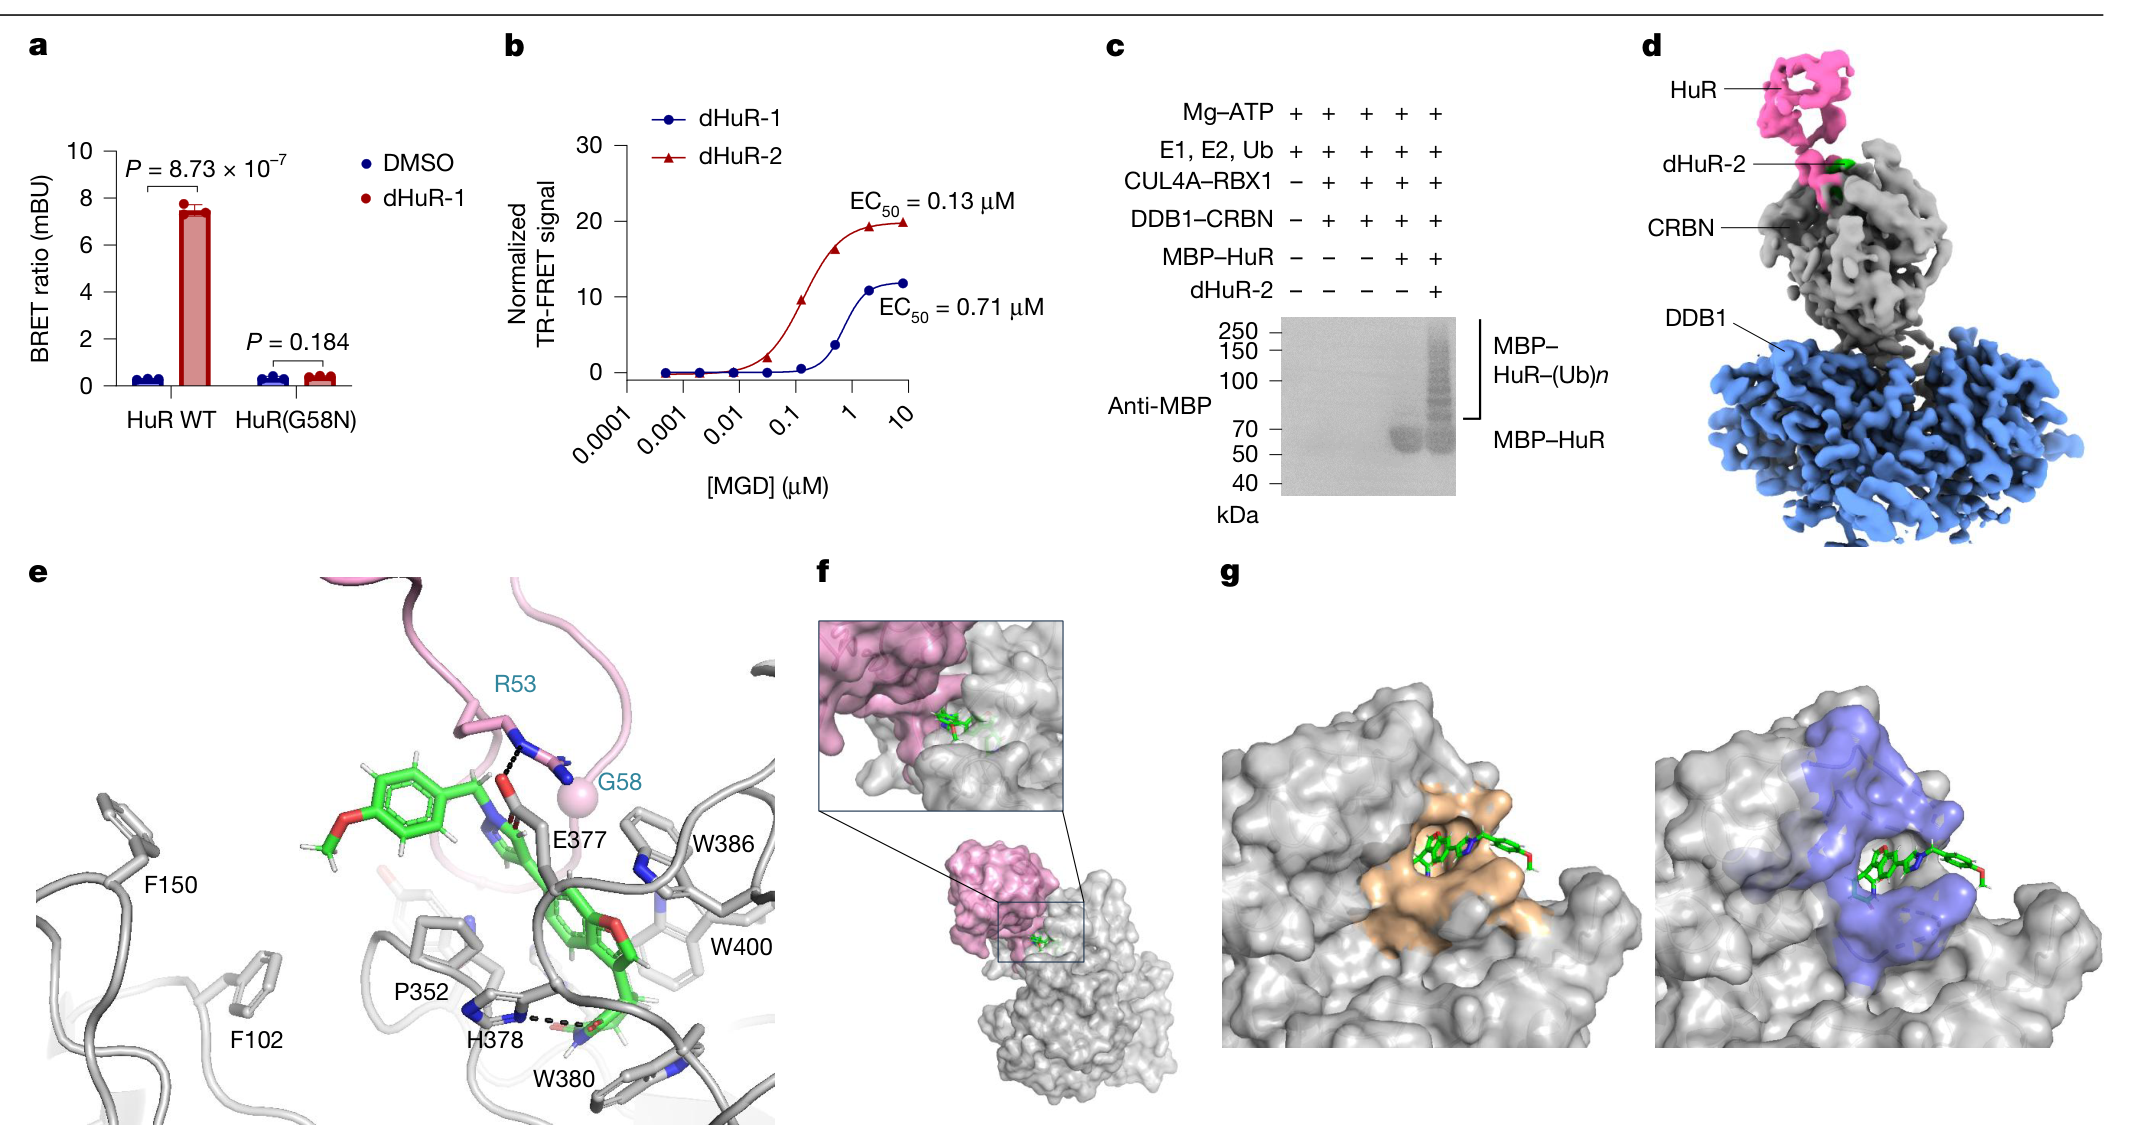
dHuR-2增强CRBN与HuR形成三元复合物,并在重组E1、E2、E3体系中促进HuR多聚泛素化。冷冻电镜结构显示,化合物结合CRBN的口袋并重塑蛋白接触面,使HuR的G58所在环区参与结合;HuR的R53与CRBN的E377形成界面接触。(图2a–g)
位点实验与结构相互印证:HuR G58突变削弱复合物形成和降解;CRBN E377、V388的改变降低降解活性。鼠Crbn需要V380E/I391V双位点改造,才能支持该化合物对鼠HuR的降解。(扩展图2)
正文将结构分辨率概括为3.3 Å,补表2给出3.35 Å。结构使用HuR的RRM1/2片段,描述的是降解复合物的识别界面。(图2;补表2)
3. BRAF突变CRC对HuR降解更敏感
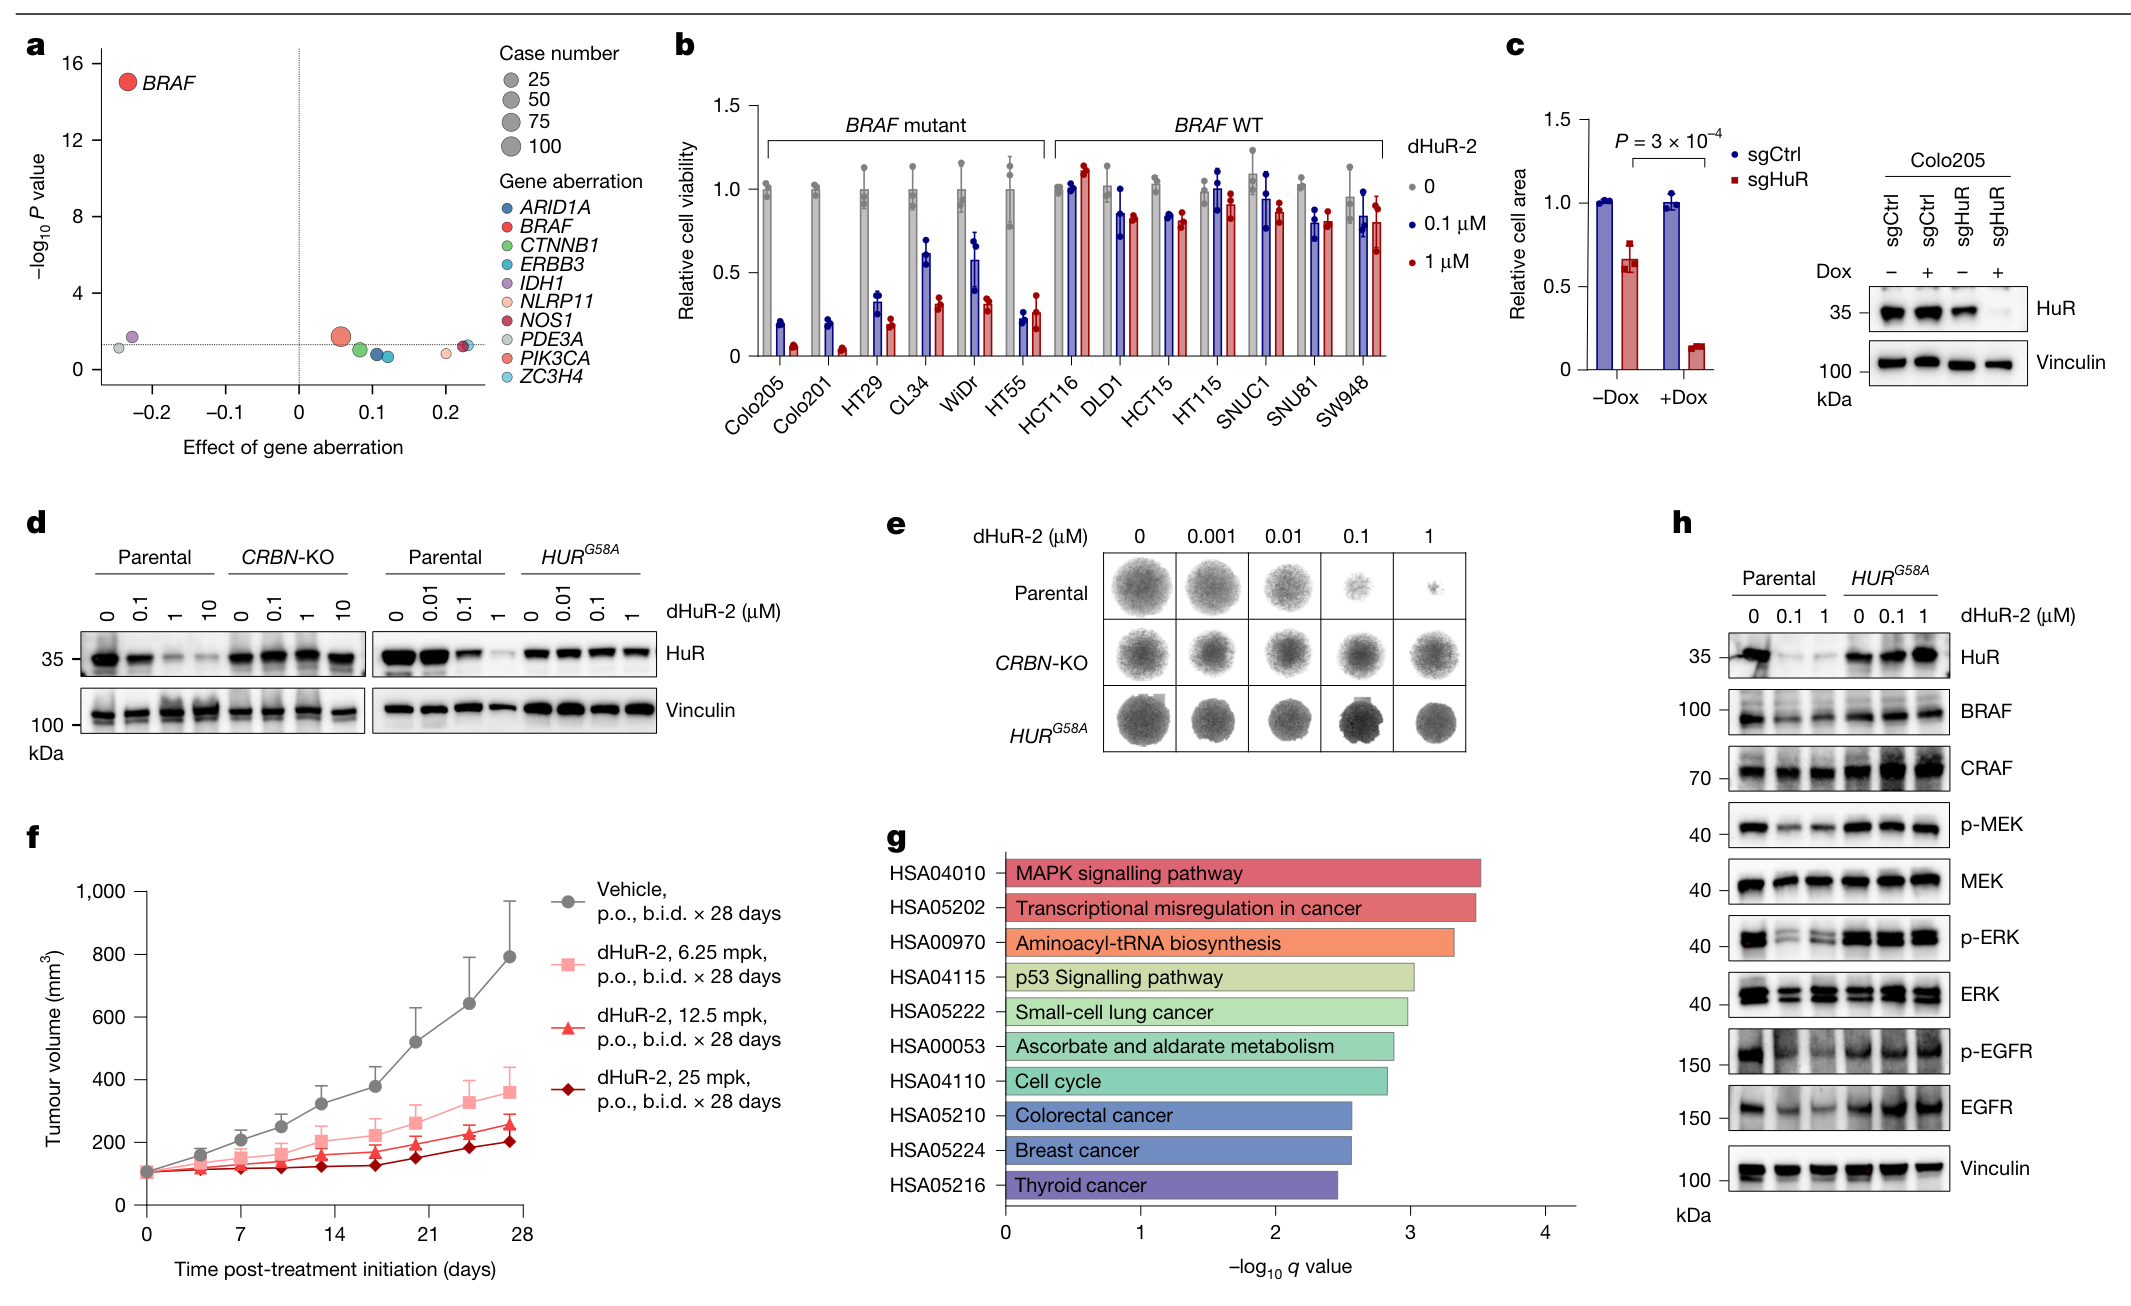
DepMap分析提示,BRAF突变与HuR敲除后的生长依赖相关。图3b随后比较13个CRC细胞系:6个被列为BRAF突变型,7个为野生型。8天dHuR-2处理明显抑制突变组的生长,野生型整体反应较弱。突变组包含WiDr与HT29,补充方法说明WiDr源自HT29,因此这里的细胞系数量包含相关来源。(图3a、b;补充信息PDF第8页)
关键遗传对照来自Colo205:HuR敲除抑制三维球体生长;CRBN敲除或HuR G58A敲入使HuR抗降解;图3e的球体生长保护由HuR G58A敲入实验支持。HuR G58A也保护BRAF、EGFR和下游信号读出,说明这些表型需要HuR降解。(图3c–e、h)
在Colo205细胞来源异种移植模型中,每组6只小鼠,dHuR-2按6.25、12.5或25 mg/kg每日口服两次,治疗28天,呈剂量相关的肿瘤生长抑制。源表最后一次体积测量标为第27天:25 mg/kg组平均203.2 mm³,载体组792.0 mm³;两组起始均约106 mm³。这一实验显示生长抑制,肿瘤体积仍高于起点。(图3f;Source Data)
RNA-seq中下调基因的KEGG富集指向MAPK和细胞周期等通路;免疫印迹显示BRAF及p-ERK下降,细胞周期实验显示G1期比例增加。(图3g、h;扩展图6c、d)
4. HuR通过内含子17调节BRAF外显子18保留
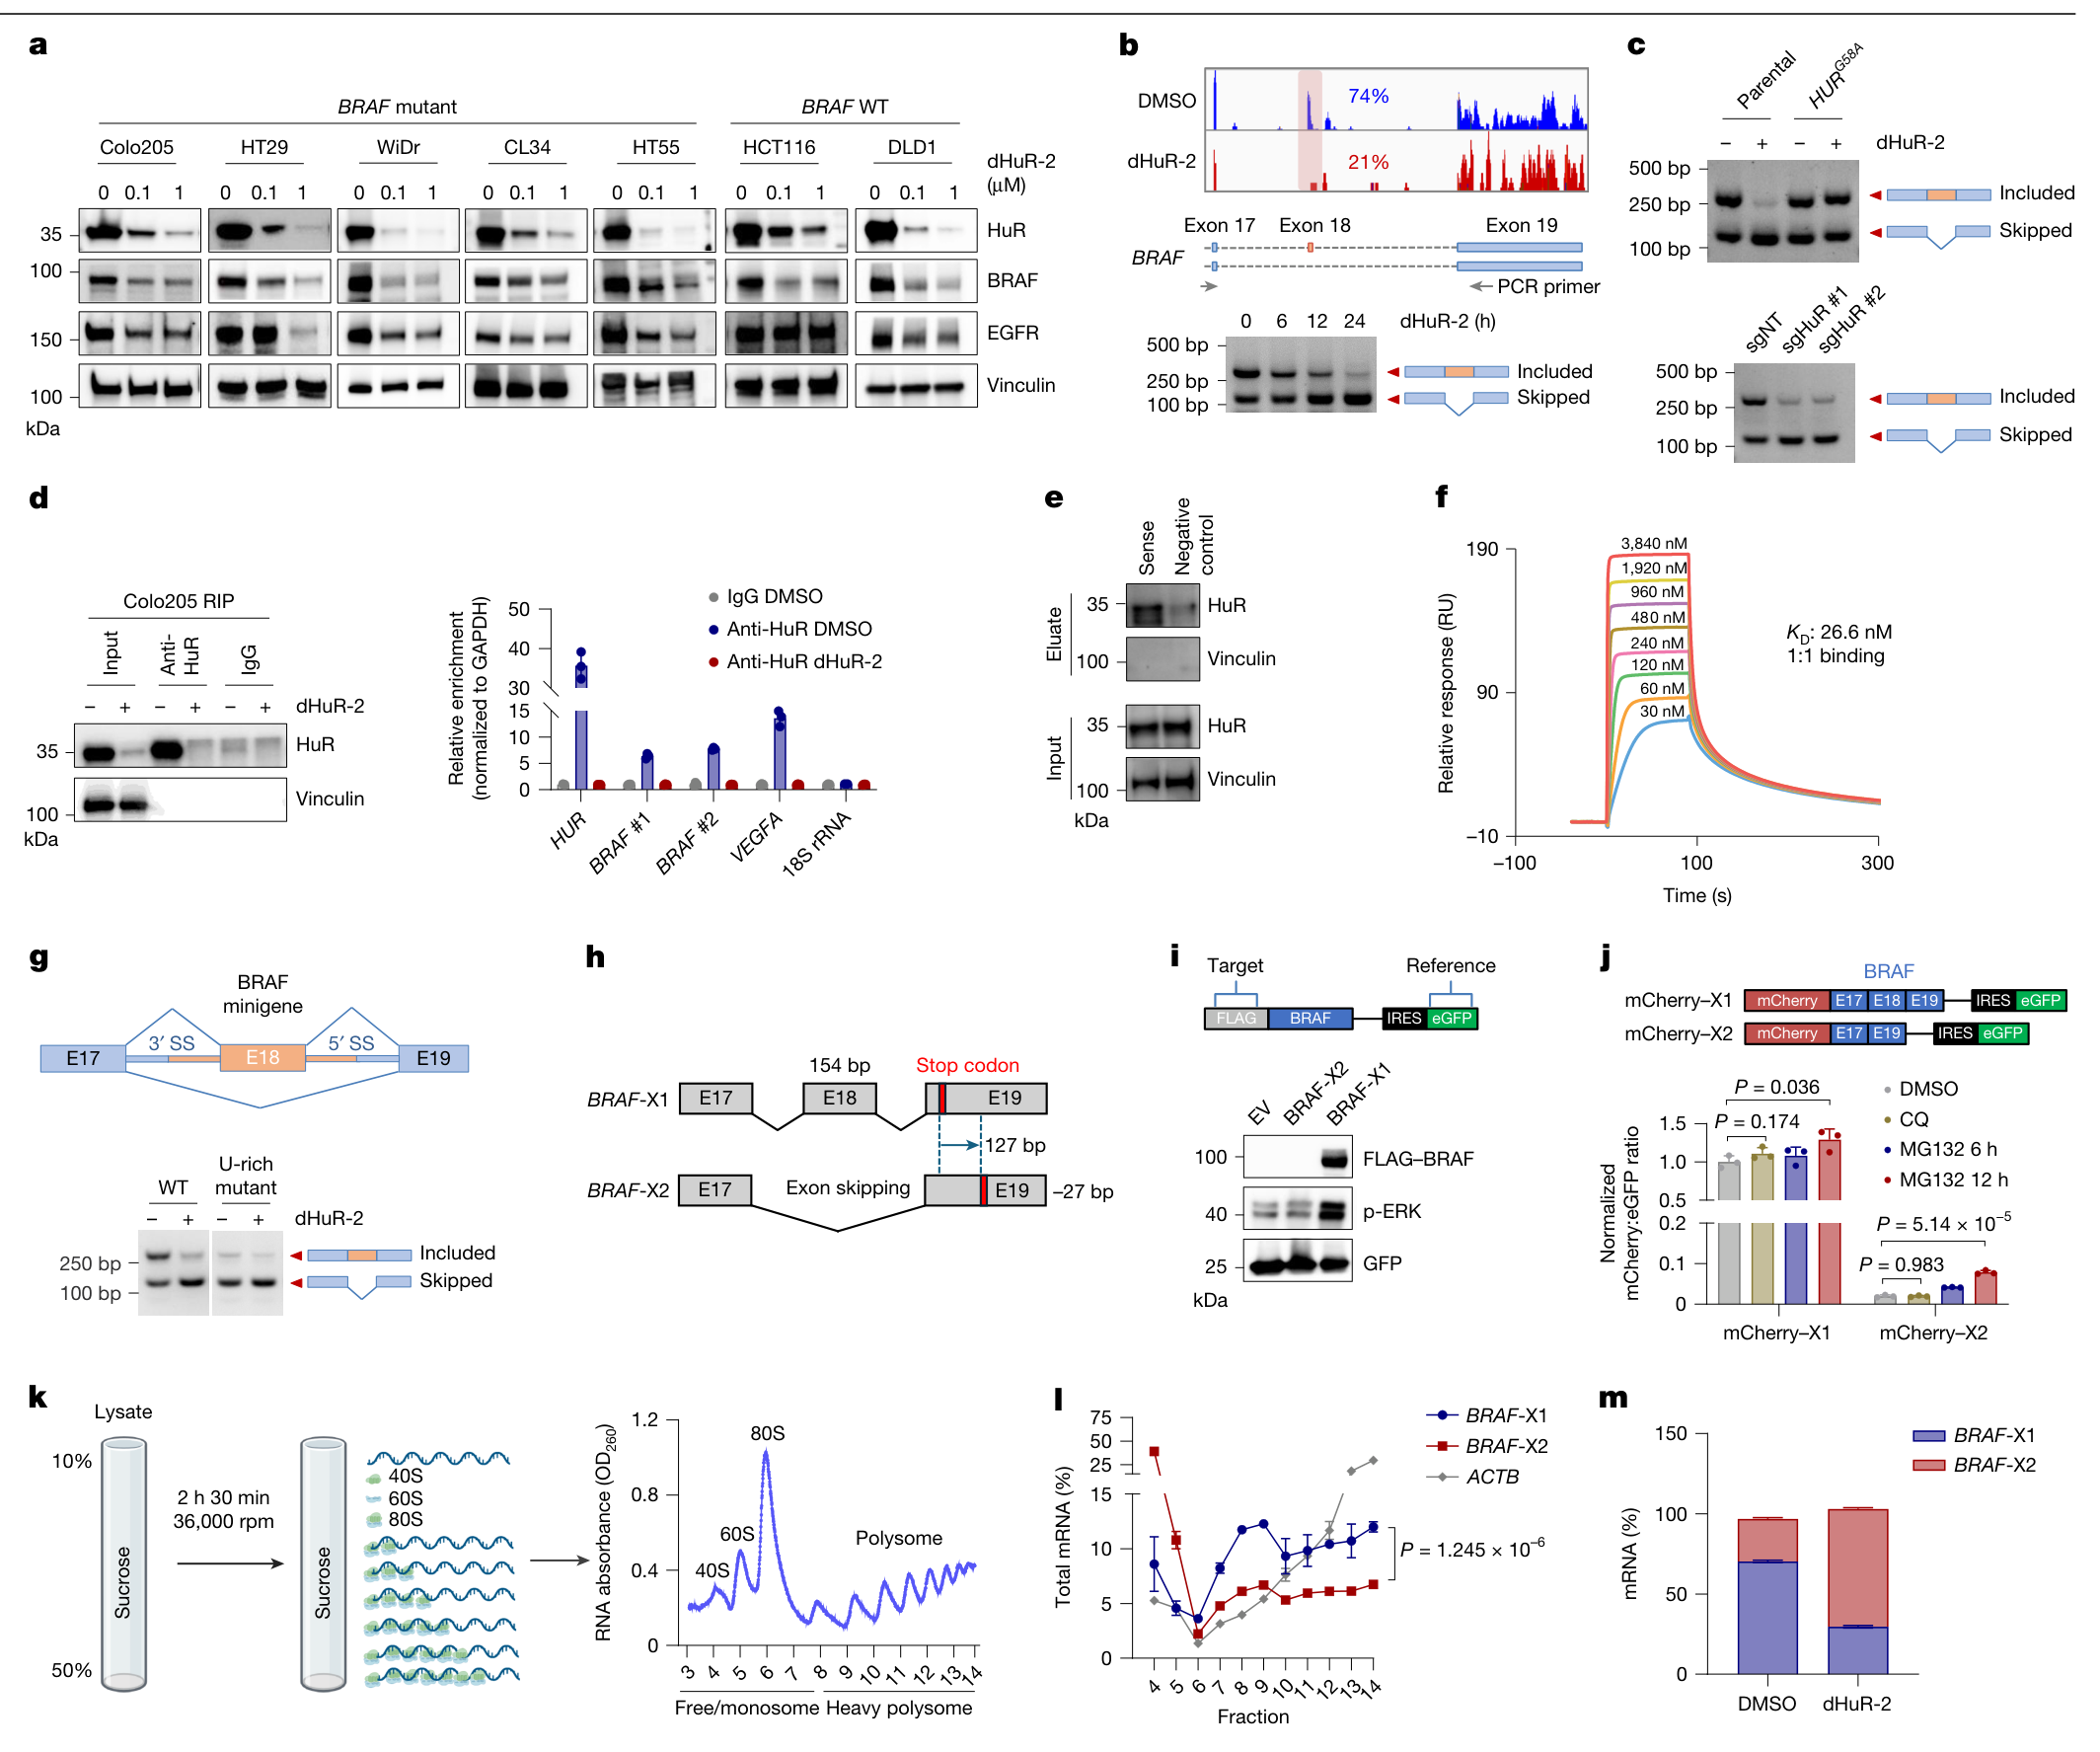
dHuR-2降低多个CRC细胞系的BRAF蛋白。Colo205中总BRAF mRNA在所测条件下未见显著变化,ActD实验也未显示清晰的稳定性改变;新合成蛋白标记则显示BRAF蛋白产出下降。RNA-seq与RT–PCR进一步定位到外显子18跳读:图4b展示的外显子18包含比例由74%降至21%。(图4a、b;扩展图7a–c)
机制证据来自三组实验:Colo205的RIP支持HuR结合BRAF RNA;含内含子17富U区域的RNA可拉下HuR,SPR测得该RNA与HuR的KD为26.6 nM;在minigene中删除或改变富U区域,会使dHuR-2引起的剪接变化减弱或消失。HuR敲除复现跳读,HuR G58A则保护原有剪接模式。(图4c–g;扩展图7e)
外显子18长度为154 bp,跳读后终止密码子位置改变,形成BRAF-X2。相较保留外显子18的X1,X2的蛋白及p-ERK读出更低;X2 RNA更偏向单核糖体、较少进入重多聚核糖体,支持翻译产出下降。蛋白酶体抑制对X2末端报告蛋白有部分恢复,提示蛋白稳定性也可能参与。(图4h–m)
功能救援进一步连接剪接与抑瘤:在MDST8中表达不含内含子的外源BRAF V600E编码序列,可保留p-ERK并救援大部分生长抑制;给构建体加入内含子17后,它重新对HuR降解敏感。救援构建体明确为V600E;MDST8内源BRAF分型在原文不同位置存在差异。(扩展图7i、j及扩展图9c、f)
5. 耐药模型保留HuR依赖,联合治疗增强通路抑制
作者通过长期递增dabrafenib暴露建立耐药细胞。WiDr、HT29、MDST8及黑色素瘤SH4的耐药模型仍保留对dHuR-2的反应,幅度随细胞背景变化;WiDr中HuR或BRAF敲除也抑制耐药细胞的克隆形成。dHuR-2处理Colo205后,HuR、BRAF和p-ERK的降低可持续到第8天。(图5a–c;扩展图9a、b、h)
dHuR-2与dabrafenib在Colo205、Colo201、HT29和WiDr的剂量矩阵中显示Loewe协同评分约13–14。联合后MAPK转录特征及蛋白信号抑制更强,其中图5f的RNA-seq每条件为2个生物学重复。(图5d、f、g;扩展图10a)
动物联合实验使用另一个工具化合物dHuR-3:一个BRAF V600E患者来源异种移植模型,每组6只小鼠,dHuR-3 25 mg/kg与encorafenib 30 mg/kg每日口服一次、共25天。联合组平均肿瘤体积由起始约99 mm³降至第25天34.0 mm³;同期dHuR-3、encorafenib和载体组分别为219.5、470.5和2229.7 mm³,均为源表均值重算。(图5e;Source Data)
HT29的激酶CRISPR筛选还提示EGFR等联合靶点。图5i使用gefitinib或MEK162验证联合抑制克隆形成;扩展图10f使用erlotinib或MEK162进行剂量矩阵分析。联合效应随背景而变化,例如Colo201的erlotinib组合平均Loewe评分为8.4,落在相加范围。(图5h、i;扩展图10f)
HuR还有BRAF以外的作用:其降解降低VEGFA成熟RNA和分泌蛋白,并伴随Colo205移植瘤CD31微血管密度下降;组织定量为每组5个肿瘤、每个肿瘤5个视野。这些变化提示抗血管生成可能参与体内抑瘤。(扩展图8)
局限与待解问题
- 疗效主要来自细胞和免疫缺陷小鼠异种移植。耐药细胞由实验室诱导;联合PDX仅一个模型,文中未说明它来自临床BRAF抑制剂耐药患者。临床耐药异质性、持久缓解和生存获益仍待评估。
- dHuR-2也降解ZFP91和ZMYM2。HuR抗降解突变及BRAF救援支持主要机制,但BRAF救援并不完全,VEGFA和其他HuR网络也可能影响疗效。
- 人鼠BRAF内含子17的富U区域不保守。在表达人的CRBN、可降解HuR的鼠MC38细胞中,鼠Braf仍未出现相同跳读,评估宿主效应时需要同时考虑降解识别与RNA调控的物种差异。(扩展图7f)
- dHuR-3耐受性观察仅7天,野生型和杂合Crbn敲入组各3只、纯合敲入组2只;出现轻度体重下降,并在多个正常器官见HuR降低。长期、组合治疗及正常组织影响仍需更完整资料。(补图1)
- MDST8在扩展图9c标为BRAF V600K,9f图注将其列入V600E;Cellosaurus也记录V600E。内源分型需作者澄清。该系仍被数据库列为结肠癌,但一项跨组学细胞系研究提示其可能具有皮肤/黑色素瘤来源,因而MDST8救援实验的CRC特异外推需保留模型身份的不确定性。
- 原文个别统计标注及方法说明存在差异。例如扩展图6a的两项GSEA所示P值/FDR为0.1507和0.1654,未达到0.05,宜描述为负向富集趋势;这与图3g的下调基因KEGG分析是不同检验。盲法、DepMap版本和图5a浓度单位等核对记录见可展开的阅读记录。
临床候选物DEG6498与本文工具化合物分别记录。截至2026年10月5日,登记试验NCT07244835为招募中的Ⅰ期剂量递增和扩展研究,尚无登记结果发布;本文未报告患者疗效。
新线索
本研究把HuR的RNA加工功能与BRAF驱动依赖连接起来:干预发生在蛋白降解和转录本剪接两个层次,最终汇合于MAPK信号。领域上的后续问题是哪些BRAF突变肿瘤真正依赖这一剪接调控,以及正常组织中的HuR依赖如何影响治疗窗口。
三篇相关原始研究提供不同入口:
- Prahallad等,2012:Unresponsiveness of colon cancer to BRAF(V600E) inhibition through feedback activation of EGFR,对应本文的EGFR反馈与联合抑制背景。
- Fletcher等,2023:A TRIM21-based bioPROTAC highlights the therapeutic benefit of HuR degradation,提供另一种HuR降解工具及其生物学研究。
- Kassabri与Benhamou,2025:Druglike Molecular Degraders of the Oncogenic RNA-Binding Protein HuR,介绍与本篇CRBN单价分子胶不同的HuR降解化合物设计。
这些文献已核实书目与摘要或相关段落,尚未完成全文及附件精读。
图源:Lu等,Nature 655,780–789(2026),DOI。保留原图内容,原文采用CC BY-NC-ND 4.0许可。
主图与表格 · 5 张
图1 · PDF 第 3 页
Fig. 1 | Identification of dHuRs. a, HTRF-based primary screen of a compound library (1.6 µM) for CRBN binders. Cpds, compounds. b, Schematic of the proteomic screen in CRBN WT versus CRBN-KO cells treated with compound pools (left), and volcano plots showing protein abundance changes in JHH-7 CRBN WT (middle) or CRBN-KO (right) cells. LC–MS/MS, liquid chromatography– tandem mass spectrometry; TMT, tandem mass tag. c, Chemical structure and molecular weight (MW) of dHuR-1 (1). d, Immunoblot of HuR in JHH-7 cells treated with dimethyl sulfoxide (DMSO) or dHuR-1. e, Immunoblot of HuR in JHH-7 cells treated with dHuR-1 (10 µM) with or without MLN4924 (1 µM; a NEDD8 inhibitor) or MG132 (10 µM; a proteasome inhibitor). f, Quantified immunoblot of HuR in JHH-7 CRBN WT and CRBN-KO cells treated with cycloheximide (CHX; 100 µg ml−1) in the presence or absence of dHuR-1 (10 µM) over time (0–8 h). g, Schematic of the chemical structures of 2–7 generated by appending the dHuR-1 tail moiety to the core scaffold of Poma or lenalidomide (Lena; left). HTRF-measured binding affinity of the indicated compounds to CRBN (left y axis) and HiBiT-based quantification of HuR degradation (right y axis) are also shown (right). h, Chemical structure and MW of dHuR-2 (8), an optimized degrader. i, Volcano plots of protein abundance changes in KP4 cells treated with dHuR-1 or dHuR-2 (10 µM, 2 h). P values were determined by two-tailed, unpaired Student’s t-test (b,i). Grey dotted lines indicate cut-off of fold-change (FC) and P value (b,i). For gel source data, see Supplementary Fig. 2.
图2 · PDF 第 4 页
Fig. 2 | Characterization of CRBN–MGD–HuR ternary complex formation. a, NanoBRET assay comparing ternary complex formation between CRBN and either WT HuR or the HuR(G58N) mutant induced by 10 μM dHuR-1. Data are presented as mean ± s.d.; n = 3 biologically independent samples. P values were determined by two-tailed, unpaired Student’s t-test. BRET, bioluminescence resonance energy transfer. b, TR-FRET assay showing ternary complex formation between His–DDB1–CRBN and GST–HuR induced by various concentrations (8 to 0.0005 μM, fourfold dilutions) of dHuR-1 or dHuR-2. c, Western blot detection of polyubiquitinated HuR after incubation with recombinant E1, E2 and E3 enzymes ± 100 μM dHuR-2 (2 h at 30 °C). For gel source data, see Supplementary Fig. 2. Ub, ubiquitin. d, Cryo-EM map of DDB1–CRBN bound to HuR and dHuR-2 (the DDB1 BPB domain was masked out). e, Binding pocket of dHuR-2 in the ternary complex. Key interacting residues are shown in stick representation, and Cα of G58 is shown in sphere representation. Hydrogen bonds are depicted as dashed lines. f, dHuR-2 (green) induced a tight protein– protein interaction between CRBN (grey) and HuR (pink). DDB1 was omitted for clarity. g, Binding of dHuR-2 created an additional buried surface area at the protein–protein interface between CRBN and HuR. The buried surface from the binding of dHuR-2 (light brown) was compared with the buried surface between CRBN and HuR (purple).
图3 · PDF 第 5 页
Fig. 3 | HuR degradation exhibited selective efficacy in BRAF-mutant CRC and suppressed MAPK signalling. a, DepMap analysis revealed preferential sensitivity of BRAF-mutant tumour cells to HuR deletion. Data represent the difference in HUR CRISPR scores between mutant and WT cell lines with case numbers indicated. P values were calculated by two-tailed, unpaired Student’s t-test. Data were from DepMap (DepMap_Public_23Q2+Score and Mutation_22Q2_Public; https://depmap.org/portal/). Dashed lines indicate cut-off for effect of gene aberration and P value. b, Growth inhibition of dHuR-2 in BRAF-mutant and WT cell lines over 8 days. Data were normalized to DMSO control. Data are presented as mean ± s.d.; n = 3 biologically independent samples. c, 3D spheroid growth assay of Colo205 cells stably expressing control single-guide RNA (sgRNA; sgCtrl) or HUR-targeting sgRNA (sgHuR) with or without doxycycline (Dox; 200 ng ml−1) induction (left). Data are presented as mean ± s.d.; n = 3 biologically independent samples. P values were determined by two-tailed, unpaired Student’s t-test. Immunoblot confirmed HuR depletion post-induction (right). d, Immunoblot analysis of HuR degradation in parental Colo205, CRBN−/− and HURG58A cells treated with dHuR-2 for 24 h. Vinculin served as a loading control. e, Corresponding 3D spheroid inhibition by dHuR-2 (0.001–1 μM) in Colo205 parental versus HURG58A cells over 8 days. f, Tumour growth curves in Colo205 xenografts (n = 6 per group) treated with vehicle or dHuR-2 (6.25–25 mg kg−1, b.i.d.) for 28 days. Data show mean tumour volume ± s.e.m. mpk, mg kg−1; p.o., oral administration. g, KEGG pathway enrichment analysis of downregulated genes in Colo205 cells treated with dHuR-2 (1 μM, 96 h) versus DMSO control. The top ten enriched pathways are shown (false discovery rate < 0.05). h, Immunoblot analysis of MAPK pathway components in Colo205 parental and HURG58A cells treated with dHuR-2 (0.1 or 1 μM, 6 days). For gel source data, see Supplementary Fig. 2.
图4 · PDF 第 6 页
Fig. 4 | HuR regulated BRAF splicing through direct RNA binding. a, Immunoblot analysis of HuR, BRAF and EGFR protein levels in BRAF-mutant and WT CRC cell lines treated with DMSO or dHuR-2 for 8 days. Vinculin served as a loading control. b, RNA-seq tracks of the BRAF exon 17–19 region with percent spliced in (top). RT–PCR analysis of BRAF transcripts with exon 18 included or skipped in Colo205 cells treated with 1 μM dHuR-2 over time (6–24 h) (bottom). Red shading highlights the region (around BRAF exon 18) with number of reads altered notably upon dHuR-2 treatment. c, RT–PCR analysis of the abundance of BRAF transcripts with exon 18 included or skipped in HURG58A (top) or HUR-KO (bottom) Colo205 cells. sgNT, non-targeting sgRNA. d, Quantitative PCR (qPCR) analysis of bound RNAs from IgG or HuR pull-downs in Colo205 cells treated with or without dHuR-2. RIP, RNA immunoprecipitation. e, Immunoblot of HuR pull-downs using biotinylated BRAF intron 17 RNA (containing U-rich element) versus scrambled control. f, Sensorgrams of HuR binding to a U-rich element derived from BRAF RNA (3.84 to 0.03 μM, twofold dilutions). RU, response unit. g, BRAF minigene diagram (top), and RT–PCR analysis of BRAF minigene variants (WT versus U-rich mutant) in 293T cells treated with 1 μM dHuR-2 (24 h; bottom). For the U-rich mutant, the 20-bp U-rich sequence upstream of the 3′ splice site (SS) was mutated to UCUCUCUCUCUCUCUCUCUC. h, Schematic of the BRAF 3′ region showing exon 18-included (X1) and exon 18-skipped (X2) isoforms. Skipping of the 154-bp exon 18 shifts the stop codon by 127 bp, yielding a 27-bp shorter BRAF-X2. i, Schematic of FLAG–BRAF (X1 or X2)–IRES–eGFP reporter constructs (top). Immunoblot analysis of 293T cells expressing BRAF isoforms, showing FLAG–BRAF and p-ERK levels (bottom). j, Dual-fluorescence reporters of the BRAF C terminus (exons 17–19) for X1 or X2 (top). Flow cytometry of mCherry normalized to eGFP in cells treated with DMSO, CQ (10 μM, 24 h) or MG132 (10 μM) is also shown (bottom). k, Polysome profiling of Colo205 cell lysates (10–50% sucrose). The absorbance (optical density at 260 nm (OD260)) trace shows peaks of 40S, 60S and 80S monosomes and polysomes. Fractions analysed in subsequent panels are indicated along the x axis. Schematic created in BioRender; Wang, X. https://biorender.com/prnw9m6 (2026). l, Distribution of BRAF-X1 and BRAF-X2 mRNAs across polysome fractions quantified by RT–qPCR. ACTB mRNA served as a positive control for translationally active transcripts. Data are presented as the percentage of total mRNA in each fraction. m, RT–qPCR of BRAF isoform switch (X1/X2) in Colo205 cells ± dHuR-2 (1 µM, 24 h). Data are presented as mean ± s.d.; n = 3 biologically independent samples (d,j,l,m). P values were determined by two-tailed, unpaired Student’s t-test. For gel source data, see Supplementary Fig. 2.
图5 · PDF 第 7 页
Fig. 5 | HuR degradation overcomes BRAFi resistance through sustained pathway suppression. a, Dose–response curves for the cell viability of parental and BRAFi-resistant WiDr cells treated with dabrafenib (0.1–100 nM), encorafenib (0.1–100 nM) or dHuR-2 (0.01–10 μM) for 6 days. b, Immunoblot of HuR, BRAF and p-ERK levels in Colo205 cells treated with 1 μM dHuR-2 from 3 h to 8 days. HSP70 served as a loading control. c, Colony formation assay of parental and BRAFi-resistant WiDr cells transduced with sgCtrl or sgHuR after 14-day culture (left), and immunoblot confirmation of HUR-KO efficiency (right). d, Relative cell viability of Colo205 cells treated with dabrafenib (0.1−10 nM) ± dHuR-2 (0.1 or 0.3 μM) for 6 days. e, Tumour growth curves of BRAFV600E patient-derived xenograft (PDX) treated with vehicle, dHuR-3 (25 mg kg−1, q.d.), encorafenib (30 mg kg−1, q.d.) or a combination for 25 days. q.d., once daily. n = 6 animals pre group. Data show mean tumour volume ± s.e.m. f, KEGG signature score of the MAPK pathway in Colo205 cells treated for 96 h with DMSO, 1 μM dHuR-2, 3 nM dabrafenib or both. Sequencing was performed for biological duplicates. The boxplots show the median (centre line), interquartile range (box) and full data range (whiskers). Individual data points are overlaid. g, Immunoblot of MAPK pathway components in Colo205 cells treated with 1 μM dHuR-2, 3 nM dabrafenib or both. Vinculin served as a loading control. h, Scatter plot of synthetic lethal genes to dHuR-2. The x axis shows the gene essentiality score shown as log2 fold change (log2FC; DMSO day (D) 12 versus DMSO D0) and the y axis indicates the sensitive score shown as log2FC (dHuR-2 D12 versus DMSO D12). Synthetic lethal genes to dHuR-2 are marked with red dots. i, Colony formation in HT29 cells treated with dHuR-2 (1 μM), gefitinib (3 μM), MEK162 (10 nM) or both for 14 days. j, Diagram illustrating the mechanism of action of dHuRs synergy with BRAFi, EGFRi or MEKi via mediating BRAF exon 18 skipping. Diagram created in BioRender; Wang, X. https://biorender.com/wk9d06q (2026). For gel source data, see Supplementary Fig. 3.
完整阅读记录与证据表
文献卡:Molecular glue degraders of HuR suppress BRAF-mutant colorectal cancer
- Paper ID:p-0024-art-molecular-glue-degraders-hur-suppress
- 晨会日期:2026-10-09;接收、分析与核对日期:2026-10-05。
- 使用流程:article-read、morning-report、pdf、spreadsheets、web-publish。
- 书目:Lu等;Nature 655,780–789(2026);在线2026-06-10;DOI 10.1038/s41586-026-10613-5。
- 读取范围:来稿31页(正文、参考文献、5主图、10扩展图、9页报告摘要);独立补充信息35页、7补图4补表;独立报告摘要9页;Source Data的3个工作表。同行评议24页仅定点读取,原始组学未下载重算。详细范围和原文差异见coverage.md。
- 人工核对状态:待核对;human_review=pending。
- 图表归档:26张PNG,清单见figures/README.md;网页选5主图。不存在普通主文表格。
一句话结论
CRBN依赖的HuR降解改变BRAF外显子18剪接并降低BRAF蛋白,抑制BRAF突变CRC模型生长;遗传救援支持BRAF剪接贡献,细胞及一个PDX模型支持MAPK通路联合抑制的临床前潜力。
研究问题与背景
BRAF突变CRC对MAPK信号存在依赖,同时RAF抑制后的反馈激活限制通路控制。HuR是RNA结合蛋白,参与多个肿瘤相关RNA的调控。作者考察HuR分子胶降解是否能通过转录后机制抑制BRAF信号,并在耐药背景保留活性。
贡献与比较对象
研究提供CRBN单价分子胶与HuR的结构及降解机制;将BRAF突变依赖与内含子17富U区域、外显子18保留、蛋白产出连接起来。主要比较包括CRBN野生型/敲除、HuR野生型/G58A抗降解突变、HuR敲除、BRAF突变/野生型CRC、BRAF编码序列/含内含子构建体、亲本/实验室诱导耐药细胞及动物单药/联合组。
方法与验证
以CRBN结合筛选和蛋白组发现降解靶点,通过蛋白半衰期、蛋白酶体/CRL抑制、三元复合物检测、体外泛素化和冷冻电镜验证。CRC药物反应用8天细胞生长、三维球体及克隆形成读出;剪接机制使用RNA-seq、RT–PCR、RIP、RNA拉下、SPR、minigene与多聚核糖体分离。动物疗效分别为Colo205 CDX和单一BRAF V600E PDX,每组6只。源表均值/SEM定点重算;未复算作者组学、协同评分及显著性检验。
细胞实验的生物学重复按各图注记录:多数定量为n=3;图5f RNA-seq为n=2;扩展图8h按肿瘤n=5计,不以视野数替代肿瘤数。WiDr源自HT29。MDST8内源BRAF分型存在原文图注与数据库差异,外源BRAF救援构建体明确为V600E;SH4属于黑色素瘤。
核心证据
| 主张或结果 | 数字、单位、条件与比较 | PDF页序/图表 | 依据类型与核对状态 |
|---|---|---|---|
| 发现CRBN依赖的HuR降解 | 库>10,000;约200代表物先筛;JHH-7化合物池比较CRBN WT/KO,再逐化合物验证 | 主PDF 2–3;图1a–f | 正文/原图/图注已核;池筛图示6 h与总方法2 h差异保留 |
| dHuR-2蛋白降解活性 | 正文DC50 3.8 nM、Dmax 96%、HuR减少一半2.45 h;非细胞生长IC50 | 主PDF 2;图1h相关正文 | 正文已核;扩展图1g的Colo205印迹DC50为3.4 nM,属于另项测定 |
| 同时降解其他底物 | KP4,10 μM、2 h,HuR、ZFP91、ZMYM2下降;GSPT1及HuB/C/D在相应测定中保留 | 图1i;扩展图1f–h | 原图/图注已核;未写为HuR专一降解 |
| 三元复合物与泛素化 | TR-FRET EC50 dHuR-1 0.71 μM、dHuR-2 0.13 μM;体外多聚泛素化 | 图2a–c | 原图/图注已核;不同于细胞降解DC50 |
| 结构识别位点 | 3.35 Å(正文约3.3 Å);HuR RRM1/2片段;G58、CRBN E377/V388支持功能 | 图2d–g;扩展图2、3;补表2 | 原图/正文/方法已核;不是全长HuR–RNA复合物 |
| BRAF突变组更敏感 | 13条CRC细胞系,6突变/7野生型;dHuR-2 0.1或1 μM,8天;n=3生物学重复 | 图3b | 原图已核;6突变为Colo205、Colo201、HT29、CL34、WiDr、HT55,WiDr与HT29来源相关 |
| 生长及信号表型需要HuR降解 | CRBN KO或HuR G58A保护HuR蛋白;球体生长及BRAF/EGFR信号的保护由G58A实验支持 | 图3c–e、h | 遗传对照/原图已核 |
| dHuR-2单药抑制CDX生长 | Colo205,n=6/组;6.25/12.5/25 mg/kg口服每日2次,治疗28天 | 图3f;Source Data表1 | 图注/原图已核;源表末次体积为第27天,仍高于基线 |
| MAPK通路及细胞周期改变 | 下调基因KEGG FDR<0.05;p-ERK下降;G1比例升高 | 图3g、h;扩展图6 | 原图已核;扩展图6a GSEA P/FDR>0.05,与其图注“显著”不一致 |
| BRAF外显子18跳读增加 | Colo205:所示PSI 74%→21%;RT–PCR 6–24 h;HuR KO复现、G58A保护 | 图4b、c | RNA-seq图示及PCR原图已核;比例指外显子包含,不是患者应答率 |
| 结合富U区域参与剪接 | Colo205 RIP;内含子17 RNA拉下;SPR HuR–RNA KD 26.6 nM;minigene位点改造 | 图4d–g;扩展图7d–f | 原图/图注已核;公共eCLIP来自HepG2/K562,非本研究CRC eCLIP |
| X2产出较低 | 跳过154 bp外显子;终止位点移127 bp,编码区净短27 bp;X2偏单核糖体、蛋白/p-ERK低;MG132部分恢复末端报告蛋白 | 图4h–m | 原图已核;支持翻译变化并保留稳定性贡献,不作NMD实验证实 |
| BRAF剪接参与生长抑制 | MDST8;外源FLAG-BRAF V600E无内含子CDS救援大部分表型,加入内含子17后失去保护 | 扩展图7i、j;扩展图9c、f | 外源V600E明确,内源分型存在差异;救援不完全 |
| VEGFA与血管生成改变 | 成熟RNA/分泌蛋白下降;CD31微血管n=5肿瘤/组,每瘤5视野,图示P=0.0061 | 扩展图8 | 原图已核;视野未当作独立动物 |
| 实验室耐药细胞仍有反应 | WiDr、HT29、MDST8及SH4;6天剂量反应;14天WiDr克隆形成 | 图5a、c;扩展图9a、b、h | 原图/图注已核;不报图5a dHuR-2绝对效力,轴与图注单位有矛盾 |
| BRAF抑制剂组合活性 | dHuR-2+dabrafenib,4细胞背景平均Loewe评分14.01、13.01、13.75、13.11;图5f每条件生物学重复n=2 | 图5d、f、g;扩展图10a | 原图/图注已核;未独立复算协同或其P值 |
| dHuR-3组合使一个PDX回缩 | BRAF V600E CO-04-0342;n=6/组;dHuR-3 25、encorafenib 30 mg/kg每日一次,25天 | 图5e;Source Data表2 | 原图/方法/源表已核;该模型未注明为临床BRAFi耐药来源 |
| EGFR/MEK组合随背景变化 | 图5i gefitinib 3 μM、MEK162 10 nM、dHuR-2 1 μM,14天;扩展图10f erlotinib组合Colo201平均Loewe 8.4 | 图5h、i;扩展图10f | 原图/图注已核;评分8.4按相加,不将所有组合概括为协同 |
| 探索性耐受观察 | dHuR-3 25 mg/kg每日一次7天;WT n=3、杂合KI n=3、纯合KI n=2;正常器官HuR下降,轻度体重下降 | 主PDF9;补图1;Source Data表3 | 原图/正文/源表已核;无完整长期毒性实验结果 |
Source Data的定点重算
原始XLSX保持原样。以下为AI从每组6只动物记录计算的均值±SEM,体积单位mm³;SEM用样本标准差除以√6。未对这些数据重做组间或纵向显著性检验。
| 模型/日期 | 载体 | dHuR低剂量/单药 | dHuR中剂量/encorafenib | dHuR高剂量/联合 |
|---|---|---|---|---|
| Colo205 CDX,第27天 | 792.00±178.18 | 6.25 mg/kg:359.33±80.41 | 12.5 mg/kg:259.00±31.32 | 25 mg/kg:203.17±41.22 |
| BRAF V600E PDX,第25天 | 2229.67±343.82 | dHuR-3:219.50±24.21 | encorafenib:470.50±44.55 | 联合:34.00±5.23 |
CDX基线各组均值约105.5–106.2;PDX基线各组约99。CDX记录日27与图注治疗28天分开表述;PDX联合组低于基线,因此描述为回缩。没有撤药后控制或完全清除数据。
局限与待解问题
作者明确指出
实验室诱导耐药模型可能简化患者的复杂耐药机制;HuR调控网络依赖细胞及应激背景;需要更多转录组、蛋白组与生物标志物研究。dHuR-1至dHuR-3是工具化合物,正式毒理仅针对另一个临床候选物DEG6498,本文未提供其完整毒理或患者结果。(主PDF9)
AI推断与理由
单一PDX、免疫缺陷动物和小样本7天体重观察限制外推。BRAF救援不完全、其他CRBN底物降解以及VEGFA等变化,支持多通路贡献仍待分解。人鼠BRAF顺式调控区域不同,改造Crbn仅解决HuR降解识别差异。作者之间及作者与公司的资助、专利/顾问利益关系已在主PDF11披露,后续独立验证有价值。
MDST8在扩展图9c标为V600K、9f图注列为V600E;Cellosaurus CVCL_2588记录V600E。其结肠癌来源在数据库仍保留,但Salvadores等2020的跨组学分类、UV突变特征及药敏分析提示可能为皮肤/黑色素瘤来源。两类资料并存,模型分型和组织归属需澄清,不能将其单独当作无争议的CRC特异救援证据。
DepMap版本、动物盲法、浓度单位及个别统计标注存在原文内部差异,逐项记录在coverage.md。正文使用可直接核实的图表和实验条件,不把冲突改写成一致结论。
待核对问题与后续阅读
- 定点查看的同行评议文件不是完整核读;历史审稿图保留在原PDF,未当作最终新增补图。
- 未下载或重算原始RNA-seq、蛋白组、冷冻电镜数据和作者协同分析。HuR结合网络的eCLIP采用公共数据。
- 2026-10-05核对ClinicalTrials.gov登记NCT07244835及官方API:DEG6498,Ⅰ期、招募中、无登记结果,记录更新日期2026-06-30。患者疗效留待公开结果。
- Prahallad 2012、Fletcher 2023、Kassabri/Benhamou 2025三篇相关原始文献已核实书目与摘要/局部内容,未全文精读,具体链接见reading.md。