研究问题
CD4 T细胞如何参与抗肿瘤反应?常见解释强调辅助CD8 T细胞、促进抗体产生,或直接识别表达MHC-II的肿瘤细胞。本文研究另一条路径:CD4 T细胞能否借助宿主髓系细胞,攻击维持肿瘤生长的血管和间质。
主体实验使用表达LCMV糖蛋白的MC38结肠癌模型,以及识别其中gp66抗原的Smarta CD4 T细胞。作者同时使用免疫细胞缺失、细胞因子敲除、骨髓嵌合和空间组学模型,逐步定位抗肿瘤作用所需的细胞与信号。
| 证据层次 | 主要材料 | 回答的问题 |
|---|---|---|
| 抗原与宿主依赖 | MC38-GP、MHC-II缺失肿瘤、免疫缺陷小鼠 | 是否需要肿瘤直接呈递抗原及其他淋巴细胞 |
| 空间与细胞状态 | Visium、Xenium、单细胞RNA测序、组织成像 | CD4 T细胞在何处组织哪类髓系反应 |
| 信号干预 | Il3/Tnf缺失、抗体阻断、骨髓嵌合 | IL-3与TNF分别由谁提供、作用于谁 |
| 扩展与人材料 | 内源抗原模型、3例CRC与3例卵巢癌空间分析、TCGA | 机制的模型范围与人肿瘤关联 |
抗原识别可以经由宿主细胞完成
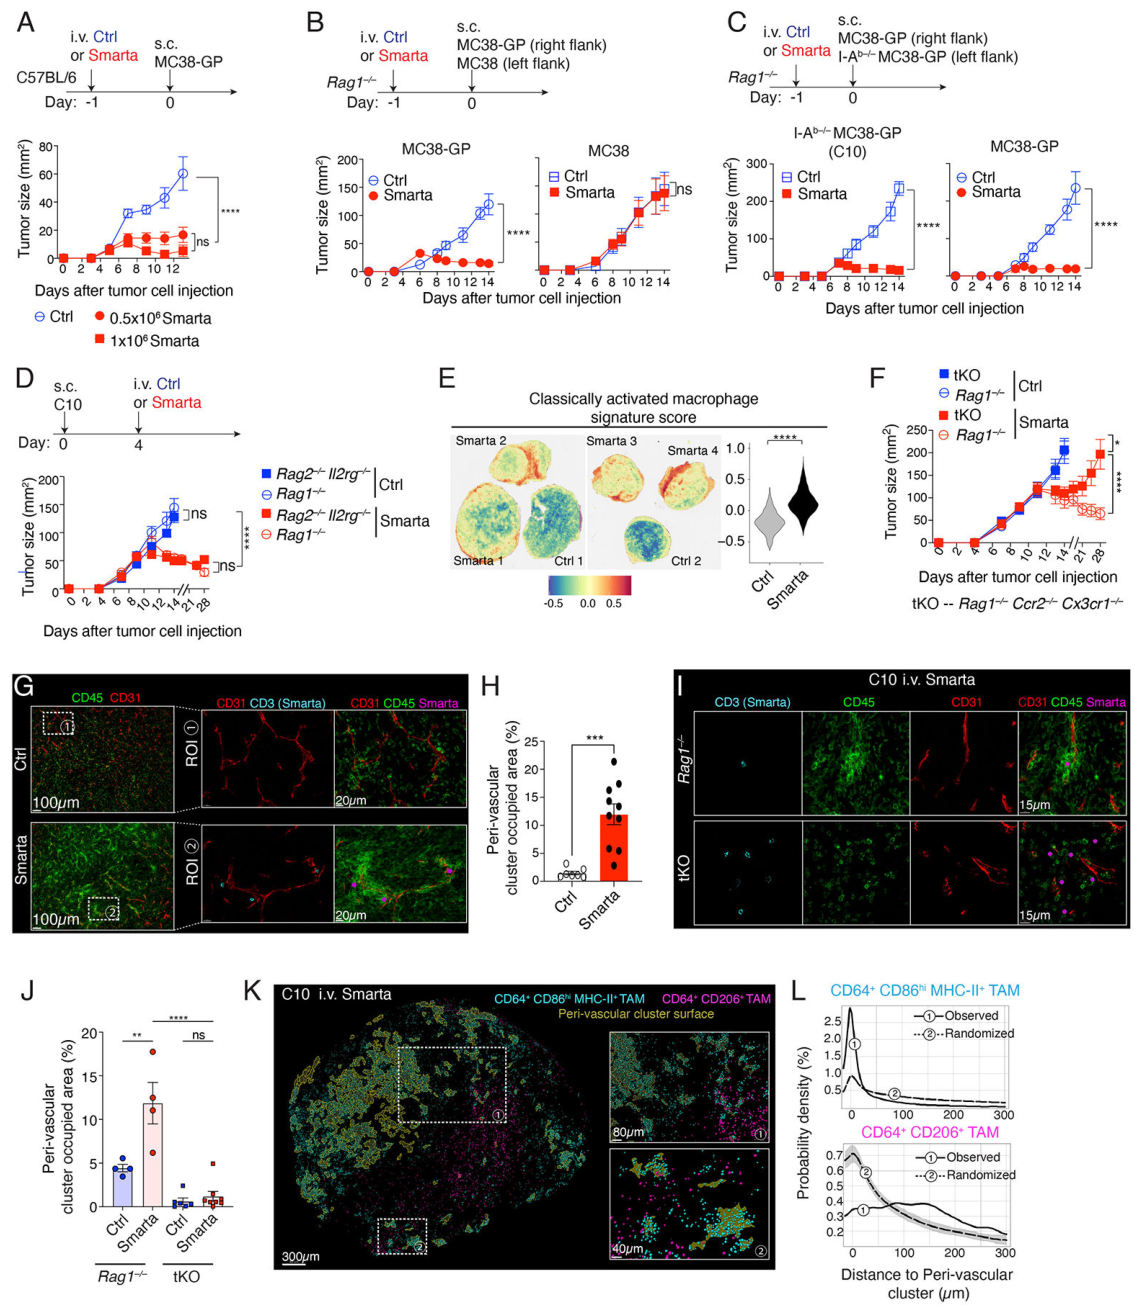
Smarta CD4 T细胞可控制MHC-II阴性的MC38-GP肿瘤。作用也可在缺少T/B细胞,乃至进一步缺少NK和先天淋巴细胞的宿主中观察到。与此同时,同一只小鼠对侧不表达GP的MC38肿瘤未受到相同控制。结果把作用定位于局部抗原驱动的CD4反应,并支持由宿主细胞承担抗原呈递和后续效应。
图1的生长实验包含双侧接种,部分统计单位为肿瘤:例如8个肿瘤来自4只小鼠。空间转录组也采用独立肿瘤样本,不能与同一切片中的细胞、血管或视野数混用。
CD4 T细胞组织血管周围的髓系反应
治疗后,CD4 T细胞与CD64阳性、CD86阳性的巨噬细胞形成血管周围聚集。限制单核细胞募集的宿主遗传模型中,CD4浸润仍存在,但聚集和肿瘤控制减弱。
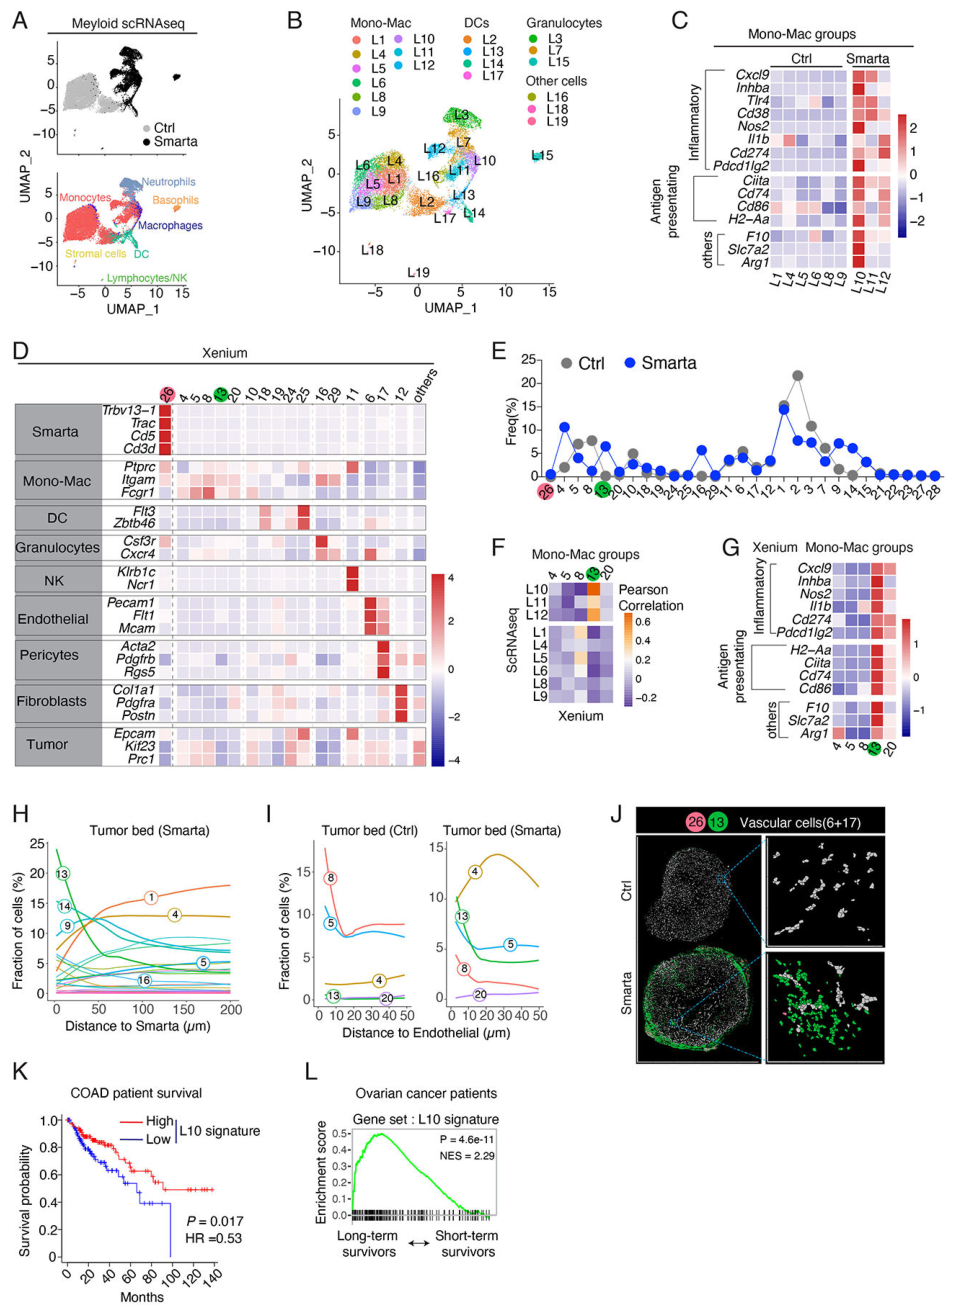
单细胞分析识别出L10炎症性肿瘤相关巨噬细胞状态,同时表达Nos2与Arg1。空间分析将这种状态与CD4邻近区域联系起来。该状态的基因组合比简单的“M1/M2”分类更贴近本文观察。TCGA中283例原发CRC的分析显示,高L10相关表达特征与较好总生存相关;这是患者队列关联。
IL-3负责激活,髓系TNF承担关键效应
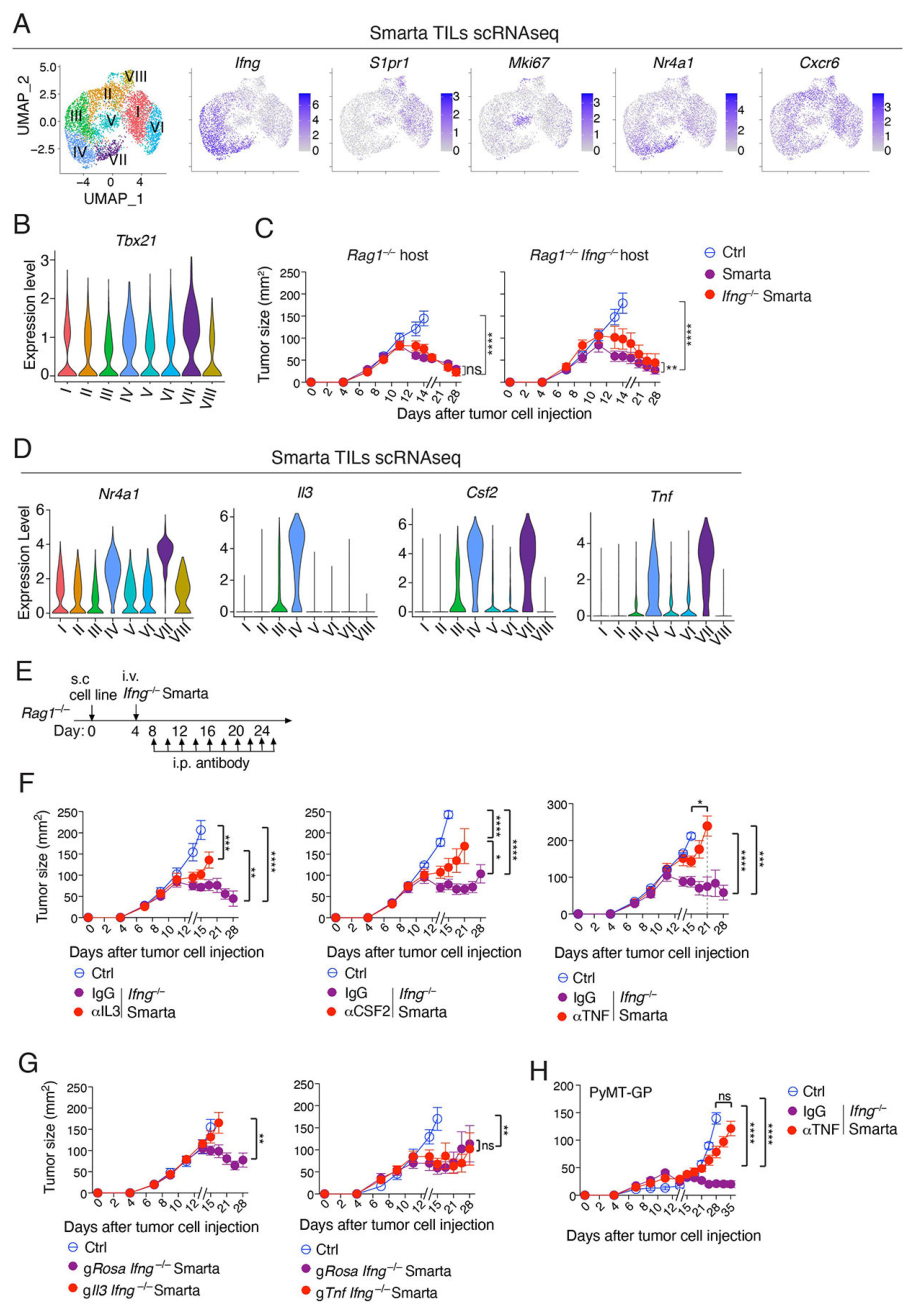
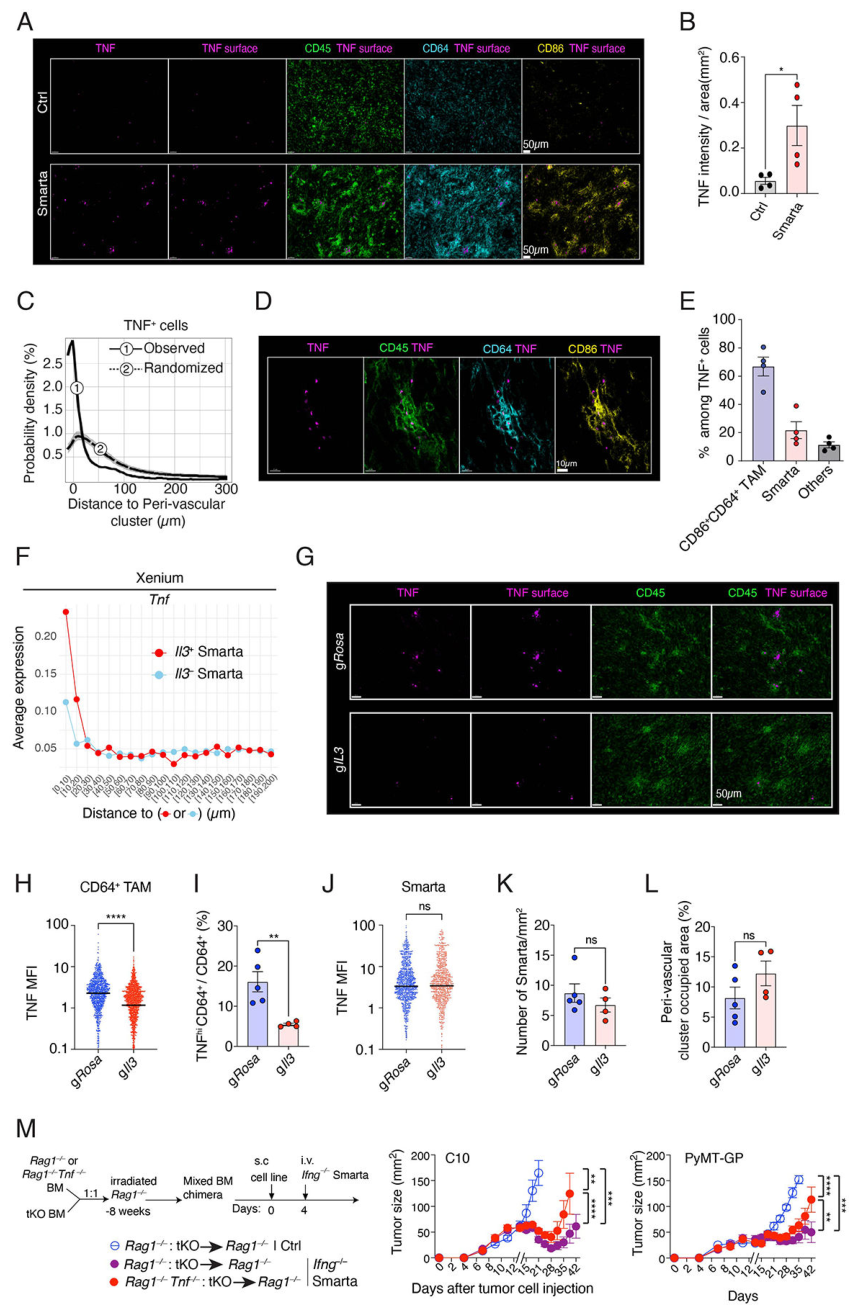
细胞来源是本文最关键的区分。作者用IFN-γ缺失的Smarta CD4 T细胞拆分这条路径。在这一背景下,敲除Il3使髓系细胞TNF下降、肿瘤控制受损,而聚集结构仍可形成。IL-3在这里主要参与效应状态的建立。
在IFN-γ缺失T细胞中进一步敲除Tnf,抗肿瘤作用仍在;宿主Tnf缺失或骨髓嵌合限制募集单核细胞的TNF来源时,肿瘤控制受损。由此,关键TNF来源定位于宿主髓系细胞。IFN-γ完整时,TNF中和仍削弱长期肿瘤控制,但效应出现较晚。CSF2的支持证据来自抗体阻断,遗传敲除并未在本文成功完成。
TNF的主要作用落在血管间质
肿瘤细胞缺失TNFR1/2后仍可被控制。组织成像则显示血管扩张、红细胞外渗、周细胞及内皮凋亡、周细胞覆盖减少,以及凝集素标记的灌注下降。低灌注区域伴随缺氧和肿瘤细胞死亡;TNF中和可缓解这些变化。
作者将TNFR1完整的Rag1缺陷骨髓移入Rag1/TNFR1双缺陷宿主,以Rag1单缺陷宿主作对照。接受IFN-γ缺失Smarta细胞后,双缺陷宿主的血管损伤与肿瘤控制受损,支持非造血组织上的TNFR1参与这条路径。该实验尚未细分为内皮或周细胞专属受体作用。
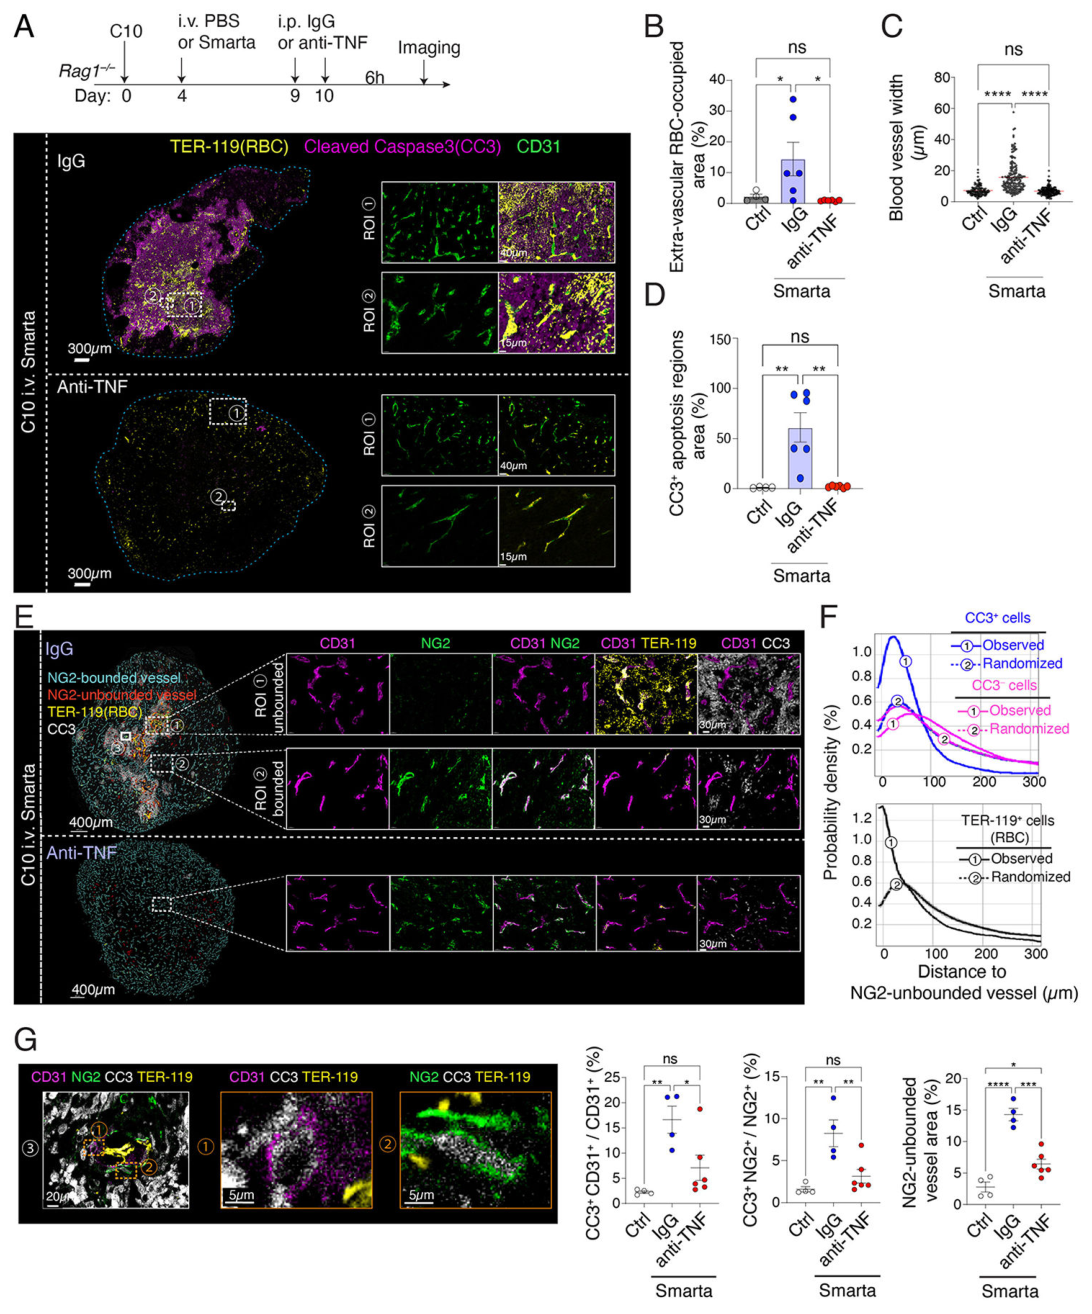
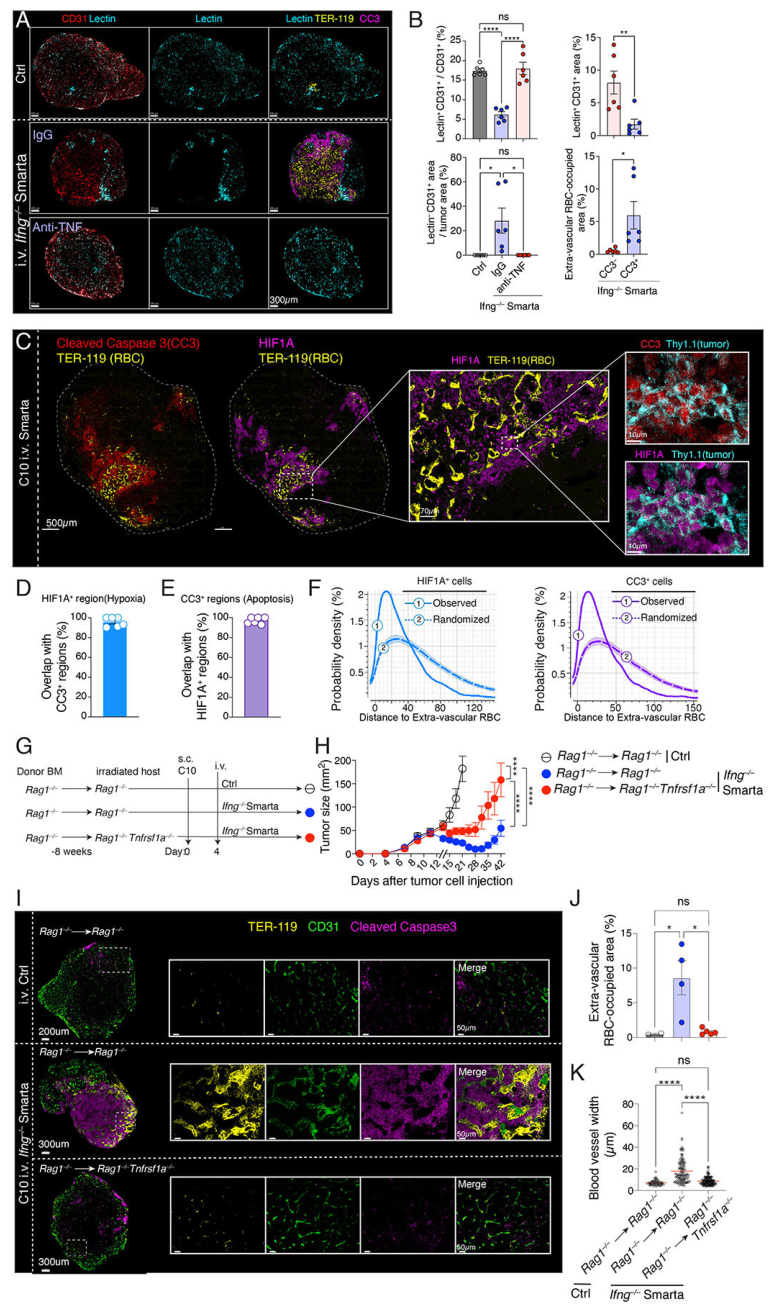
机制可概括为:**局部抗原识别 → 血管周围CD4—髓系聚集 → CD4来源IL-3 → 髓系TNF → 非造血组织TNFR1信号 → 血管损伤与灌注下降 → 肿瘤死亡。**其中聚集、细胞因子来源和受体所在组织分别有不同干预证据。
从模型扩展到人肿瘤
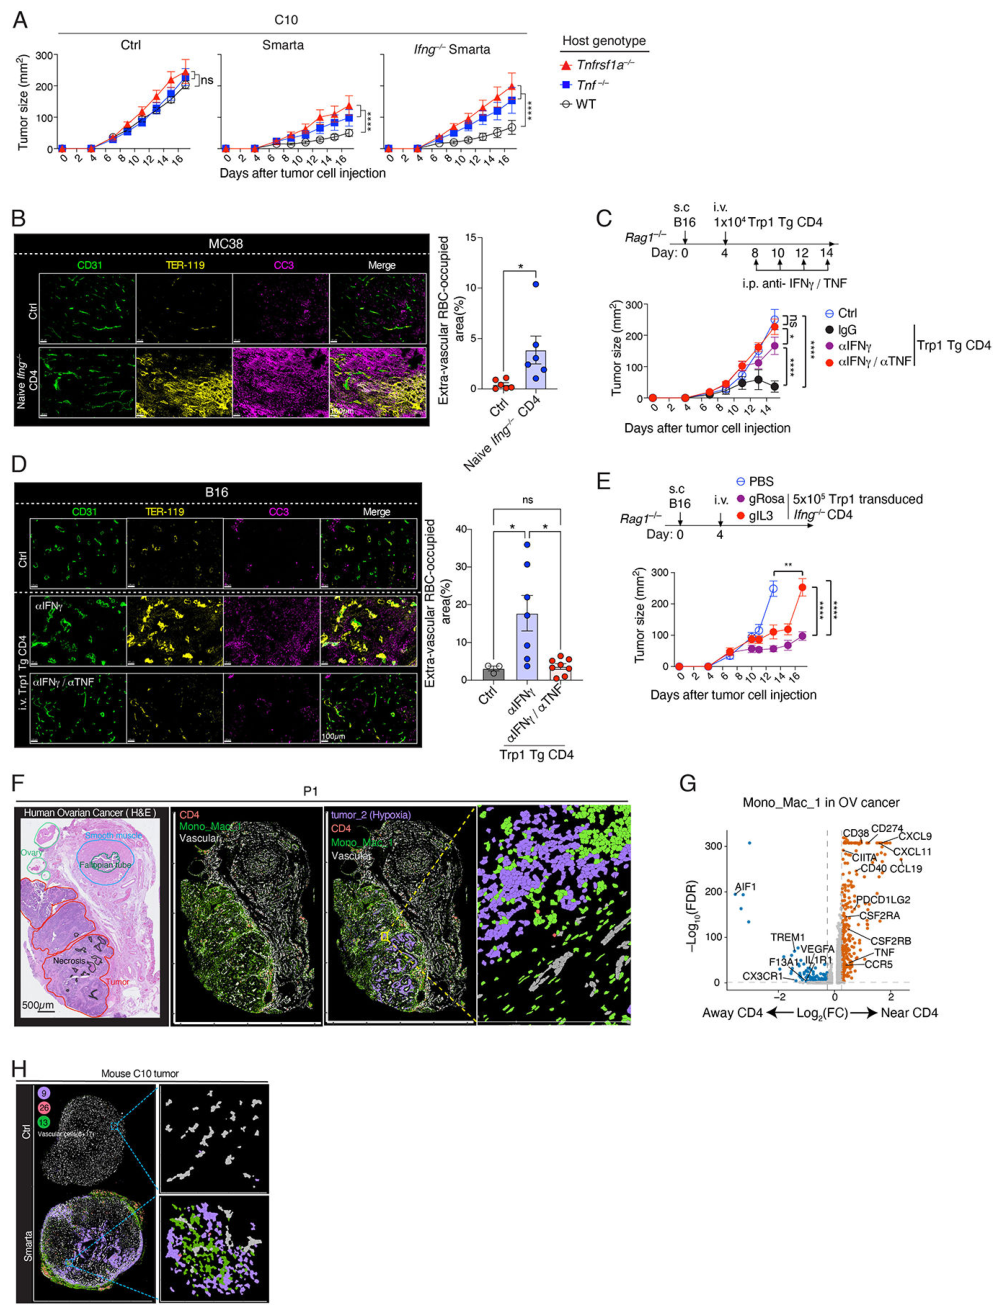
作者进一步考察了不表达GP的MC38与多克隆CD4 T细胞、B16的Trp1抗原模型及乳腺肿瘤模型,使观察范围超出最初的人工抗原体系。
人材料中,3例CRC和3例卵巢癌也可见血管附近的CD4与单核/巨噬细胞结构。两癌种的空间检测面板不同,缺氧相关分析主要来自卵巢癌材料。人样本为小规模观察,机制因果链主要由小鼠干预建立。
局限与待解问题
人工高亲和力抗原与T细胞转移构成主体证据,后续需要检验自然免疫反应和不同抗原强度下的适用范围。骨髓嵌合还受到照射与血管修复的影响;周细胞先受损的时间顺序主要由静态组织图像推断。血管损伤的抗肿瘤作用与正常组织安全性需共同评估。
人组织的空间相似性、TCGA表达特征和卵巢癌生存关联,为转化研究提供线索;预测价值、治疗选择标准及干预安全性仍待独立研究。本文的独立补图、补表和视频尚未取得,本页依据42页作者稿中的正文、方法及全部8张主图。
进一步理解
本文把CD4效应的研究对象从肿瘤细胞扩展到肿瘤所依赖的宿主组织。基于结果,一个值得追问的方向是:抗原呈递、髓系募集和血管易损性是否共同决定这一反应的覆盖面,以及哪些环节会成为不同肿瘤间的限制因素。这是对实验结构的分析,尚无相应患者分层验证。
原文:CD4+ T cells impair tumor growth via IL-3 and TNF-dependent vascular damage
主图与表格 · 7 张
图1 · PDF 第 26 页
Fig. 1: CD4+ T cells control tumor growth and induce perivascular myeloid clusters. (A) (top) Experiment schematic; (bottom) Tumor size in B6 mice injected with 0.5×10⁶ MC38-GP cells one day after injection of the indicated number of naïve Smarta TCR transgenic CD4+ T cells (Smarta, red lines) or of PBS as a control (Ctrl, blue line). Data are presented as mean ± the standard error of the mean (s.e.m.) from one experiment (n = 4 mice per group), representative of three independent experiments. (B) (top) Experiment schematic; (bottom) Tumor growth in Rag1−/− mice injected with 0.5×10⁶ MC38-GP cells (right flank) and 0.5×10⁶ parental MC38 cells (left flank) one day after injection of 104 Smarta cells (red line) or PBS (Ctrl, blue line). Data are presented as mean ± s.e.m. from one experiment (n = 4 mice per group), representative of two independent experiments. (C) (top) Experiment schematic; (bottom) Tumor growth in Rag1−/− mice injected with 0.5×10⁶ MC38-GP cells (right flank) and 0.5×10⁶ I-Ab–/– MC38-GP (C10, left flank) cells one day after injection of 104 Smarta cells (Smarta, n = 5 mice) or PBS (Ctrl, n = 4 mice). Data are presented as mean ± s.e.m. from one experiment, representative of two independent experiments. (D) (top) Experiment schematic; (bottom) C10 tumor growth in indicated mice receiving PBS (Ctrl) or 104 Smarta cells (Smarta) on day 4 after injection of C10 cells in each flank. Data are presented as mean ± s.e.m. from one experiment (n = 8 tumors from 4 mice per group; two tumors per mouse), representative of two independent experiments. (E) C10 tumors from Ctrl-treated (n = 2 mice) and Smarta-treated Rag1−/− mice (n = 4 mice) were processed on day10 p.t.i. using the 10x Genomics FFPE Visium Spatial technology. (left) Scaled expression of the classically activated macrophage gene signature (color scale at bottom, Table S2). (right) Violin plot of scaled expression of the signature in spots from Ctrl- and Smarta-treated tumors. Data shown are pooled from two independent experiments(see Methods). (F) C10 tumor growth in Rag1−/− (round symbols) or tKO (square symbols) mice receiving PBS (Ctrl, blue symbols) or 1×10⁴ Smarta cells (Smarta, red symbols) on day 4 p.t.i. Ctrl: Rag1−/− and tKO (8 tumors from 4 mice for each genotype). Smarta: Rag1−/− (6 tumors from 3 mice), tKO (10 tumors from 5 mice). Data are presented as mean ± s.e.m. from one experiment, representative of four independent experiments. (G) Representative immunofluorescence staining (for CD45, CD31, CD3) of C10 tumors collected on day 10 p.t.i. in Rag1−/− mice injected with either PBS (Ctrl) or 104 Smarta cells (Smarta) on day 4 p.t.i. Dashed boxes (left) delineate regions of interest (ROI) magnified on the right. (H) Percentage of the tumor section occupied by peri-vascular clusters in experiments shown in (G). Each dot represents a tumor. Data are presented as mean ± s.e.m. from one experiment (n = 7 Ctrl tumors from 4 mice and n = 10 Smarta tumors from 5 mice), representative of at least three independent experiments. (I) High-magnification d10 p.t.i. immunofluorescence analysis, as described in (G), of C10 tumors growing in Rag1−/− mice or Rag1−/− Ccr2−/− Cx3cr1−/− (tKO) mice injected with Smarta cells on day 4 p.t.i. (J) Quantification of peri-vascular cluster areas in experiments shown in (I), as described in (H). Each dot represents a tumor. Data are presented as mean ± s.e.m. from one experiment (n = 4–8 tumors each group from 2–4 mice), representative of two independent experiments. (K) Spatial distribution of inflammatory (CD64+ CD86hi MHC-II+, cyan) and regulatory (CD64+ CD206+, magenta) macrophages in C10 tumors on d10 p.t.i. in Smarta-treated Rag1−/− mice. Peri-vascular cluster areas are shown as deep orange regions and are superimposed by macrophages colored as cyan (inflammatory) or magenta (regulatory). Each dot represents one cell. Two ROI defined on the left are shown at higher magnification on the right. (L) Spatial attraction analysis of inflammatory (top) and regulatory (bottom) macrophages to peri-vascular clusters, plotting the distribution of distances of macrophages to the boundaries of peri-vascular structures as shown in (K). Line ①, observed distribution; line ②, randomized distribution. Negative distances are assigned to cells within cluster boundaries. Data shown are representative of three independent experiments. (A–D, F) P values are calculated with a two-way analysis of variance (ANOVA). (H) P value calculated with a two-tailed, unpaired Student’s t test. (J) P values are calculated with one-way ANOVA. ns P > 0.05, *P < 0.05, **p <0.01, ***p <0.001, ****P < 0.0001.
图2 · PDF 第 29 页
Fig. 2: Tumor transcriptomic profiling. (A-C) scRNAseq analysis of CD11b+ NK1.1− CD45+ myeloid cells isolated from Ctrl- or Smarta-treated C10 tumors in Rag1−/− mice on day 10 p.t.i., sorted as in fig. S6A. Data are pooled from two captures derived from two independent experiments (see Methods). (A) UMAP plot showing cells from Ctrl- and Smarta-treated tumors. Each dot represents a cell and is color-coded by either condition (top) or SingleR-annotated cell type (bottom, as defined in fig. S6C). (B) UMAP plots showing cells from Ctrl- and Smarta- treated tumors, color-coded by groups defined by unsupervised clustering. (C) Row z-scored expression of selected genes of L10 signature among mono-mac groups; color scale on the right. (D-J) Xenium analysis of Ctrl- and Smarta-treated C10 tumors in Rag1−/− mice on day 10 p.t.i. Data shown are pooled from two independent experiments, with a total of n = 2 mice per group (see Methods). (D) Row z-scored expression (color scale on the right) of indicated genes among cell groups defined by unsupervised clustering of single-cell assigned gene expression, performed on the whole data set (4 tumors from 4 mice). Group identity is shown in fig. S7B; “others” refers to pooled cells from all groups not individually analyzed in the heatmap. (E) Frequency of cells in each group within the indicated sample, relative to the total cellularity in each condition. (F) Pearson correlation (color scale on the right) between Mono-Macrophage groups fold change vectors across CD11b+ NK1.1− CD45+ myeloid scRNAseq and Xenium datasets, computed as in Ref. (33). (G) Row z-scored expression (color scale on the right) of group 13 signature genes among mono-mac groups (4, 5, 8, 13, 20) in Ctrl- and Smarta-treated tumors. (H, I) Percentage of cells from each group (y-axis) among cells within the indicated distance (x-axis) of Smarta cells (H) in all Smarta-treated tumors, or of endothelial cells (I) in Ctrl- or Smarta-treated tumors. Numbers and colors refer to group identity (fig. S7B). (J) Left panels show the spatial distribution of group 6, 17, 13 and 26 cells in one representative Ctrl- (top) and Smarta- (bottom) treated C10 tumor, with each dot representing a cell. The right panels provide a high-magnification view of the dashed box in left panels, showing inferred cell segmentation. Colors refer to group identity. (K) Survival probability of colon adenocarcinoma patients stratified by levels of the L10 gene signature score, normalized by FCGR1A (encoding CD64). Hazard ratio (HR) and P value of Cox regression fit are shown. Data is from the TCGA database. (L) Gene set enrichment analysis (GSEA) of the L10 signature (as defined in methods, Table S2) on genes ranked by log2 fold change between long-term and short-term survivors among a cohort of PPP2R1A-mutant, platinum-resistant ovarian cancer patients treated with combined anti–CTLA-4 and anti–PD-1/PD-L1 immunotherapy. NES (normalized enrichment score). P (adjusted p-value).
图3 · PDF 第 31 页
Fig. 3: Non-lymphocyte-derived TNF mediates CD4+ T cell-dependent tumor control. (A-D) scRNA-seq analysis of Smarta TIL in Rag1−/− mice on day 10 p.t.i., sorted as in fig. S9B. Data are pooled from two captures derived from two independent experiments (see Methods). (A) UMAP plots show TIL color-coded by groups defined by high-resolution clustering (left plot) or by scaled expression of indicated genes (right 5 plots). (B) Violin plots show single-cell expression of Tbx21 mRNA within Smarta TIL groups. (C) Growth of C10 tumors in indicated mice receiving PBS (Ctrl) or 104 Smarta cells of the indicated genotype. Data are presented as mean ± s.e.m. from one experiment (n = 8 tumors from 4 mice per group; two tumors per mouse), representative of two independent experiments. (D) Violin plots show scaled expression of indicated genes within Smarta TIL. (E) Schematic of the experiments shown in (F) and (H). (F) Growth of C10 tumors in Rag1−/− mice receiving (i) PBS (Ctrl, empty circles), or Ifng−/−Smarta cells (filled circles) and (ii) indicated antibody (red symbols) or a control IgG (purple symbols). Data are presented as mean ± s.e.m. from one experiment (n ≥ 5 mice per group), representative of at least two independent experiments for each treatment. (G) Growth of C10 tumors in Rag1−/− mice that, on day 4 p.t.i., received PBS (Ctrl, n ≥ 4 mice), 104 Ifng−/− Smarta cells processed for Crispr-Cas9 deletion of Il3 (gIl3, n = 10 mice), Tnf (gTnf, n = 7 mice) or Rosa26 (gRosa, as a control, n ≥ 6 mice). Data are presented as mean ± s.e.m.; data are pooled from two independent experiments for gIl3 and are from one experiment, representative of five independent experiments for gTnf. Nucleofection slightly but reproducibly affected tumor control by Smarta cells (as seen in an independent experiment in fig. S10B). (H) Growth of PyMT-GP tumors in Rag1−/− mice in the same experimental conditions as in (G). Data are presented as mean ± s.e.m. from one experiment (n ≥ 4 mice per group), representative of two independent experiments. (C, F-H) P values are calculated with a two-way analysis of variance (ANOVA). ns P > 0.05, *P < 0.05, **P < 0.01, ***P < 0.001, ****P < 0.0001.
图4 · PDF 第 33 页
Fig. 4: IL3-producing CD4+ T cells induce TNF-producing peri-vascular macrophages to mediate tumor control. (A) Representative immunofluorescence staining (for TNF, CD45, CD64, and CD86) of C10 tumors collected on day 10 p.t.i. in Rag1−/− mice injected with either PBS (Ctrl) or 104 Smarta cells (Smarta) on day 4 p.t.i. A computationally generated image of TNF expression (TNF surface, second column) was generated from the acquired TNF staining signal (left column) and superimposed on CD45, CD64, and CD86 staining signals (right three columns). (B) Quantification of relative TNF cytokine abundance in Ctrl- and Smarta-treated tumors from experiments shown in (A). Each dot represents one tumor from one mouse. Data are presented as mean ± s.e.m. from one experiment (n = 4 mice per group), representative of two independent experiments. (C) Imaris spatial attraction analysis of TNF+ cells relative to peri-vascular cluster in one Smarta-treated tumor from the experiment shown in (B). Line ①, observed distribution of TNF+ cells. Line ②, randomized distribution. Data shown are representative of two independent experiments. (D) Representative immunofluorescence staining shows TNF production by CD64+ CD86+ macrophage-enriched peri-vascular clusters in Smarta-treated tumor collected on day 10 p.t.i. in Rag1−/− mice. (E) The percentage of indicated cells among TNF+ cells in Smarta-treated tumors from experiments shown in (D). Each dot represents one tumor from one mouse. Data are presented as mean ± s.e.m. from one experiment (n = 4 mice per group), representative of two independent experiments. (F) Average expression of Tnf (y-axis) in cells within the indicated distance (x-axis) from Il3+ (red line) or Il3− (cyan) Trbv13–1+ group 26 cells, in the tumor bed from Xenium- analyzed Smarta-treated tumors. (G-L) Analyses of C10 tumors collected on d10 p.t.i. from Rag1−/− mice injected on d4 p.t.i with 104 Ifng−/− Smarta cells that had been processed for Crispr-Cas9 deletion of Il3 (gIl3, n = 4 mice) or Rosa26 (gRosa, as a control, n = 5 mice). Data are from one experiment, representative of two independent experiments. (G) Representative immunofluorescence staining for TNF and CD45. An image of TNF expression (TNF surface, second column) was computationally generated from the acquired TNF staining signal (first column) and superimposed on CD45 staining signals (fourth column). (H) TNF staining mean fluorescence intensity (MFI) was measured on individual CD64+ TAMs within the peri-vascular clusters. Each dot represents one cell. Bars indicate median. (I) Percentage of TNFhi CD64+ TAMs among total CD64+ TAMs within peri-vascular clusters. TNFhi CD64+ TAMs are defined by TNF MFI greater than 5 in (H). Each dot represents one tumor from one mouse. Error bars indicate mean ± s.e.m. (J) TNF MFI of Smarta T cells. Each dot represents one cell. Bars indicate median. (K) Number of Smarta T cells per mm2. Each dot represents one tumor from one mouse. Error bars indicate mean ± s.e.m. (L) Percentage of the tumor section occupied by peri-vascular clusters. Each dot represents one tumor from one mouse. Error bars indicate mean ± s.e.m. (M) (left) Experiment schematic. C10 (middle) and PyMT-GP (right) tumor growth in mixed bone marrow chimeras made by reconstituting irradiated Rag1−/− hosts with a donor cell mix comprising tKO and either Rag1−/− (purple) or Rag1−/− Tnf−/− (red) precursors, and receiving either PBS (Ctrl, open blue circle) or 1×10⁴ Ifng−/− Smarta cells (solid circles) on day 4 p.t.i. Data are presented as mean ± s.e.m. from one representative experiment of three independent experiments (C10, n = 5–7 mice per condition per experiment; one tumor per mouse), or from one experiment (PyMT-GP, n = 6–8 tumors from 3–4 mice per condition, two tumors per mouse). (B, H-L): P values are calculated with two-tailed, unpaired Student’s t-tests. (M) P values are calculated with a two-way analysis of variance (ANOVA). ns P > 0.05, *P < 0.05, **P < 0.01, ****P < 0.0001.
图6 · PDF 第 37 页
Fig. 6: CD4+ T cell-induced, TNF-dependent vascular damage. (A) (top) Experiment schematic; (bottom) Representative IBEX TER-119, CC3 and CD31 immunofluorescence staining of C10 tumors from Smarta-injected Rag1−/− mice treated with either IgG or anti-TNF antibody. Dashed boxes (left images) define ROI shown on the right at higher magnification. (B) Quantification of erythrocyte extravasation, as defined in Fig. 5G, within indicated tumors. Each dot represents one tumor. Data are presented as mean ± s.e.m. from one experiment (Ctrl: n = 4 tumors from 2 mice; Smarta+IgG and Smarta+anti-TNF: n = 6 tumors from 3 mice per group), representative of two independent experiments. (C) Blood vessel width of indicated tumors, quantified as in Fig. 5E. Bars indicate mean; data are from one experiment (Ctrl: n = 4 tumors from 2 mice; Smarta+IgG and Smarta+anti-TNF: n = 6 tumors from 3 mice per group), representative of two independent experiments. (D) Percentage of CC3+ area within indicated tumors, expressed relative to the whole tumor area in the analyzed section. Each dot represents one tumor. Data are presented as mean ± s.e.m. from one experiment (Ctrl: n = 4 tumors from 2 mice; Smarta+IgG and Smarta+anti-TNF: n = 6 tumors from 3 mice per group), representative of two independent experiments. (E) Representative IBEX immunofluorescence images of C10 tumors from Smarta-injected Rag1−/− mice treated with either IgG or anti-TNF antibody, as in (A). Dashed boxes (left) define ROI shown magnified on the right. In the top (IgG) panel, ROI ① is a region with NG2-unbounded vessels, ROI ② a region with NG2-bounded vessels. Data shown are representative of two independent experiments. (F) Spatial attraction analysis of indicated cells to NG2-unbounded blood vessel, in Smarta cells and IgG treated tumor section shown in (E), computed across the whole tumor section using Imaris 10.0, and showing observed and randomized cell distributions as indicated. Data shown are representative of two independent experiments. (G) Left panel: representative area magnified from panel E (top, plain box) showing apoptotic endothelial cell and pericytes within IgG-treated C10 tumors that had received Smarta cells. Right panels: percentage (i) of apoptotic (CC3+) endothelial cells (left) or pericytes (right), expressed relative to the total number of each cell, and (ii) of NG2- unbounded vessel area (CD31+ NG2−), expressed relative to total blood vessel area (CD31+) (far right). Percentages were computed on the whole tumor section from indicated mice, in experiments as described in (E). Each dot represents one tumor. Data are presented as mean ± s.e.m. from one experiment (Ctrl and Smarta+IgG: n = 4 tumors from 2 mice per group; Smarta+anti-TNF: n = 6 tumors from 3 mice), representative of two independent experiments. (B-D, G) P values are calculated with a one-way analysis of variance (ANOVA). ns P > 0.05, *P < 0.05, **P < 0.01, ***P < 0.001, ****P < 0.0001.
图7 · PDF 第 39 页
Fig. 7: CD4+ T cell-induced TNF causes tumor cell death and targets non-immune stromal cells. (A) Representative immunofluorescence staining for tomato lectin, CD31, TER-119, and cleaved caspase-3 (CC3) in C10 tumors harvested on day 10 p.t.i. from Rag1−/− mice injected with either PBS (Ctrl) or 1x 10⁴ Ifng−/− Smarta cells (Smarta) on day 4 p.t.i. Mice received Tomato-lectin perfusion 30 min before tumor harvest. (B) Quantification of vascular integrity and erythrocyte (RBC) extravasation shown in (A). Shown are the percentage of lectin+ CD31+ endothelial cells relative to total CD31+ cells (top left) and the area of lectin− CD31+ regions relative to the total tumor area (bottom left) in each condition; the area percentage of lectin− CD31+ regions (top right) and erythrocyte (RBC) extravasation (bottom right), as defined in Fig. 5G, within CC3+ and CC3− tumor regions in Ifng–/– Smarta-treated C10 tumors. Each dot represents one tumor. Data are presented as mean ± s.e.m. from one experiment (n = 6 tumors from 3 mice per group), representative of two independent experiments. (C) Representative immunofluorescence images of Smarta-treated C10 tumors collected from Rag1−/− mice on day 10 p.t.i., and stained for TER119 (red blood cells, RBC), CD31 (endothelium), cleaved caspase 3 (CC3), HIF1A, and Thy1.1 (marking C10 tumor cells). Dashed boxes define ROI in each section, shown on the right at higher magnification. Data shown are representative of two independent experiments. (D–E) Overlap between HIF1A+ and CC3+ areas in the full tumor section shown in (C). (D) shows the percentage of HIF1A+ areas overlapping with CC3+ areas, and (E) shows the reverse. Each dot represents one tumor from one mouse. Data are presented as mean ± s.e.m.; pooled from two independent experiments, with a total of n = 6 mice. (F) Spatial attraction analysis of HIF1A+ (left) and CC3+ cells (right) to extra-vascular RBC, computed across the whole tumor section using Imaris 10.0. Data shown are representative of two independent experiments. (G-K) Analyses on C10 tumors growing in bone marrow chimeras generated by injecting Rag1−/− precursors into Rag1−/− or Rag1−/− Tnfrsf1a−/− irradiated hosts, and that had. Received either PBS (Ctrl) or 1×10⁴ Ifng−/− Smarta cells on day 4 p.t.i. (G) Experiment schematic. (H) Tumor growth in indicated conditions. Data are presented as mean ± s.e.m. from one experiment (n = 4–6 mice per group), representative of two independent experiments. (I) Representative TER-119, CC3, and CD31 IBEX staining. Dashed boxes (left images) define ROI shown on the right at higher magnification. Data shown are representative of two independent experiments. (J) Quantification of RBC extravasation, as defined in Fig. 5G, within indicated tumors. Each dot represents one tumor from one mouse. Data are presented as mean ± s.e.m. from one experiment (n = 2–5 mice per group), representative of two independent experiments. (K) Blood vessel width of indicated tumors, quantified as in Fig. 5E. Bars indicate mean; data are from one experiment (n = 2–5 mice per group), representative of two independent experiments. (B) P values are calculated with a two-tailed, unpaired Student’s t test. (H) P values are calculated with a two-way analysis of variance (ANOVA). (B, J, K) P values are calculated with a one-way analysis of variance (ANOVA). ns P > 0.05, *P < 0.05, **P < 0.01, ****P < 0.0001.
图8 · PDF 第 41 页
Fig. 8: TNF-dependent, IL3-dependent CD4+ T cell tumor control is seen with diverse T cell populations, tumor types, and antigens (A) Tumor size in indicated mice injected with 0.5 × 10⁶ C10 tumor cells one day after injection of 0.5 × 10⁶ wt Smarta cells (middle), Ifng–/– Smarta cells (right), or of PBS as a control (Ctrl, left). Data are presented as mean ± s.e.m.; pooled from three independent experiments, with a total of n = 6–16 mice per group. (B) MC38 tumors were collected on day 15 p.t.i. from Rag1–/– mice that on day 4 p.t.i had received either PBS (Ctrl) or 5 × 10⁶ naive Ifng–/– CD4+ T cells. Left panel: Representative IBEX staining of tumors for TER-119, cleaved caspase-3 (CC3) and CD31. Right panel: Quantification of RBC extravasation, as defined in Fig. 5G, in indicated tumors. Each dot represents one tumor. Data are presented as mean ± s.e.m. from one experiment (n = 6 tumors from 3 mice per group), representative of two independent experiments. (C) (top) Experiment schematic; (bottom) Growth of B16 tumors in Rag1–/– mice receiving (i) PBS (Ctrl, empty circles), or 1×10⁴ Trp1 TCR–transgenic CD4 cells (Trp1 Tg CD4, filled circles), and (ii) IgG (black symbols), αIFNγ plus αTNF antibodies (red symbols) or αIFNγ antibody alone (purple symbols). Data are presented as mean ± s.e.m. from one experiment (n = 4–5 mice per group), representative of two independent experiments; (D) Left panel: Representative IBEX staining for TER-119, CC3, and CD31 in B16 tumors collected on day 12 p.t.i. from Rag1–/– mice treated as in C. Right panel: Quantification of erythrocyte (RBC) extravasation, as defined in Fig. 5G, in the indicated tumors. Each dot represents one tumor from one mouse. Data are presented as mean ± s.e.m.; pooled from two independent experiments, with a total of n = 3 mice (Ctrl), n = 7 mice (Trp1 Tg CD4 + αIFNγ), and n = 8 mice (Trp1 Tg CD4 + αIFNγ + αTNF). (E) (top) Experiment schematic; (bottom) Growth of B16 tumors in Rag1–/– mice that, on day 4 p.t.i., received PBS (Ctrl, n = 5 mice), 5×10⁵ Trp1 transduced Ifng–/– CD4 T cells processed for Crispr-Cas9 deletion of Il3 (gIl3, n = 4 mice), or Rosa26 (gRosa, as a control, n = 4 mice). Data are presented as mean ± s.e.m. from one experiment, representative of two independent experiments. (F) H&E staining (far left) and spatial distributions of group Mono_Mac_1, vascular cell groups (Endo_1, Endo_2, Endo_3, and pericytes; left), group tumor_2 (Hypoxia associated cells), and CD4 T cells [defined as (CD40LG | CD4) > 0 and FOXP3 = 0 within group Lymphocytes; right] in a representative human ovarian tumor (patient P1). Each dot represents a single cell. Far-right panel shows high-magnification view of the boxed region in the preceding panel. Cells are defined by computationally-inferred segmentation and colored as indicated, based on cell group identity defined in fig. S16AB. (G) Volcano plot [x-axis: average log2 fold change; y-axis: −log10–transformed adjusted P value (false discovery rate, FDR)] showing differentially expressed genes between Mono_Mac_1 cells located near CD4 T cells (distance < 10 μm) and those located farther from CD4 T cells (distance ≥ 10 μm) in all three patients. Selected genes are annotated. Red, blue, and gray symbols indicate genes preferentially expressed in Mono_Mac_1 cells near CD4+ T cells, far from CD4+ T cells, or showing no significant difference, respectively. P values were calculated using the Wilcoxon rank-sum test implemented in the Seurat FindMarkers function. (H) Left panels show the spatial distribution of group 9 (Hypoxia associated tumor cells, purple), group 26 (Smarta cells, red), group 13 (mono-mac cells, green), and vascular cell groups (groups 6 and 17, shown together as gray) in one representative Ctrl- (top) and Smarta- (bottom) treated mouse C10 tumor, with each dot representing a cell. The right panels provide a high-magnification view of the areas boxed in left panels, showing inferred cell segmentation. Group identities are defined in fig. S7B, and sections are the same as shown in Fig. 2J. (A, C, E) P values are calculated with a two-way analysis of variance (ANOVA). (B) P values are calculated with a two-tailed, unpaired Student’s t test. (D) P values are calculated with a one-way analysis of variance (ANOVA). ns P > 0.05, *P < 0.05, ****P < 0.0001.
完整阅读记录与证据表
文献卡:CD4+ T cells impair tumor growth via IL-3 and TNF-dependent vascular damage
- Paper ID:p-0026-art-cd4-t-cells-impair-tumor-growth-il-3-tnf
- 晨会:2026-10-10;整理:2026-10-09。
- Science,2026,392(6804):eads7910;DOI 10.1126/science.ads7910。
- Skill:article-read / morning-report / pdf / web-publish。
- 范围:42页作者稿正文、方法、8张主图及完整图注;独立补图S1–S16、补表S1–S9、视频及MDAR未取得。详见coverage.md。
- 8张原图完整归档;网页选图1–4、6–8;人工核对pending。
一句话结论
在所用小鼠模型中,局部抗原驱动的CD4 T细胞经IL-3促进宿主髓系TNF,以非造血组织TNFR1依赖的血管损伤抑制肿瘤;人材料提供相关性支持。
研究问题与背景
作者关注缺少肿瘤细胞MHC-II呈递时CD4 T细胞如何控制肿瘤。人工抗原MC38-GP/Smarta体系提供可追踪的抗原识别,髓系缺陷、细胞因子干预及骨髓嵌合用于拆分因果链。血管间质成为直接肿瘤识别之外的效应对象。
贡献与比较对象
比较包含有无GP抗原、肿瘤MHC-II或TNFR缺失、不同免疫缺陷宿主、CD4与宿主细胞因子缺失及TNF抗体阻断。肿瘤控制对T细胞来源TNF与髓系来源TNF的不同依赖,是主要机制贡献。内源抗原和不同癌种模型用于扩大适用范围;人数据为观察性层次。
方法与验证
正文/方法PDF1–20页:体内生长、组织免疫成像、Visium、单细胞RNA测序、Xenium、骨髓嵌合与人数据再分析。Visium为2对照+4处理肿瘤,方法/结果称单次实验;Xenium为2+2肿瘤、两个独立实验。图中细胞、视野、血管、肿瘤和小鼠为不同样本层级。未重算单细胞、空间组学或患者原始数据。
核心证据
| 主张或结果 | 数字、单位、条件 | PDF页序/图表 | 依据类型 | 核对状态 |
|---|---|---|---|---|
| 肿瘤MHC-II缺失仍可控制,GP阴性对侧不受同样控制 | C10为MC38-GP H2-Aa缺失;部分生长实验8肿瘤/4小鼠 | 26–28,图1 | 正文/图表 | 已核 |
| 血管周围CD4与髓系聚集 | 聚集CD45细胞中>80%为CD64阳性;募集缺陷削弱聚集与控制 | 图1–2及正文 | 正文/图表 | 已核 |
| 炎症性TAM L10与人CRC生存关联 | Nos2/Arg1共表达;TCGA 283例;图2K HR0.53,P0.017 | 29–30,图2 | 图表;患者再分析 | 已核,统计方法差异见coverage |
| IFN-γ缺失下IL-3/TNF路径仍可作用 | 控制速度改变;抗IL-3、CSF2或TNF可削弱所用模型作用 | 31–32,图3 | 正文/图表 | 已核;CSF2仅抗体证据 |
| IL-3主要影响髓系效应功能 | 在IFN-γ缺失Smarta背景下,Il3敲除降低髓系TNF及控制,聚集仍在 | 主7–9页;图3G、4G–L(31–34页) | 正文/图表 | 已核 |
| TNF关键来源为宿主髓系 | IFN-γ缺失CD4再敲除Tnf保留作用,宿主或募集单核细胞TNF缺失损害作用 | 主7–9页;图3G、4M(31–34页) | 正文/图表 | 已核 |
| 肿瘤TNFR1/2并非必要条件 | 双受体缺失肿瘤:对照9、处理11只小鼠,合并2实验 | 35–36,图5C | 图表 | 已核 |
| 血管损伤及灌注下降 | 周细胞/内皮凋亡、红细胞外渗、NG2覆盖减少、凝集素灌注下降;TNF阻断缓解 | 35–40,图5–7 | 正文/图表 | 已核 |
| 非造血TNFR1参与 | TNFR1完整Rag1缺陷骨髓→Rag1/TNFR1双缺陷宿主,IFN-γ缺失Smarta细胞的控制受损 | 主10页;图7G–K(39–40页) | 正文/图表 | 已核;非内皮特异敲除 |
| 模型扩展 | GP阴性MC38+多克隆CD4、B16 Trp1;另有PyMT-GP乳腺肿瘤 | 图8A–E(41–42页);PyMT见图3H、4M | 正文/图表 | 已核 |
| 人材料空间支持 | CRC3例、卵巢癌3例,300与5000基因面板不同 | 主11–12页;图8F–G为卵巢癌,CRC图在未得的补图S15 | 正文/图表 | 已核;观察性 |
局限与待解问题
作者明确指出或讨论
人工抗原体系与自然抗原反应有差异;血管损伤在不同肿瘤条件下的适用范围和安全性待查。骨髓嵌合定位受到照射/血管修复影响。周细胞先受损及部分空间机制来自静态成像推断。人组织和患者表达特征并非治疗干预验证。
AI推断与理由
IL-3缺失影响髓系TNF而聚集保留,提示“组织聚集”与“效应激活”可分别受限;这是依据干预差异的分析。跨癌种效应可能同时受抗原呈递、髓系募集及血管状态影响,需要在自然免疫和异质性肿瘤中检验。混合巨噬细胞表达状态更适合多维描述,单一M1/M2标签会丢失本文的信息。
待核对问题与后续阅读
独立补充图表/视频未获;TCGA基因数、实验批次与检验口径存在原文差异,逐项记录在coverage.md。已核实本篇出版题录,未把参考文献列作逐篇全文已读。