研究问题
儿童肿瘤初诊时的突变数量往往较少。治疗后再次取样,基因组中既有肿瘤自身演化的变化,也可能留下药物造成的DNA损伤痕迹。这篇研究把既往用药、取样时间和突变谱放在一起,追问三个问题:哪些变化与治疗有关,什么时候能检测到,以及这些变化与后续治疗反应有什么联系。
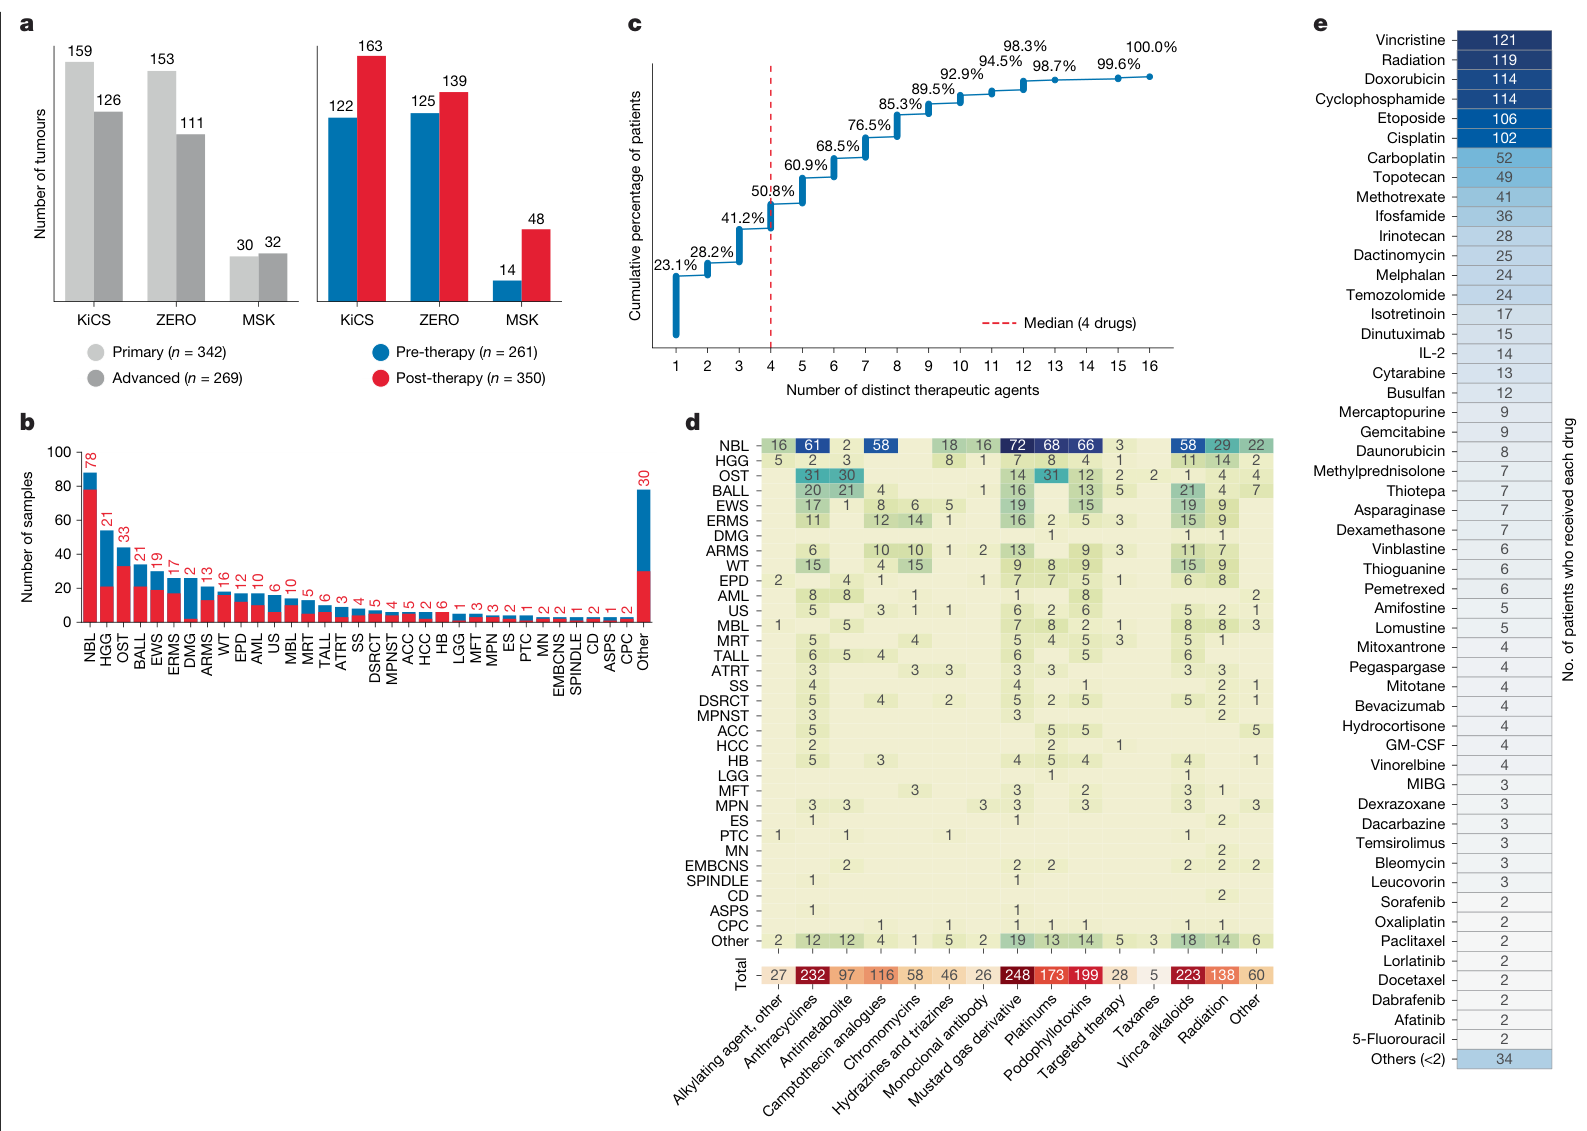
作者整合KiCS、ZERO和MSK三个儿童肿瘤精准医疗项目,形成KZM队列。正文报告544位患者的611份肿瘤样本,覆盖约100种肿瘤类型,约57%的样本取自接受治疗之后。
| 设计要点 | 内容 |
|---|---|
| 样本分层 | 初诊原发部位样本342份;进展期样本269份 |
| 进展期定义 | 包括原发部位进展或复发、转移灶及第二肿瘤,涵盖不同临床状态 |
| 分子分析 | 全基因组测序,分析单碱基替换、双碱基替换、小插入缺失、结构变异和拷贝数变化 |
| 治疗信息 | 86种药物、超过3,200条治疗记录;常见多药联合暴露 |
| 验证 | 独立儿童PROFYLE、成人POG队列,以及深度靶向测序和RNA分析 |
这是多队列的观察性分析,样本来自偏重难治或预后不良患者的精准医疗项目。主要比较以不同患者、不同临床状态的取样为基础。
治疗后进展期肿瘤的突变负荷较高
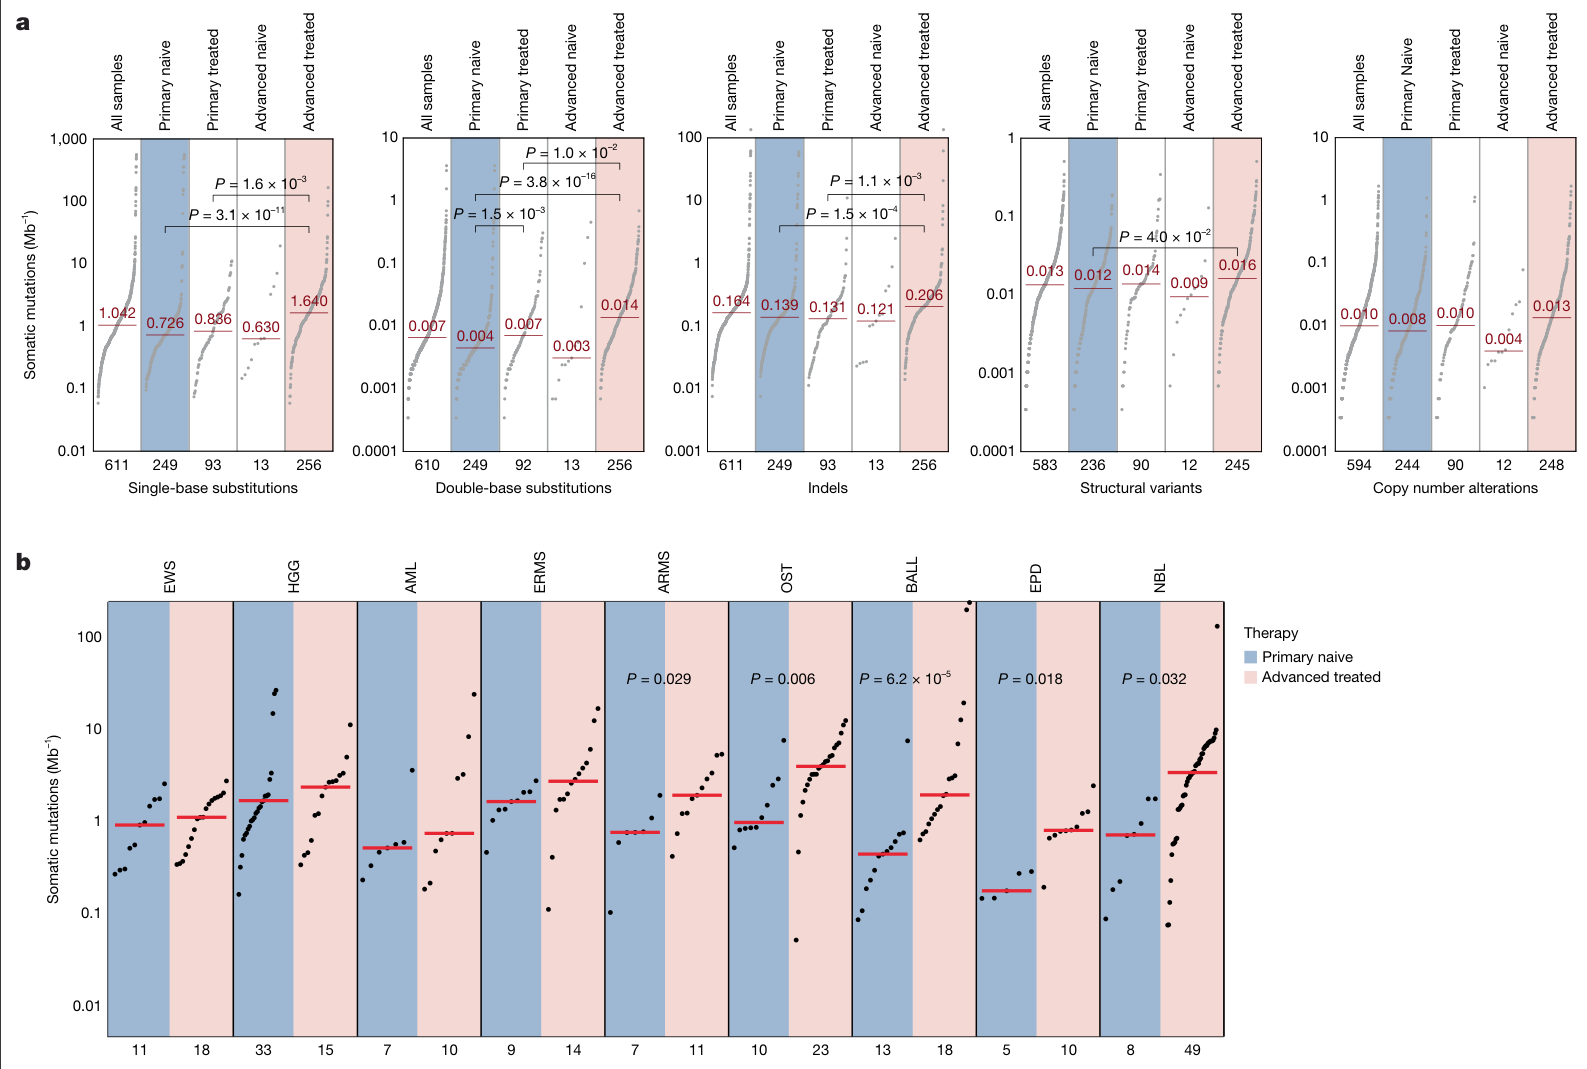
未治疗的初诊原发肿瘤,单碱基替换中位负荷为0.726个/Mb;接受治疗的进展期肿瘤为1.64个/Mb,约为前者的2.3倍。双碱基替换、小插入缺失等变化也呈现不同程度的升高。
治疗后仍在初诊原发部位取样的患者,多数突变类别未出现同样明显的升高。该组从治疗开始到取样的中位间隔为109天,治疗后进展期组为622天。临床状态和取样间隔共同影响观察到的突变谱。
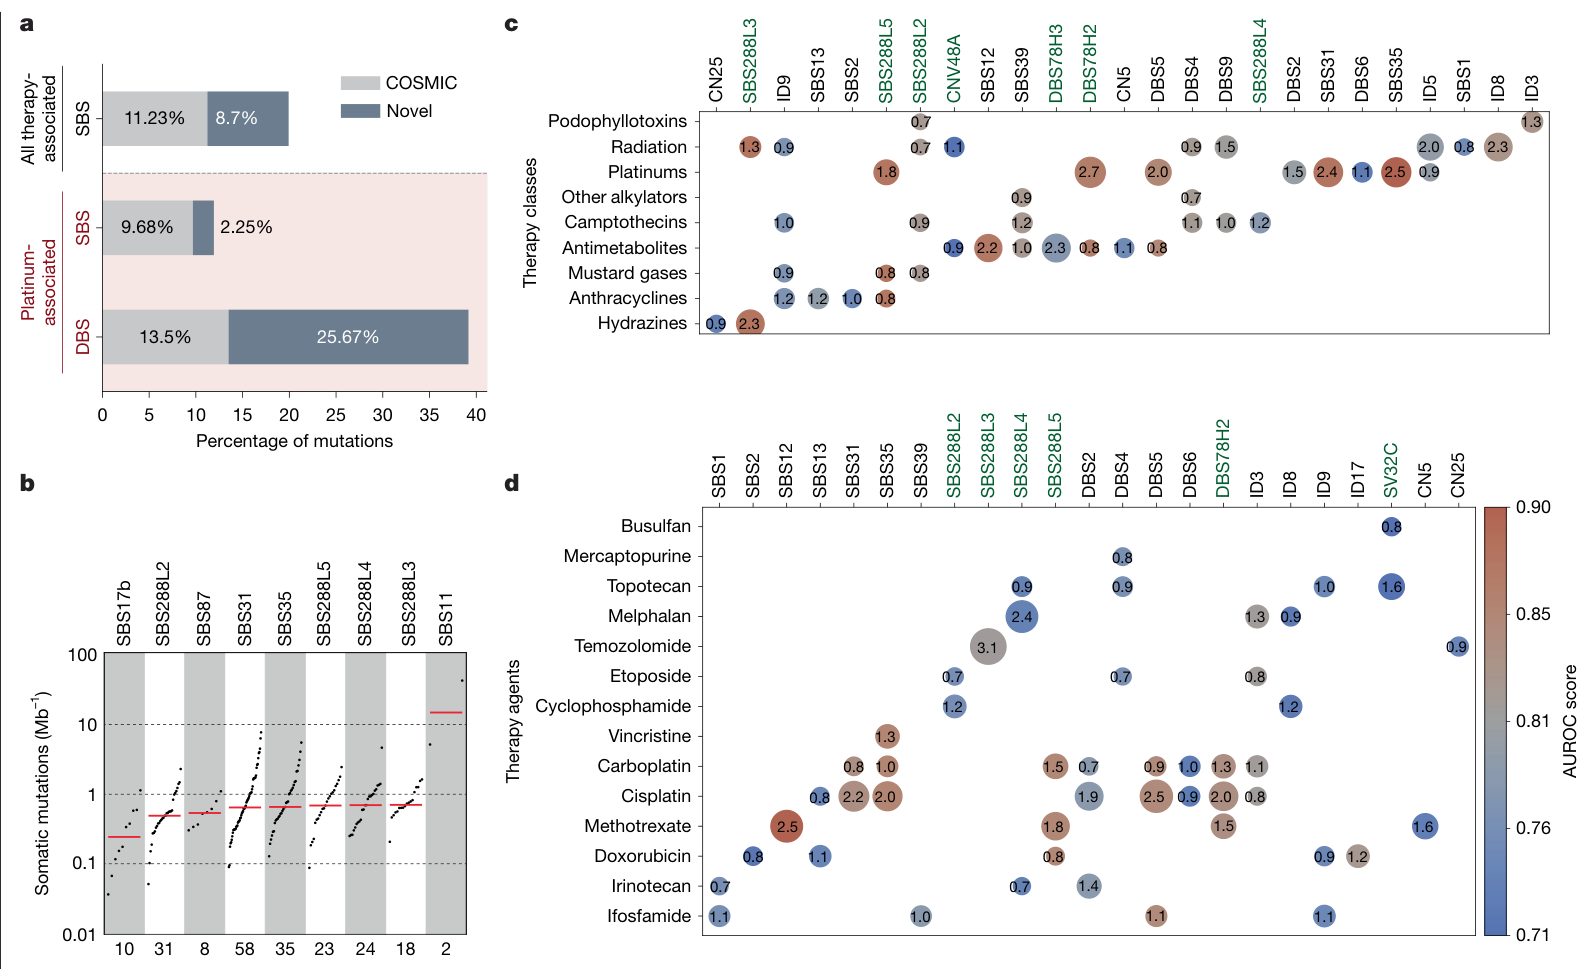
作者进一步把突变分配到不同“突变特征”:每一种特征描述一组具有特定碱基背景和比例的变化,可用于追踪相应的损伤、修复或复制过程。去除分配给治疗相关特征的突变后,进展期样本仍有较高的负荷,说明其差异还涉及其它演化过程。
铂类留下的痕迹最为突出
611份样本中,173份有铂类暴露记录。已知铂类特征SBS31、SBS35或DBS5出现在其中71份,约41%。在577份低突变负荷样本的分析中,已知与新增的治疗相关特征合计贡献了约19.9%的单碱基替换,其中铂类占主要部分。
本研究还识别出两种与铂类暴露密切相关的特征:SBS288L5和DBS78H2。它们在独立儿童和成人队列中得到验证,补充了仅使用既有特征时遗漏的样本。SBS288L5的转录链偏向等特点,与铂类损伤及转录偶联修复的生物学相容。
“新增”在这里指相对于研究采用的COSMIC特征目录。特征发现、药物暴露关联和具体分子机制分别通过不同证据支持。除铂类外,作者还分析了替莫唑胺、5-FU、硫嘌呤及多类治疗共同相关的特征;这些药物的暴露人数、记录完整性和特征特异性差异较大。
检出需要合适的时间和足够的突变
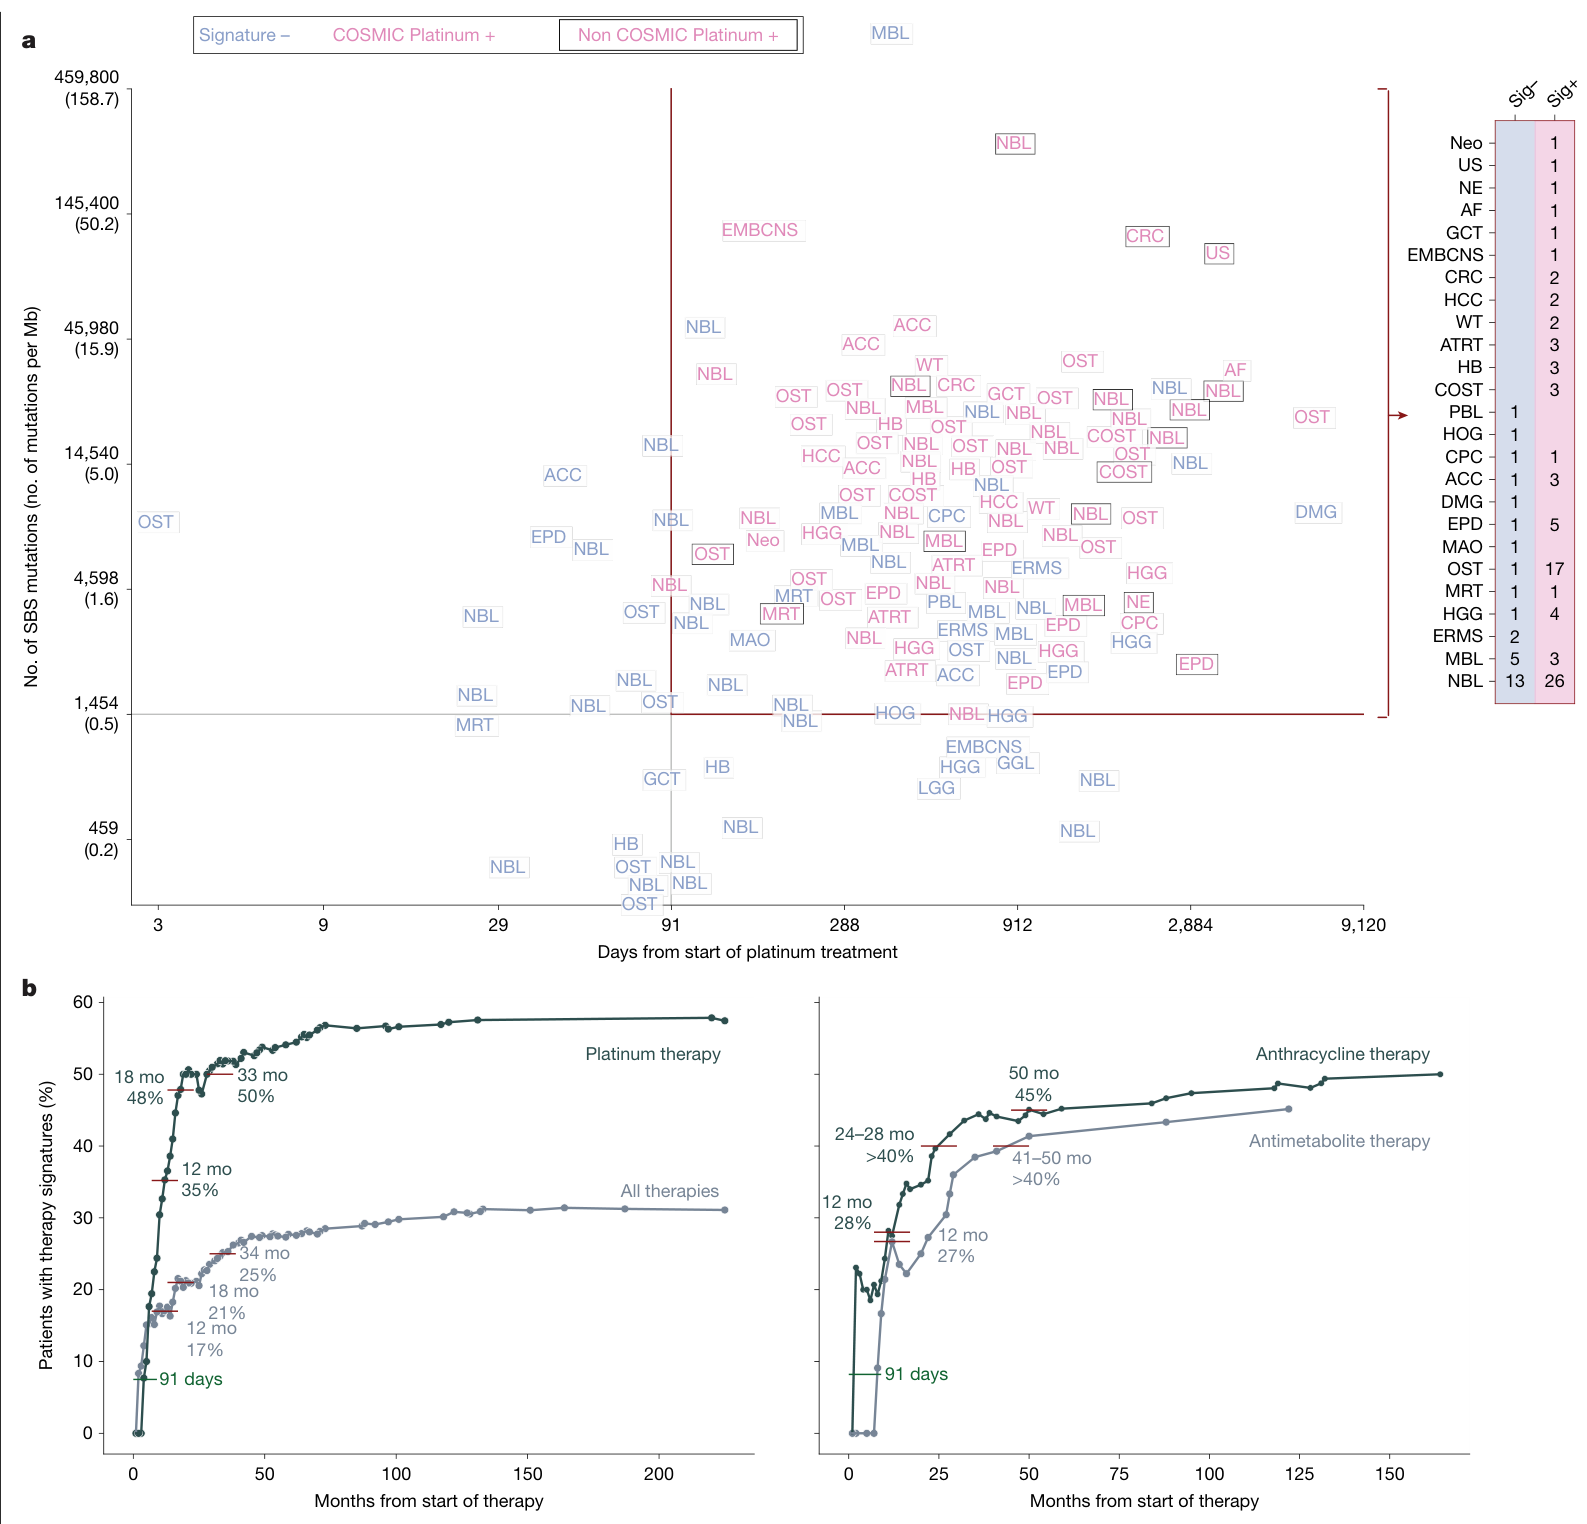
铂类暴露样本中,141份有足够的时间记录。作者观察到,常规全基因组分析最早在治疗开始后91天检出铂类特征,且检出样本至少有1,454个单碱基替换,约相当于0.5个/Mb。这两个数值是本队列和分析方法下的经验检出边界。
在取样时间≥91天且单碱基替换数≥1,454个的111份样本中:
| 特征集合 | 检出样本 | 比例 |
|---|---|---|
| 既有SBS31、SBS35、DBS5 | 65/111 | 58.6% |
| 加入SBS288L5、DBS78H2 | 81/111 | 73.0% |
增加两种特征后,多检出16份样本,比例增加14.4个百分点。这提示检测面板的组成会影响对既往治疗痕迹的判断。
作者按治疗到取样的时间,汇总此前已取得样本的特征阳性比例:铂类组在12个月时为18/51,35.3%。这条曲线描述不同取样时点样本的检出情况,分母随纳入样本而变化。
深度靶向测序覆盖51份样本。早期、突变数量较少的样本,合并突变谱后可见微弱铂类信号;达到检出条件但WGS阴性的样本,在该深测分析中仍未检出信号(补图7)。另行亚克隆分析在部分样本中发现bulk分配未检出的铂类谱型(扩展图10a、补图8)。两种分析分别检验检测深度与克隆比例的影响。
与耐药表型及再次治疗反应的联系
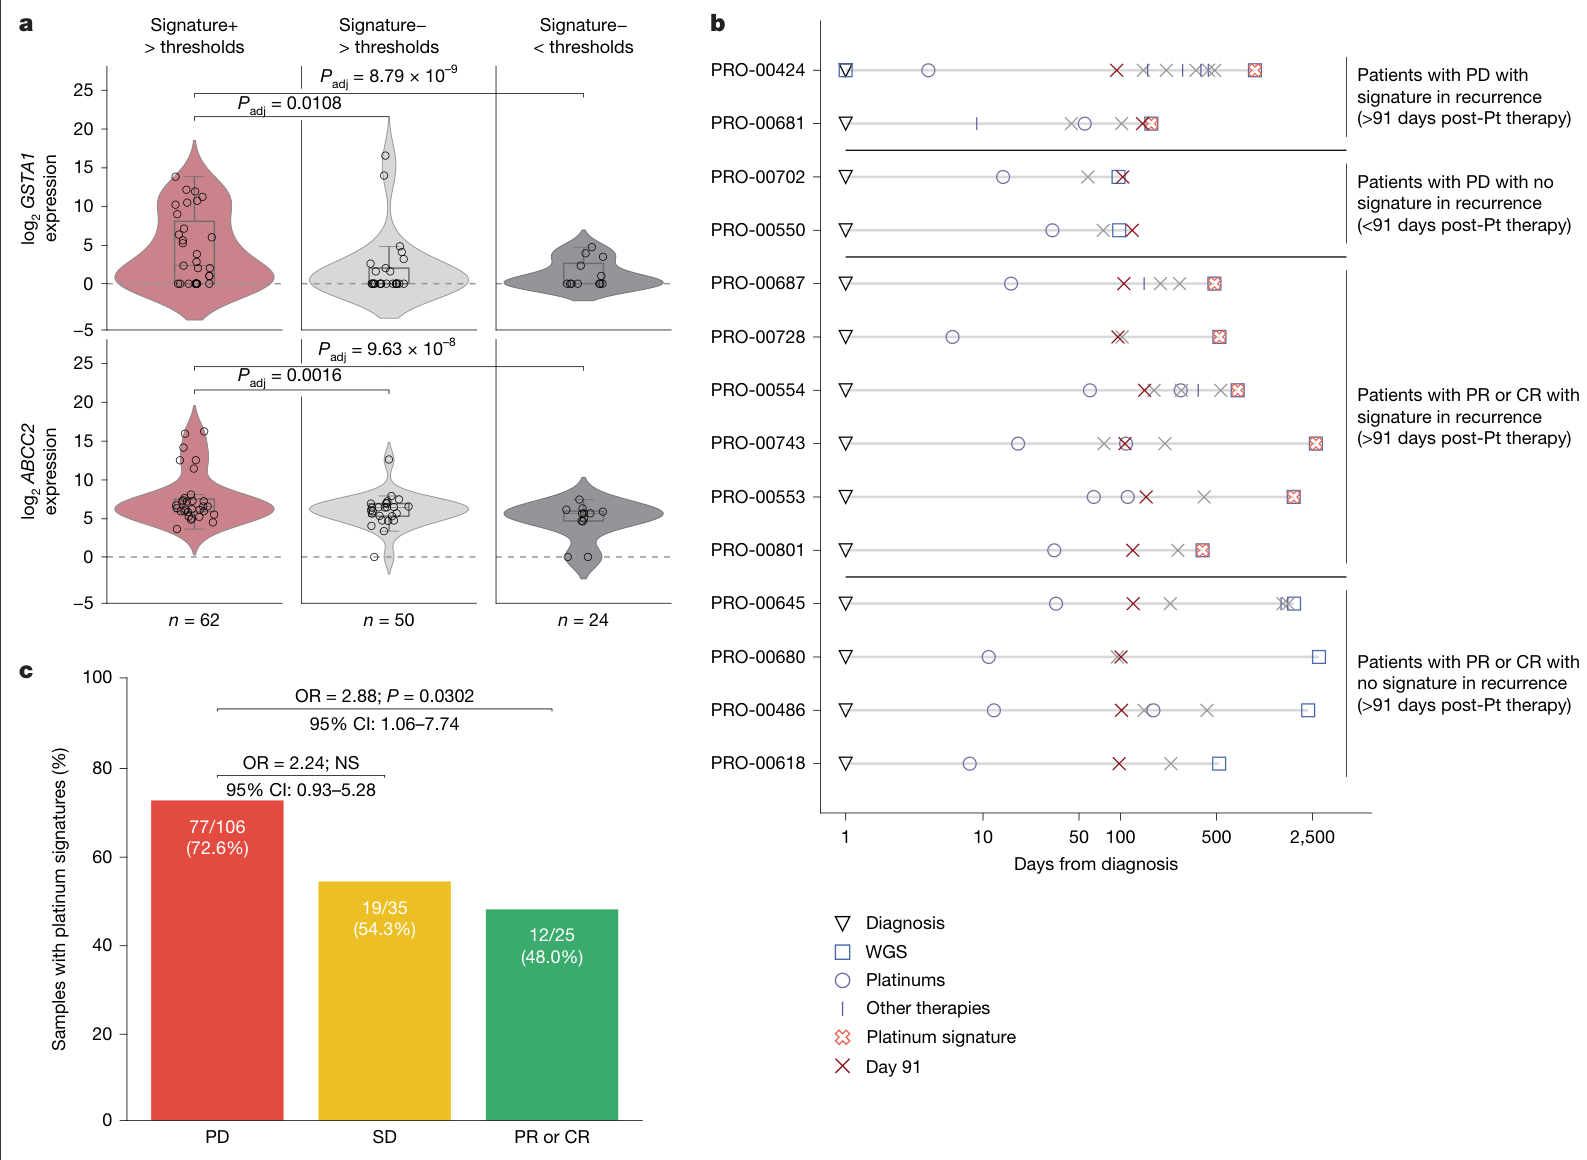
RNA分析实际涉及68份独立样本:达到检出条件且特征阳性31份,达到条件但阴性25份,未达到条件且阴性12份。图5a同时展示两个基因,每份样本各有两条基因表达记录。
特征阳性组的GSTA1和ABCC2表达较高,分别涉及药物解毒和外排。作者据此把铂类突变痕迹与耐药相关转录状态联系起来,儿童外部队列的治疗时间线也提供了相应的临床观察。
成人外部分析纳入166位既往接受铂类、之后再次接受铂类治疗的转移性肿瘤患者。不同疗效类别中的特征阳性比例为:
| 再次治疗结果 | 特征阳性人数/该类别人数 | 比例 |
|---|---|---|
| 疾病进展,PD | 77/106 | 72.6% |
| 疾病稳定,SD | 19/35 | 54.3% |
| 部分或完全缓解,PR/CR | 12/25 | 48.0% |
PD相对PR/CR的关联达到统计显著,OR为2.88(95% CI 1.06–7.74);PD相对SD的OR为2.24(0.93–5.28),未达显著。按肿瘤组织类型或取样部位分层,以及回归调整后的分析,方向与主要比较一致。
该结果支持把铂类突变特征作为后续疗效研究的候选指标。临床应用还需要评估:它在已有治疗记录、疾病状态及耐药相关信息之外,能增加多少预测价值。
局限与待解问题
治疗暴露、复发或进展、取样间隔和肿瘤类型相互关联,多药联合也较常见。当前比较主要来自观察性、跨患者的取样,药物造成新突变与治疗选择既有克隆的贡献还需纵向研究区分。
91天和1,454个突变依赖本队列、测序深度与算法。它们描述何时容易检测到谱型;DNA损伤的起点、个体耐药出现的时刻需要其它测量。12个月的35.3%来自累积纳入的取样记录,研究未据此估计复发发生率。
RNA分析样本有限,模型调整了机构和疾病状态,难以同时充分控制肿瘤类型。表达关联、突变特征与耐药之间的因果方向尚待验证。成人再次治疗队列跨癌种,奥沙利铂与其它铂类也可能有不同的特征组合,后续需要按癌种和药物分别验证。
本文整理覆盖主文、独立补充方法与科学图、10份短补充表和图4–5源数据的关键核对。长患者级数据表与特征矩阵保留原件,未逐项复算;患者原始测序数据未重新分析。
进一步理解
这篇研究把“接受过什么治疗”细化为“治疗后存活的肿瘤中,留下了什么可以测量的变化”。相同暴露下,不同肿瘤的修复、克隆扩增及取样时间不同,基因组痕迹也会不同。
一个值得继续研究的方向,是在同一癌种、同一种铂类方案内,结合治疗前后配对样本,检验突变特征能否改善再次用药的分层。评价时应关注它对既有临床信息的增量,以及是否能指导一个结果更好的替代方案。这是基于本研究提出的后续问题。
原文:Prior therapy defines mutation profiles in childhood cancer at relapse
主图与表格 · 5 张
图1 · PDF 第 3 页
Fig. 1 | Overview of the KZM cohort. a, Composition of the KZM cohort, comprising samples from the KiCS, ZERO and MSK programmes. Bar charts show sample counts by disease state (primary versus advanced) and treatment status (pre-therapy versus post-therapy) for each dataset. b, Therapy exposure across tumour types in the KZM cohort. Stacked bars show the post-therapy (red) and pre-therapy (blue) samples by tumour type, ordered by total sample count. Post-therapy counts are shown above each bar. Tumour types with n < 2 or no treated samples are grouped under ‘other’. ACC, adrenal cortical carcinoma; AML, acute monocytic leukaemia; ARMS, alveolar rhabdomyosarcoma; ASPS, alveolar soft part sarcoma; ATRT, atypical teratoid rhabdoid tumour; BALL, B cell lymphoblastic leukaemia; CD, chordoma; CPC, choroid plexus carcinoma; DMG, diffuse midline glioma; DSRCT, desmoplastic small round cell tumour; EMBCNS, embryonal central nervous system tumour; EPD, ependymoma; ERMS, embryonal rhabdomyosarcoma; ES, epithelioid sarcoma; EWS, Ewing sarcoma; HB, hepatoblastoma; HCC, hepatocellular carcinoma; HGG, high-grade glioma; LGG, low-grade glioma; MBL, medulloblastoma; MFT, myofibroblastic tumour; MN, meningioma; MPN, myeloproliferative neoplasm; MPNST, malignant peripheral nerve sheath tumour; MRT, malignant rhabdoid tumour; NBL, neuroblastoma; OST, osteosarcoma; PTC, papillary carcinoma of thyroid; SPINDLE, spindle cell tumour, unclear diagnosis; SS, synovial sarcoma; TALL, T cell lymphoblastic leukaemia; US, undifferentiated sarcoma; WT, nephroblastoma (Wilms tumour). c, Empirical cumulative distribution function showing the proportion of patients who received up to a given number of distinct therapeutic agents. Each point on the curve corresponds to a unique therapy burden value and the cumulative percentage of patients who received that number or fewer drugs. Numbers above each step indicate the cumulative percentage up to each drug count. d, Therapy class exposure by tumour type. Heat map (top) showing the number of tumours per major tumour type (rows, same order as in b) that were exposed to each therapy class (columns). Aggregated totals across all tumour types are shown along the bottom. e, Drug- level exposure across the cohort. Each tile represents a therapeutic agent, with colour intensity scaled to the number of patients who received that drug, normalized to the most frequently used agent. Only drugs administered to at least two patients are shown individually; the remaining are aggregated into ‘others (<2)’. Patient counts are shown in each tile. GM-CSF, granulocyte– macrophage colony-stimulating factor; MIBG, metaiodobenzylguanidine.
图2 · PDF 第 4 页
Fig. 2 | Mutational burdens across treatment status and cancer types. a, Somatic mutation burden (total number of variants divided by the length of the reference genome) are shown for major types of genomic variants. In addition to the overall burden in the cohort, we also show the burdens for treatment-naive (primary naive), and treated primary (primary treated) and advanced (advanced naive and advanced treated), tumours. Each point represents the burden for a single sample, and the red horizontal lines indicate the median burden. The number of samples in each category is shown below the horizontal axis. The dependent variable (mutation burden) was first rank- transformed, and the effects of covariates (age, sex and tumour purity) were regressed out via ordinary least squares linear regression. The resulting residual ranks were then compared across groups using a one-way ANOVA (F-test; two- sided). For post hoc comparisons, pairwise Wilcoxon rank-sum tests (two- sided) were performed, with P values adjusted for multiple comparisons using the Benjamini–Hochberg false discovery rate procedure at α = 0.05. b, Somatic SBS burden for major tumour types (those with a minimum of five primary naive and five advanced treated samples). All figure elements are the same as in a. P values are calculated as in a and indicate the significant increase in SBS burden post-therapy. As only two groups were compared (pre-therapy versus post-therapy for each tumour type), no post hoc pairwise test or adjustment for multiple comparisons was performed.
图3 · PDF 第 5 页
Fig. 3 | Mutational activity and therapy associations of COSMIC and novel mutational signatures in paediatric cancers. a, Somatic mutations attributable to COSMIC or novel mutational signatures. The proportions of mutations found in low-burden tumours (n = 577) in the cohort irrespective of past therapy exposure are shown. These are divided into mutations associated with any therapy (including platinum) versus those specifically associated with platinum therapies, and then further divided by mutation type (SBS and DBS). b, Mutation burden (somatic mutations per Mb) of therapy-associated SBS signatures (COSMIC and novel) detected across all tumour genomes (n = 611). Each dot represents one sample; red lines indicate median values and dashed lines show reference thresholds. The number of samples carrying each signature is shown below the horizontal axis. c, Association between mutational signatures and therapeutic classes. Each circle represents a significant association (one-tailed empirical P value < 0.05, AUROC ≥ 0.7 and regression coefficient ≥ 0.7), with size proportional to the regression coefficient (log of odds ratio; shown in circles) and colour indicating the observed AUROC scores from the logistic regression model. Novel and COSMIC signature names are shown in green and black, respectively. d, Same as c, but for individual therapeutic agents. Beyond the primary therapy associations detailed in the main text, we identified secondary associations that either failed robustness testing, arose from treatment co-occurrence rather than direct causation (for example, DBS5 with antimetabolites) or reflected well-known endogenous processes (for example, SBS13 with anthracyclines). These are further discussed in Supplementary Note 1.7.
图4 · PDF 第 7 页
Fig. 4 | Mutational signature analysis of platinum exposure. a, All the platinum-treated KZM samples with available detailed therapy information are shown. See Supplementary Table 1 for the full tumour names. The top right quadrant depicts where we expect the tumours to manifest the imprints of platinum therapy (samples that pass both burden and time thresholds). A summary plot of the number of samples from this quadrant with (Sig+) and without (Sig−) platinum signatures for each cancer type is provided on the right-hand side. AF, aggressive fibromatosis; COST, chondroblastic osteosarcoma; CRC, colorectal carcinoma; GCT, germ cell tumour; HOG, Hodgkin lymphoma; MAO, mucinous adenocarcinoma (ovarian); NE, neuroepithelioma; Neo, malignant neoplasm; PBL, pineoblastoma. b, Left, comparison of platinum therapy against all therapies combined (including platinum therapies), showing the percentage of KZM participants who exhibit therapy-associated signatures over time. Key milestones, including signature prevalence at 12 months and time to 50% prevalence, are marked in red. Right, the same analysis for two other major therapeutic classes: anthracyclines and antimetabolites. Platinum-specific signatures were used for the platinum curve, and the composite set of all therapy signatures (Fig. 3b) was used for other therapy curves owing to the absence of known anthracycline-specific mutational signatures and low abundance of antimetabolite signatures in our cohort. Mo, months.
图5 · PDF 第 8 页
Fig. 5 | Platinum mutational signatures and clinical outcome. a, Enrichment of two key platinum resistance genes (GSTA1 and ABCC2) in signature-positive versus signature-negative tumours. Signature+ > thresholds, n = 62; signature− > thresholds, n = 50, and signature− < thresholds, n = 24. The first two columns are signature-positive and signature-negative samples from the top right quadrant of Fig. 4a, that is, samples that passed both time and burden thresholds. The third column are samples that did not pass the thresholds and did not show platinum signatures. Differential expression was assessed using a two-sided Wald test; P values were adjusted using the Benjamini–Hochberg false discovery rate procedure. Box plots show the median (centre line), interquartile range (box bounds: 25th–75th percentile) and 1.5× interquartile range from the box bounds (whiskers). Individual data points are overlaid as dots. Violin plots show the kernel density estimation of the data distribution. Padj, adjusted P value. b, Worsening of clinical response in signature-positive tumours. All paediatric patients with progressive disease (PD) sampled more than 91 days post-therapy showed strong platinum signatures. Six additional patients who were signature-positive who were initially recorded as partial response (PR), complete response (CR) or stable disease (SD) later developed recurrence or metastasis. No platinum signature was detected in five complete response or partial response tumours, suggesting either treatment sensitivity or the presence of sub-detection-threshold resistant clones. WGS, whole- genome sequencing. c, In a cohort of 166 patients treated with platinum (Hartwig Medical Foundation) who developed metastases and were re-exposed to platinum therapies, the presence of platinum signatures in the primary tumour was consistently associated with worsening clinical response in the metastasis. At the time of last clinical evaluation, patients with platinum signature (compared to those without) had 2.24-fold higher odds of progressive disease versus stable disease and 2.88-fold higher odds of progressive disease versus partial response or complete response. The association between platinum signatures and progression remains significant after adjusting for primary histology (Cochran–Mantel–Haenszel P value = 0.0097; odds ratio (OR) = 3.41), metastatic site (Cochran–Mantel-Haenszel P value = 0.0176; OR = 3.20), and platinum treatment frequency (multivariate logistic regression P value = 0.018; OR = 2.98). All odds ratios are reported with 95% confidence intervals (CIs); P values are two-sided. NS, not significant.
完整阅读记录与证据表
文献卡:Prior therapy defines mutation profiles in childhood cancer at relapse
- Paper ID:p-0030-art-prior-therapy-defines-mutation-profiles。
- 晨会2026-10-12;接收及整理2026-10-09至2026-10-10;原件D:\ZZ\10.12晨会.pdf保留。
- Nature 657, 811–820 (2026),在线2026-07-22;DOI 10.1038/s41586-026-10803-1。
- Skill:article-read / morning-report / pdf / spreadsheets / web-publish。
- 主PDF31页;独立补充34页;报告摘要4页;26张补充表所在XLSX与图4–5源数据。覆盖及原始材料差异见coverage.md。
- 科学图表42 PNG,网页5主图。processing_status=partial;human_review=pending。
一句话结论
儿童肿瘤的治疗痕迹受药物、取样时间和突变数量共同影响,新增铂类特征提高检出率,并在外部队列与再次接受铂类的进展相对缓解有关。
研究问题与背景
初诊儿童肿瘤的低突变负荷与治疗后演化可能存在差异。作者用详细药物记录解释全基因组突变特征,结合时间信息区分未检出与足够条件下仍阴性的样本,再探索RNA耐药状态和后续用药反应。
贡献与比较对象
KZM为KiCS285、ZERO264、MSK62份样本,合计611。正文报告544位患者;临床状态为primary342、advanced269。advanced涵盖进展/复发原位、转移和第二肿瘤,并非统一复发队列。主要为跨患者观察性比较;治疗后初诊原位与治疗后进展期取样时间不同。
新增目录外特征SBS288L5、DBS78H2的主要贡献是改进铂类暴露痕迹检出及候选疗效分层。文中“novel”相对于COSMIC v3.2目录,部分特征已有既往报道,不能全部称首次发现。
方法与验证
- WGS分析SBS/DBS/ID/SV/CN;各类别可评价样本数不同。SBS低负荷577、超突变34分别处理;SBS分析使用288通道记录转录链偏向。
- 突变负荷采用秩转换、年龄/性别/纯度回归与ANOVA、两两Wilcoxon及BH调整;肿瘤类型定点比较的多重检验范围另行限定。
- 药物特征关联调整年龄/性别/纯度,至少5份暴露样本,回归系数≥0.7、AUROC≥0.7,并经5,000次置换产生单侧经验P<0.05;未把这些条件写成所有比较均BH校正。
- 独立PROFYLE/POG验证,51份约1,000×深度靶向测序;亚克隆谱型探索;RNA表达68份样本,两个基因的重复记录另计。
- 成人166例既往及再次铂类暴露,以疗效分类比较特征阳性;CMH按组织学或取样部位分层,以及回归调整作为补充。
核心证据
| 主张或结果 | 数字、条件 | 页序/图表 | 依据类型 | 核对状态 |
|---|---|---|---|---|
| 队列 | 611样本,正文报告544患者;约57%治疗后;86药物、>3,200记录 | 主1–3,图1,补5,S1–4 | 正文/图/长表定点 | 已核;原始口径差异见coverage |
| 突变负荷 | primary-naive 0.726 vs advanced-treated 1.64 SBS/Mb | 主4,图2,扩展图1–2 | 正文/图 | 已核;横断面组间比较 |
| 时点 | 从治疗开始到取样:primary-treated中位109天,advanced-treated622天 | 扩展图1 | 图/图注 | 已核 |
| 特征总数 | 65 COSMIC、29目录外,跨5突变类别;SBS/DBS/ID合计69、其中20目录外 | 主4–6,图3,补12–20 | 正文/图 | 已核;目录外不全等于首次发现 |
| 铂类暴露与既有特征 | 暴露173/611,已知三特征71/173(41%) | 主4–6,图3,扩展图5 | 正文/图 | 已核 |
| 低负荷突变归属 | 577样本,治疗SBS 11.23%已知+8.7%目录外≈19.93% | 图3a | 图 | 已核;不用正文15.1%与该口径互换 |
| 新增铂类特征 | SBS288L5、DBS78H2,与暴露关联并在PROFYLE及POG验证 | 主5–6,扩展图6–8,S21–25 | 正文/图/短表及长表定点 | 已核 |
| 检出边界 | 有完整时点141/173;bulk最早91天;最低1,454 SBS≈0.5/Mb | 主6–7,图4a,图4源数据 | 正文/图/源表 | 已核;经验检测边界 |
| 检出提升 | 时间≥91天且SBS数≥1,454,共111;已知65/11158.6%,加入新特征81/11173.0%;16样本、14.4百分点 | 图4a,源表 | 正文/图/源数据 | 已核 |
| 时间曲线 | 铂类12月18/51=35.3%;18月47.9%,33月51.9% | 主6–7,图4b,源表 | 正文/图/源数据 | 已核;累积取样中的阳性比例 |
| 深度测序 | 51独立样本;11早期、14阈值上阴性、26阳性;6低时间低负荷为11子集 | 主第6页,补图7 | 正文/图 | 已核;不相加为57 |
| 亚克隆 | 10新分配,5排为假阳性,5有支持;其中3在bulk已有其它铂类特征 | 主第9页,扩展图10a、补图8、S26 | 正文/图/表 | 已核;不是5个完全漏检肿瘤 |
| RNA | 68独立样本,31阳性阈值上/25阴性阈值上/12阴性阈值下;两基因共136记录 | 主11–12,图5a,源表 | 方法/图/源数据 | 已核;独立样本与记录区分 |
| 耐药相关表达 | GSTA1、ABCC2阳性组较高;对阈值上阴性组BH P=0.0108、0.0016 | 图5a | 图 | 已核;模型未充分纳入肿瘤类型 |
| 成人再治疗 | n166;PD77/106、SD19/35、PR/CR12/25为各疗效类别内特征阳性 | 主8,图5c,源表 | 正文/图/源数据 | 已核 |
| 疗效关联 | PD vs PR/CR OR2.88(1.06–7.74)P0.0302;PD vs SD OR2.24(0.93–5.28)NS | 图5c | 图 | 已核;同时保留显著/未显著比较 |
| 调整分析 | 组织学CMH OR3.41 P0.0097;部位OR3.20 P0.0176;回归OR2.98 P0.018 | 主8,图5图注 | 正文/图注 | 已核;未编造区间 |
| 驱动变化 | 高置信455事件/129基因;4工具识别39个COSMIC基因;未见单一驱动基因显著富集 | 主第4、9页,扩展图2、S5–6 | 正文/图/表 | 已核;计算候选未作功能验证 |
局限与待解问题
作者明确指出
多药暴露、缺少全面配对样本、儿童低突变负荷和取样间隔限制归因。统计检出与真实损伤发生有时间及灵敏度差异;部分低频药物不能开展可靠的关联分析。突变特征、驱动基因、RNA状态和耐药的联系尚需功能和前瞻临床研究。
AI推断与理由
治疗史与肿瘤演化阶段纠缠,当前特征阳性可能同时记录DNA损伤、修复能力和存活克隆选择。成人跨癌种再次用药观察需要进一步控制累计暴露、既往疗效和再次治疗选择。可在同癌种/同铂类方案内,用配对与连续样本检验特征相对现有临床信息的增量,再检验基于分层选择替代治疗的价值。上述为后续问题,非本研究已完成结论。
待核对问题与后续阅读
正式原始材料内部的样本数量、表格分组及措辞差异已逐项记录coverage.md。长表仅核查结构、有关变量/关键条目;患者原始测序、其余图源数据、完整代码和引用研究未逐项重算或通读。将来若用于独立预测模型或再分析,需另行解决标识映射、分母和时间定义。