研究问题与设计
原发瘤中的哪些细胞能够启动转移,以及这种能力怎样被代谢环境改变,是本文的核心问题。作者在结直肠癌模型中识别出一条联系:神经酰胺合成增强,推动YAP驱动的再生状态,并提高肝转移能力。
| 研究部分 | 用来回答的问题 |
|---|---|
| 小鼠CRC类器官原位移植 | 比较不同饮食下的原发瘤、肝转移和生存;包括AKP及另外两种基因背景 |
| 单细胞转录组与Basp1报告系统 | 定位YAP驱动的再生样细胞,再分选或清除该群体 |
| 连续移植、脂质组及ATAC-seq | 检查撤除高脂环境后,转移倾向和代谢/染色质变化是否持续 |
| DEGS1、ASAH1及PP2A干预 | 从合成、降解与下游信号三个环节检验机制 |
| 人类组织与3株患者来源类器官 | 核查相应表达状态及转移表型在人类材料中的存在 |
主模型AKP包含Apc、Kras和Trp53改变。高脂组采用脂肪供能60%的饮食,对照为蔗糖匹配的精制饮食;实验重点是肿瘤细胞状态及转移过程。
高脂饮食增加肝转移
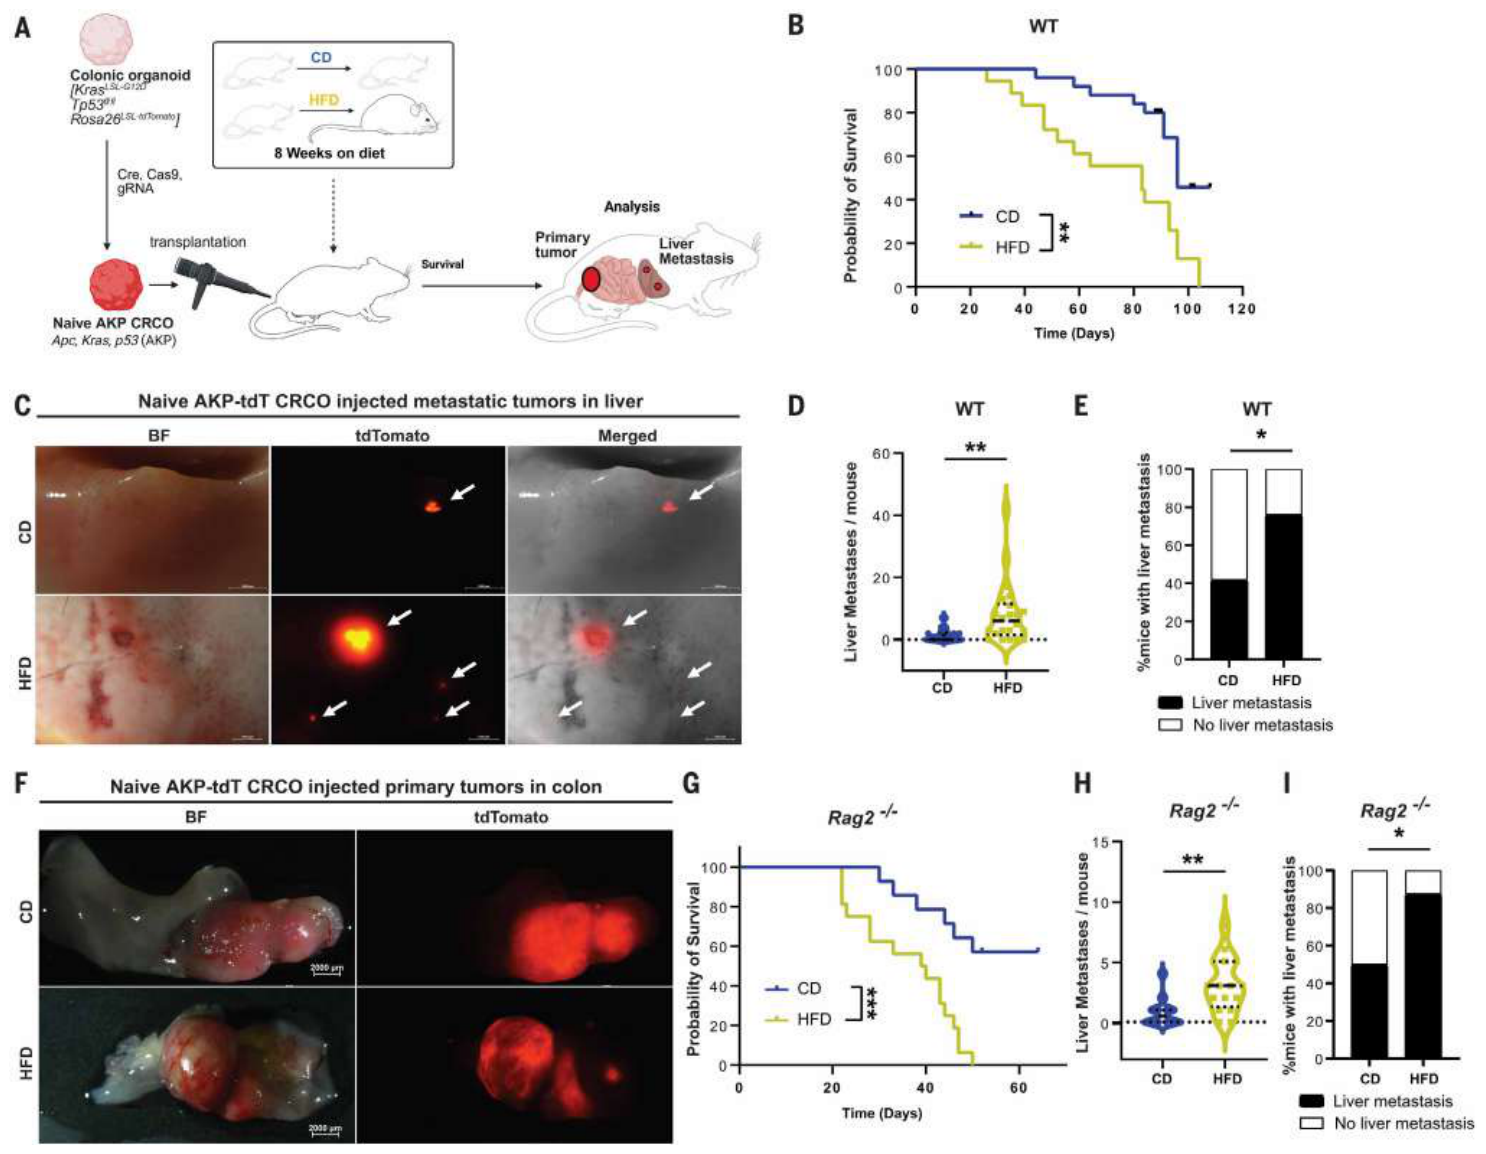
在免疫完整小鼠中,高脂饮食增加肝转移数量及发生比例,并缩短生存。图1中的生存分析为对照25只、高脂18只;转移分析为26只与22只,两个终点的分析分母分别保留。
在缺乏成熟T、B细胞的Rag2缺陷小鼠中,也观察到肝转移增加。该结果支持存在不依赖适应性免疫的作用环节。两组原发瘤质量在相应终点未见显著差异。
Basp1高表达群体具有较强的转移启动能力
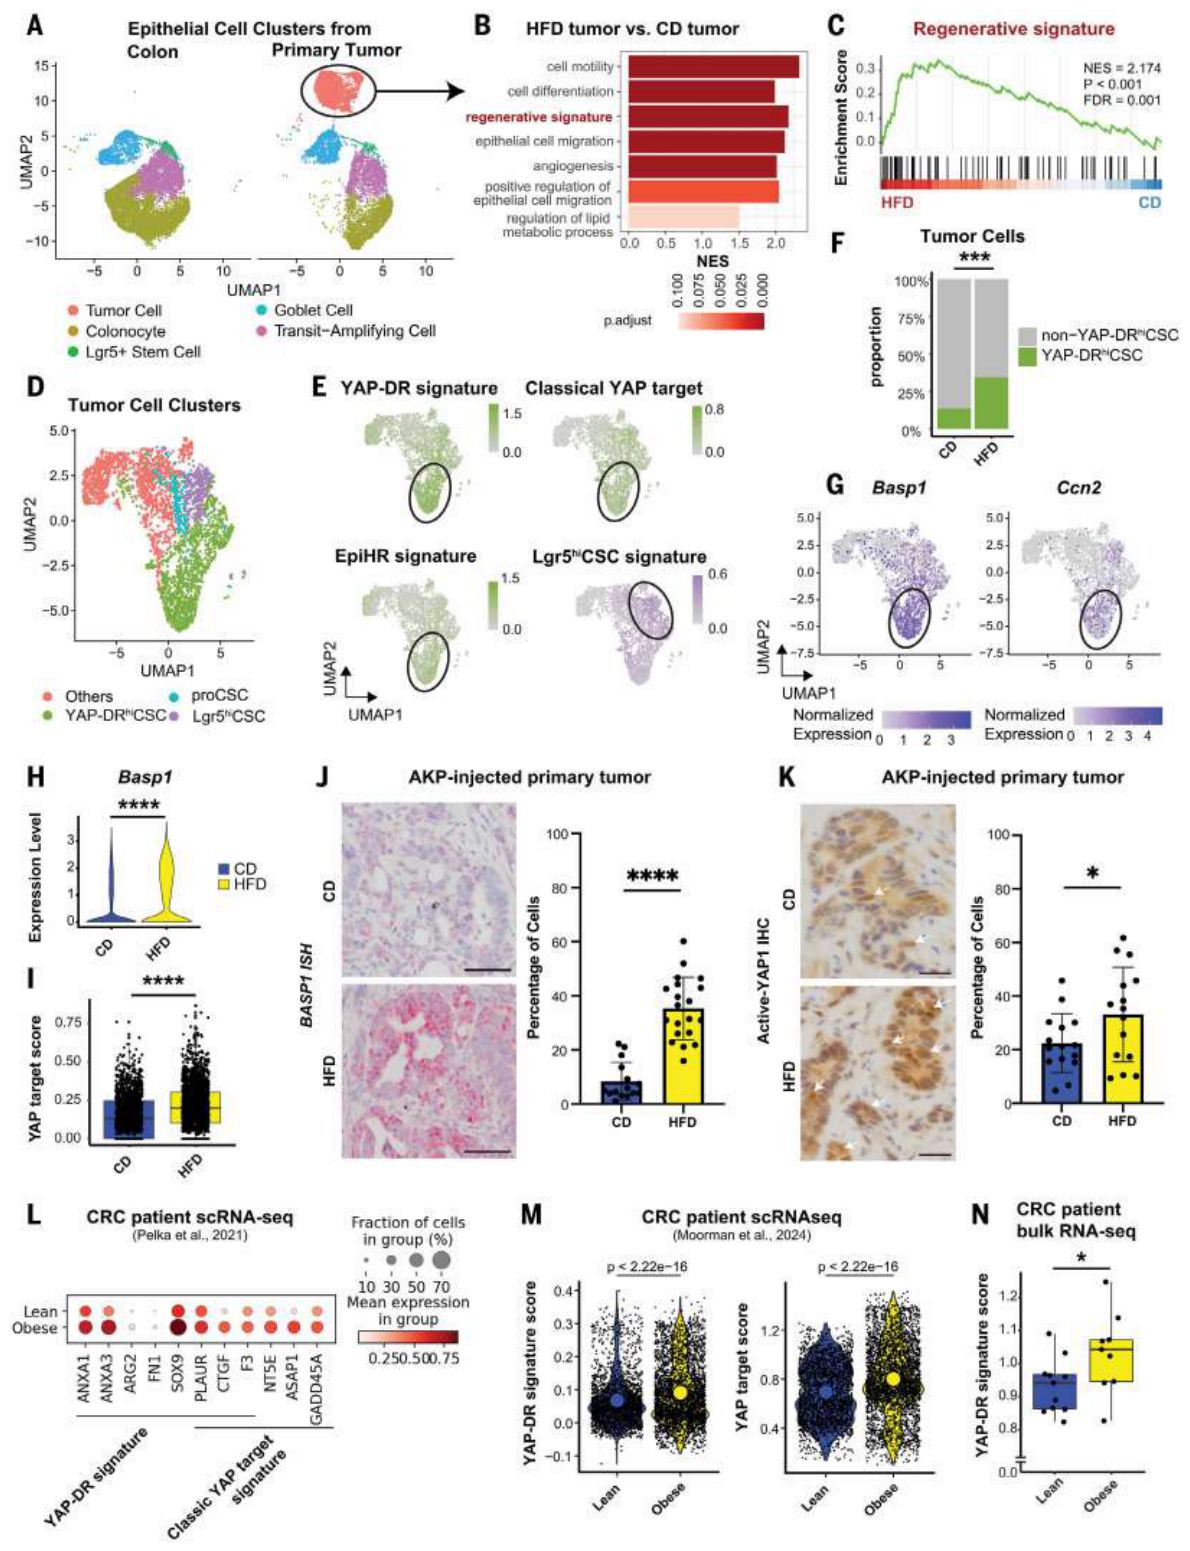
肿瘤单细胞分析识别出Lgr5高表达、增殖型及YAP驱动再生型三类干细胞状态。高脂组的YAP再生型群体增加超过两倍,并伴随YAP靶基因、再生程序及转移复发风险相关表达的升高。Basp1在这一群体中较高,可作为本研究的分选与追踪标记。
人类数据提供了相应的表达联系:在CRC伴肝转移的数据中,肥胖患者的YAP及再生程序评分较高。图2n的TCGA分析限于Ⅳ期患者,瘦组11例、肥胖组9例,采用单侧检验,P=0.0250。
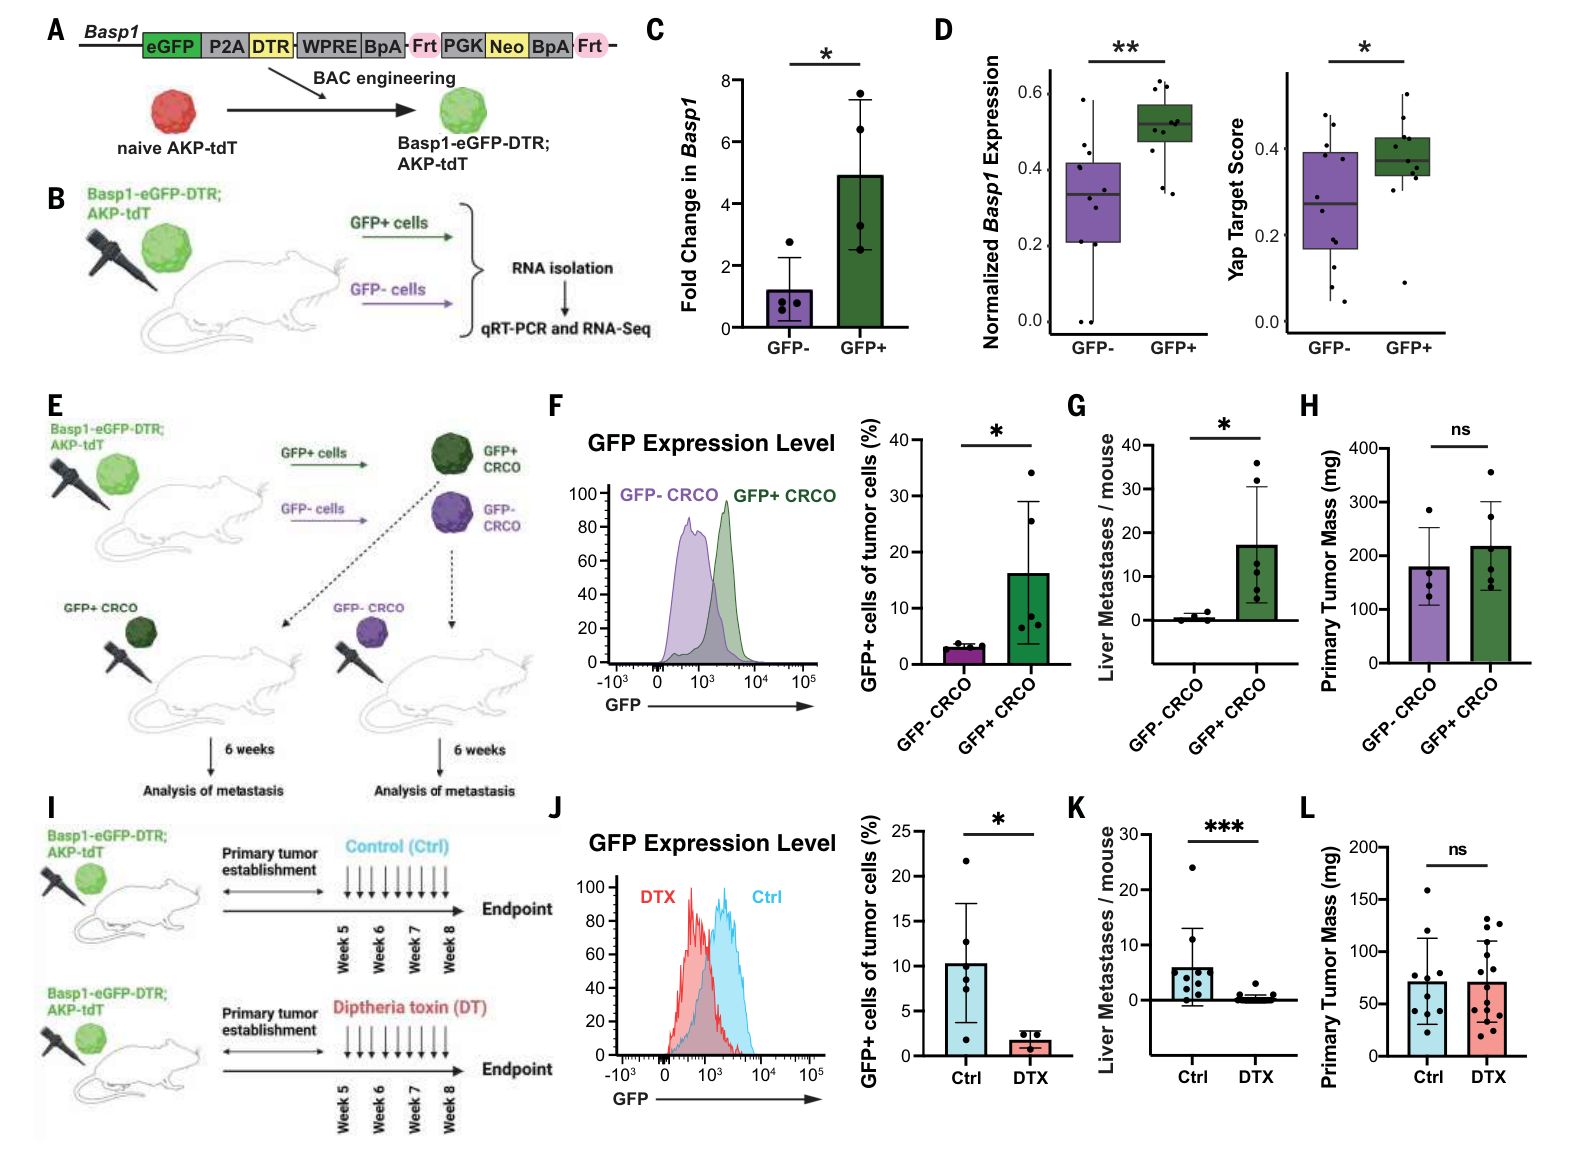
作者建立Basp1-eGFP-DTR报告系统。分选后培养的GFP阳性类器官保留较高的Basp1阳性比例,移植后产生更多肝转移;相应原发瘤质量未见显著差异。
在原发瘤建立后,利用DTR系统清除Basp1高表达细胞,同样减少肝转移。这里检验的是这一细胞群体的功能贡献,Basp1用于标记和清除群体。
撤除高脂环境后,转移倾向仍可持续
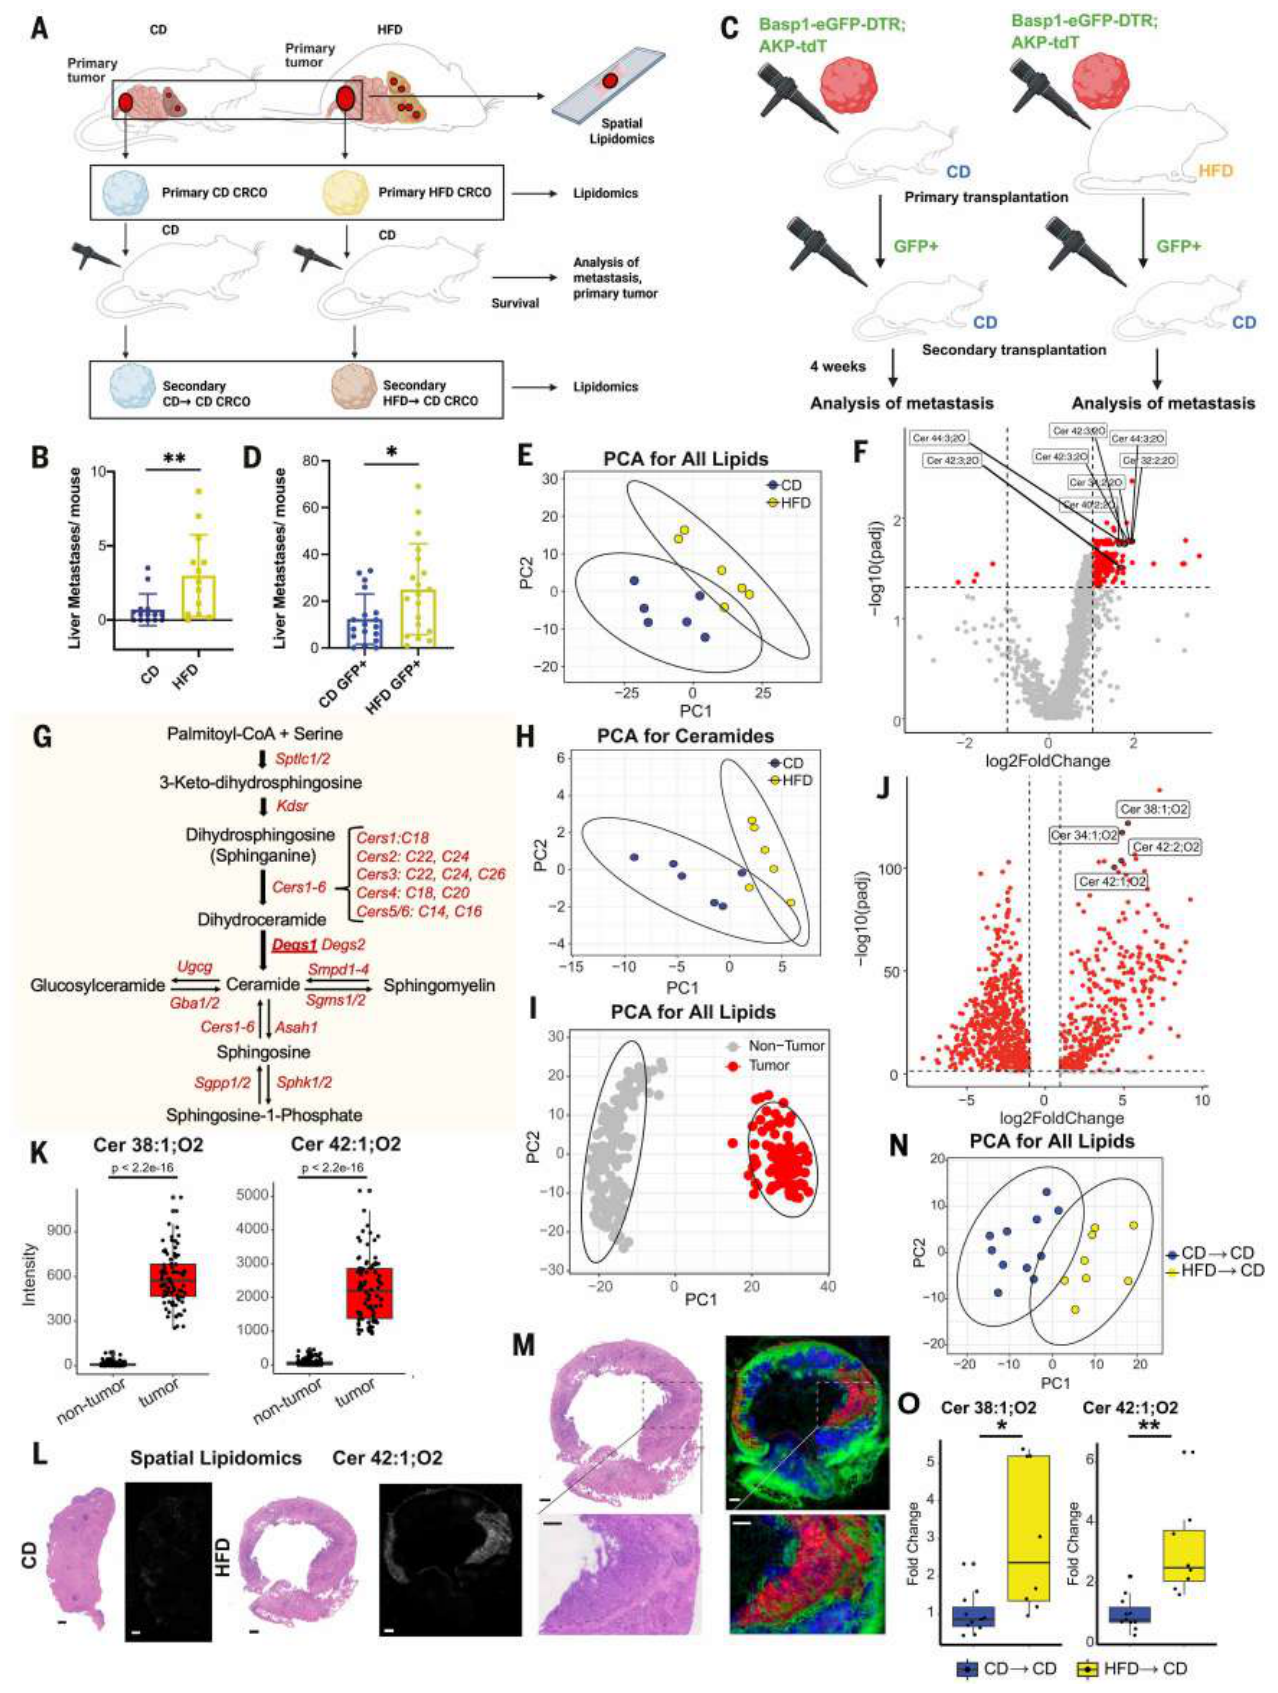
作者从高脂或对照小鼠的原发瘤中建立类器官,再移植到统一接受对照饮食的受体。曾经暴露于高脂环境的类器官仍产生更多肝转移。
进一步分选等量Basp1阳性细胞后,来自高脂组的细胞仍具有更强的转移能力。这一比较把阳性群体数量与群体内部持续的状态变化进一步区分开。
脂质组分析显示,高脂来源类器官中有249种脂质上调,神经酰胺是最明显的类别之一。空间脂质组将相应神经酰胺定位到肿瘤区域;再次移植并培养后,部分脂质差异仍保留。
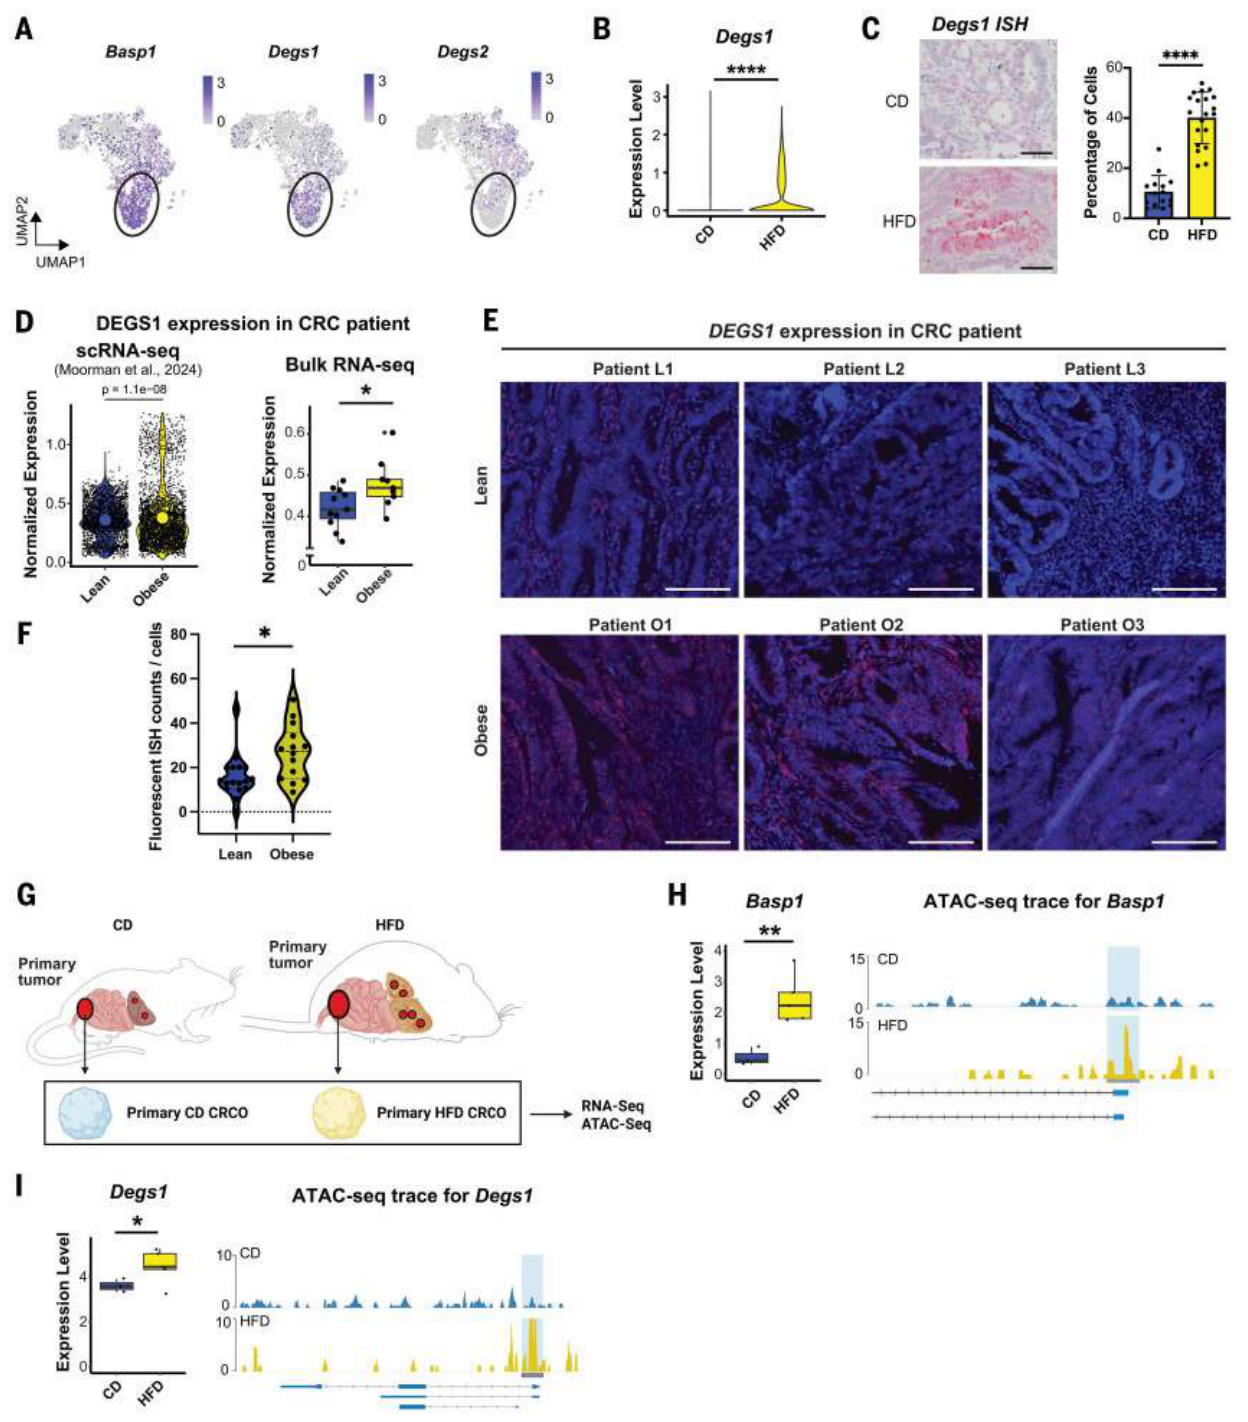
DEGS1及CERS2与Basp1高表达状态相伴。DEGS1负责神经酰胺从头合成的末端转换;高脂来源类器官中,Basp1、Degs1表达和相应染色质可及性均较高。
人类组织中的DEGS1原位检测来自瘦组3位、肥胖组3位患者,图5E–F展示各患者的多个视野;视野数与患者数分别理解。
合成与降解干预支持神经酰胺–PP2A–YAP机制
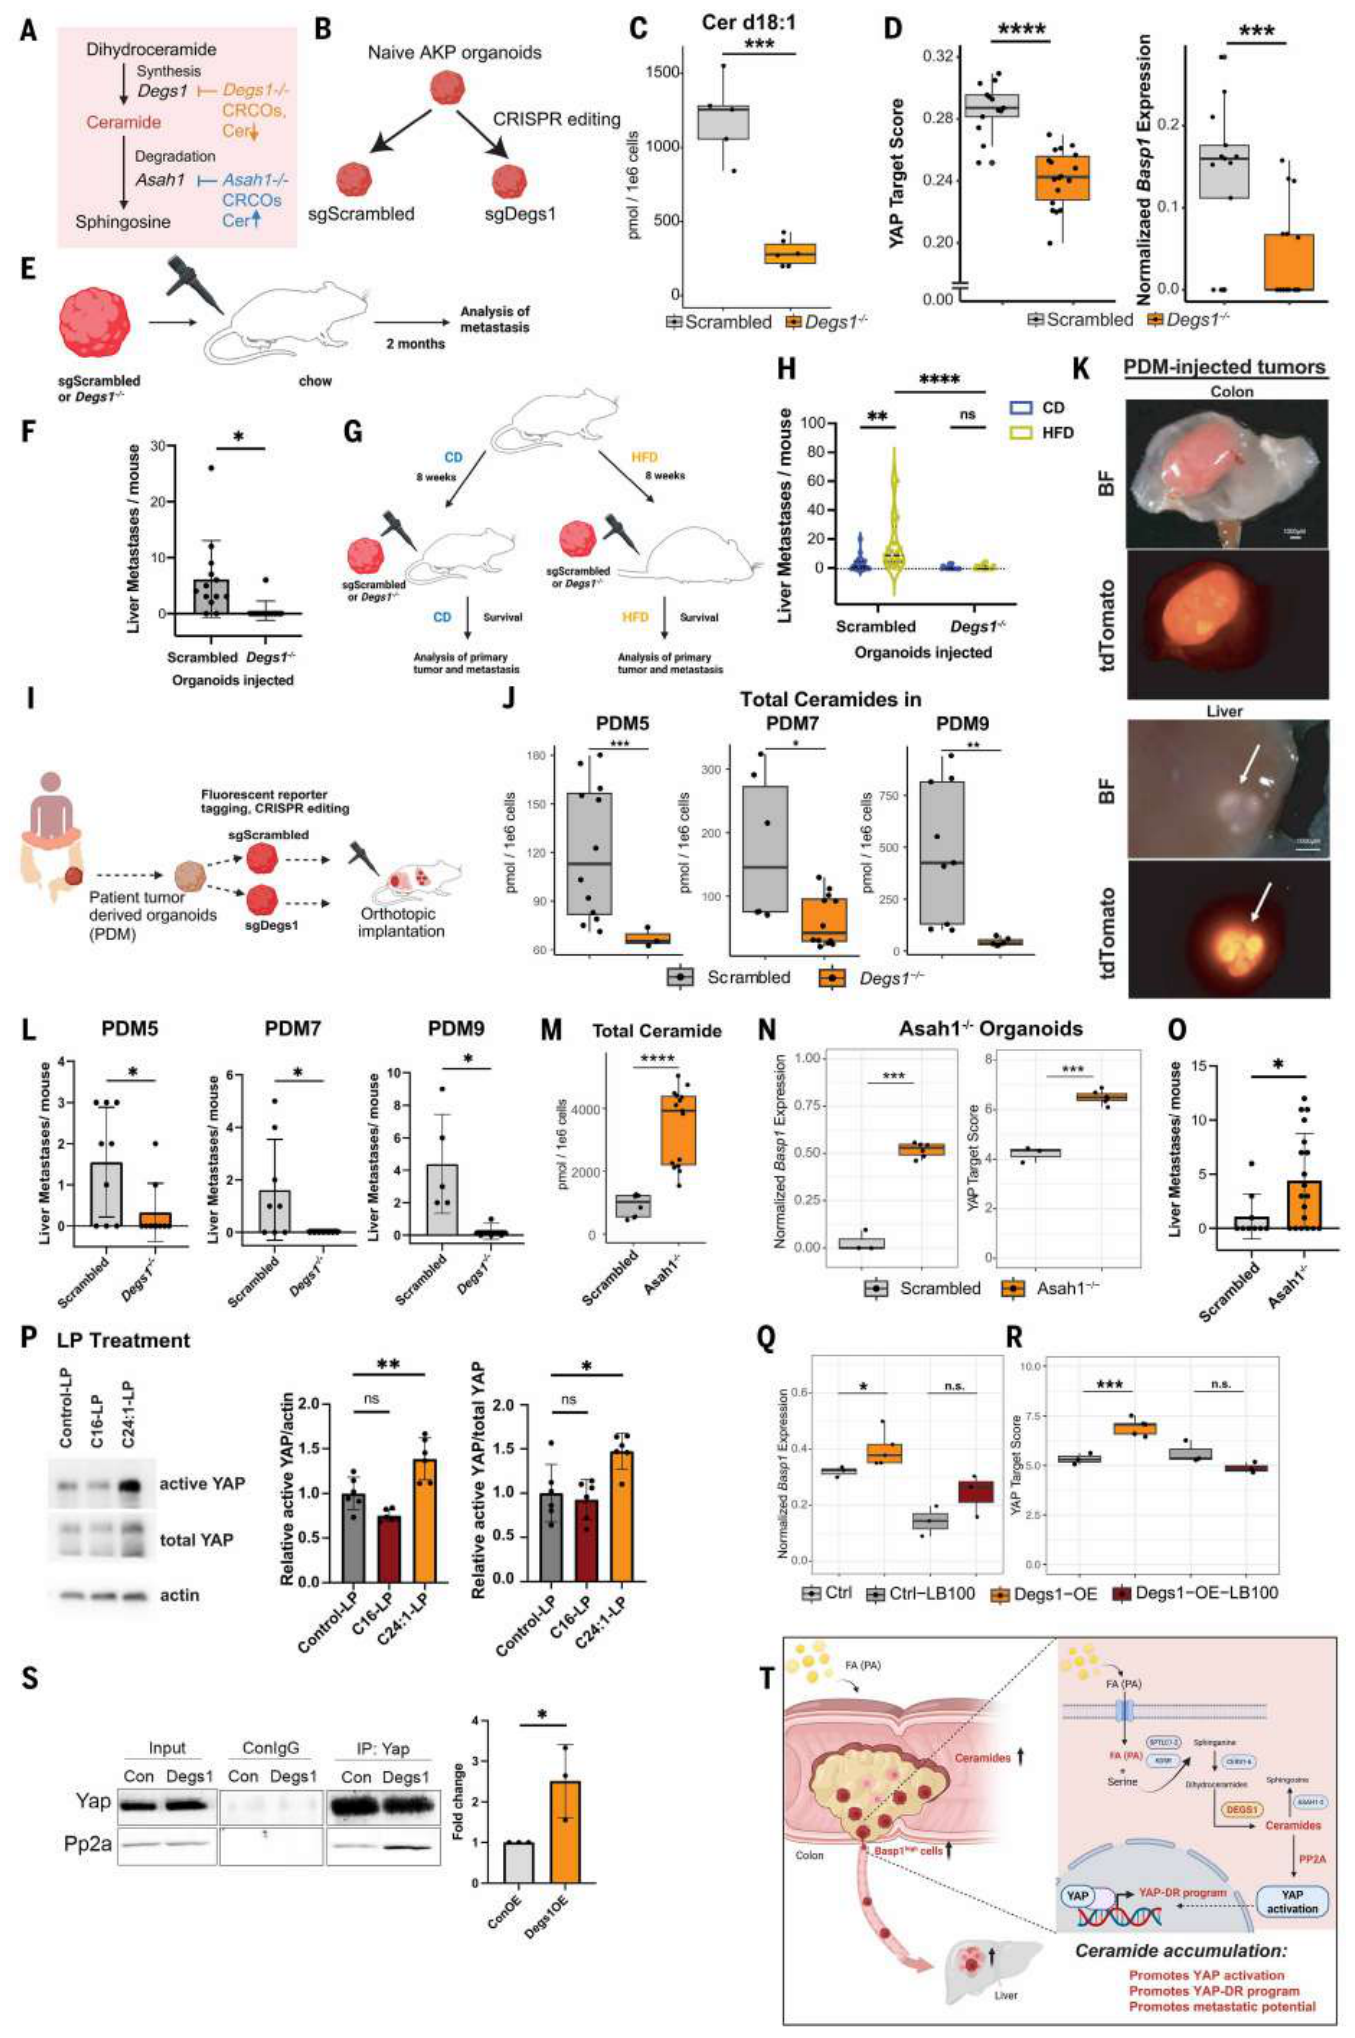
破坏Degs1降低神经酰胺水平、YAP相关表达和肝转移。该结果在多种小鼠基因背景及3株患者来源类器官中出现。在高脂饮食条件下,Degs1缺失也削弱了转移增加,但生存并未完全恢复,原发瘤仍构成持续负担。
相反,破坏神经酰胺降解酶Asah1导致神经酰胺积累,增强YAP相关程序并增加肝转移。这种方向相反的干预,为神经酰胺池与转移状态的关系提供了功能证据。
神经酰胺的具体种类也影响作用。图6p中,极长链C24:1神经酰胺脂质体显著提高活性YAP,C16在相同测试下未达显著。正文报告神经酰胺升高伴随PP2A磷酸酶活性增强;主图中的PP2A抑制及共免疫沉淀结果,进一步支持PP2A介导YAP去磷酸化和再生程序激活的模型。
局限与待解问题
干预证据主要来自类器官及移植模型。人类材料支持表达联系,尚缺乏根据这条通路进行治疗的临床结果。神经酰胺的链长、生成途径及细胞区室均会影响作用,药物开发需要相应的选择性。
多项原发瘤质量比较未见显著差异,研究未进行等效性检验。减少转移与延长总体生存之间,还受原发瘤负担、观察时间和干预时点影响。
连续移植显示表型可持续, bulk RNA与ATAC分析支持稳定的群体层面变化;细胞状态诱导、已有亚群选择及不同克隆的贡献仍需进一步区分。高脂模型和人类肥胖关联的证据范围不同,饮食调整或抑制神经酰胺合成对患者的实际获益需另行验证。
独立补充材料未取得,补图S1–S15及补表S1–S12中的部分机制与队列细节,本页按正文转述,实际范围保存在阅读记录中。
进一步理解
这篇研究把代谢改变放在“细胞获得什么功能”这一层解释。DEGS1的作用重点是提高转移相关状态的可达性和持续性,因此评价该通路需要同时观察原发瘤、转移形成及生存。
一个后续问题是:在转移已经形成以后,阻断神经酰胺–YAP轴还能改变多少疾病进程。本文的主要证据围绕转移启动与形成,这一时序问题将影响干预策略的定位。
主图与表格 · 6 张
图1 · PDF 第 3 页
Fig. 1. High-fat diet feeding promotes colorectal cancer liver metastasis. (A) Schematic depicting experimental setup. Wild-type (WT) C57BL/6J mice fed a CD or HFD for 8 weeks were transplanted with engineered naive AKP CRCOs. Survival was followed up to 15 weeks, and primary tumor burden (mass) and liver metastasis (number and frequency) were analyzed at the end point. (B) Survival curves in CD and HFD-fed WT C57BL/6J mice. HFD-fed mice had significantly lower survival. Log-rank (Mantel-Cox) test; n = 25 (CD) and 18 (HFD) mice per group. (C) Representative brightfield (BF) and fluorescent images of metastatic tumors in the liver. Scale bars, 2000 μm. (D) Number of liver metastasis (>100 μM) per mouse from CD and HFD mice, represented as violin plots. Each dot represents a mouse; n = 26 (CD) and 22 (HFD) mice per group, two-tailed Student’s t test. The three dashed lines in the violins from top to bottom represent top quartile (75th), median, and bottom quartile (25th), respectively. Dashed horizontal line at y = 0 reference line; y axis extends below zero to display the full kernel density estimate of the violin plot. All observed values are ≥0. (E) Frequency of liver metastasis in CD and HFD cohorts; n = 26 (CD) and 22 (HFD) mice per group, Fisher’s exact test. (F) Representative brightfield and fluorescent images of primary tumor in the colon. Scale bars, 2000 μm. (G) Survival curves of CD and HFD-fed Rag2−/− mice transplanted with AKP-tdT CRCOs; 75,000 CRCO-derived cells per mouse, similar to the experiment described in (A). Survival was followed up to 9 weeks, and primary tumor burden (mass) and liver metastasis (number and frequency) were analyzed at the end point. HFD-fed mice had significantly lower survival; n = 14 (CD) and 16 (HFD) mice per group, log-rank (Mantel-Cox) test. (H) Number of liver metastasis (>100 μM) per mouse from CD and HFD mice, represented as violin plots. Each dot represents a mouse; n = 12 (CD) and 16 (HFD) mice per group, two-tailed Student’s t test. The three dashed lines in the violins from top to bottom represent top quartile (75th), median, and bottom quartile (25th), respectively. Dashed horizontal line at y = 0 reference line; y axis extends below zero to display the full kernel density estimate of the violin plot. All observed values are ≥0. (I) Frequency of liver metastasis in CD and HFD cohorts; n = 12 (CD) and 16 (HFD) mice per group, Fisher’s exact test. *P < 0.05, **P < 0.01.
图2 · PDF 第 5 页
Fig. 2. High-fat diet engages a YAP-DR program in CRC. (A) Uniform manifold approximation and projection (UMAP) plots of epithelial cell populations in normal colons and AKP-injected colon tumors revealed by scRNA-seq. The following analysis in (B to I) was performed on tumor cells from 3 mice per group. (B) Bar plot of enriched pathways in colon tumors from HFD-fed mice compared with the CD group by GSEA. (C) Enrichment scores for genes in the regenerative signature gene set, hereafter referred to as YAP-DR. (D) UMAP plot of reclustered tumor cells from epithelial cells in (A). (E) UMAP plots of expression of EpiHR, YAP-DR, YAP target signatures, and Lgr5high CSCs in tumor cells. (F) Stacked bar plot showing increased YAP-DRhigh cell frequency in colon tumors from HFD-fed mice compared with the CD group. Fisher’s exact test. (G) UMAP plots of Basp1 and Ccn2 (a YAP target) expression in tumor cells. (H) Violin plot showing increased expression level of Basp1 in colon tumors from HFD-fed mice compared with the CD group (P < 2.2 × 10⁻¹⁶). (I) Box plot showing increased expression level of YAP targets in colon tumors from HFD-fed mice compared with the CD group [two-tailed Student’s t test for (H) and (I)]. (J) Representative images (scale bars, 20 μm) and quantification of in situ hybridization (ISH) for Basp1 in colon tumors from CD- and HFD-fed mice. Two-tailed Student’s t test. Each dot represents a field quantified as percent positive cells of total cells per 400 μm2 (n = 15 fields from 3 mice for CD group and 20 fields from 4 mice for HFD group). (K) Representative images (scale bars, 20 μm) and quantification of immunohistochemistry (IHC) for active YAP nuclear localization in colon tumors from CD- and HFD-fed mice [one-tailed Student’s t test for (J) and (K)]. Each dot represents a field quantified as percent positive cells of total cells per 400 μm2 (n = 15 fields from 3 mice for both CD and HFD groups). The height of bars indicate mean, and error bars indicate SD. (L) Dot heatmap of individual YAP targets in tumor cells of scRNA-seq data from lean and obese CRC patients (35). (M) Violin plots of YAP-DR signature and YAP target scores in tumors from obese and lean CRC patients (4). Two-tailed Student’s t test. (N) Box plot of YAP-DR signature expression (BASP1, CLU, CCND1, CCND2, CXADR, ANXA1, ANXA3, and CD44) in tumors from lean (n = 11) and obese (n = 9) CRC patients, TCGA stage IV. P = 0.0250, one-tailed Student’s t test. In box plots, the middle lines indicate median, and the top and bottom edges of boxes indicate the third (75th) and first (25th) quartiles. *P < 0.05, ***P < 0.001, ****P < 0.0001.
图3 · PDF 第 6 页
Fig. 3. Basp1high CSCs are the origin of liver metastasis. (A) Schematic of generation of naïve Basp1-eGFP-DTR; AKP-tdT organoids. (B) Schematic showing fluorescence- activated cell sorting (FACS) of GFP+ and GFP− cells isolated from Basp1-eGFP-DTR; AKP-tdT–injected tumors. (C) Quantitative RT-PCR demonstrating significantly higher Basp1 expression in GFP+ cells, indicating that GFP+ cells are Basp1high cells. Each dot represents a mouse, n = 4 mice per group, two-tailed Student’s t test. The height of bars indicates mean, and error bars indicate SD. (D) Significantly higher expression of Basp1 and YAP targets in GFP+ cells as detected by transcriptomic analysis. Each dot represents a mouse, n = 12 (GFP−) and 11 (GFP+) per group. In box plots, the middle lines indicate mean and the top and bottom edges of boxes indicate the third (75th) and first (25th) quartiles. (E) Schematic showing generation of GFP− and GFP+ CRCOs used subsequently in experiments shown in (F to H). GFP− and GFP+ cells were sorted from Basp1-eGFP-DTR; AKP-tdT–injected tumors and propagated as CRCOs. GFP− and GFP+ CRCOs were then orthotopically transplanted into mice, 200,000 CRCO-derived cells per mouse, and analyzed at 6 weeks posttransplantation to ascertain resulting primary tumor and metastatic potential. (F) GFP+ CRCOs tend to retain a significantly higher proportion of GFP+ cells as detected by flow cytometry. n = 4 (GFP− CRCO) and 5 (GFP+ CRCO) per group, two-tailed Student’s t test. The height of bars indicates mean, and error bars indicate SD. (G) Liver metastasis per mouse in GFP− CRCO–injected and GFP+ CRCO–injected mice. GFP+ CRCOs showed significantly higher metastatic potential. n = 4 (GFP− CRCO–injected) and 6 (GFP+ CRCO–injected) mice per group, two-tailed Student’s t test. The height of bars indicates mean, and error bars indicate SD. (H) Primary tumor mass in GFP− CRCO–injected and GFP+ CRCO–injected mice. No significant difference was observed. n = 4 (GFP− CRCO–injected) and 6 (GFP+ CRCO–injected) mice per group, two-tailed Student’s t test. The height of bars indicates mean, and error bars indicate SD. (I) Schematic of depletion of Basp1high tumor cells in vivo leveraging diphtheria toxin receptor (DTR) expression in Basp1high cells. Mice injected with Basp1-eGFP-DTR; AKP-tdT, 100,000 CRCO-derived cells per mouse, were allowed to establish a primary tumor for 4 weeks, followed by treatment with control phosphate-buffered saline or diphtheria toxin (DT) 16.7 μg/kg, 3 times a week intraperitoneally for 4 weeks. Mice were analyzed 8 weeks posttransplantation to ascertain primary tumor and liver metastatic burden. (J) Flow cytometric confirmation that DT treatment (DTX) depletes GFP+ (Basp1high) cells. n = 6 (Control) and 3 (DTX) mice per group, two-tailed Student’s t test. The height of bars indicates mean, and error bars indicate SD. (K) Liver metastasis per mouse, Control and DT-treated cohorts (DTX). DTX significantly decreased metastasis. n = 10 (Control) and 20 (DTX) mice per group, two-tailed Student’s t test. The height of bars indicates mean, and error bars indicate SD. (L) Primary tumor mass in Control and DTX cohorts. No significant difference was observed. n = 10 (Control), 15 (DTX), two-tailed Student’s t test. The height of bars indicates mean, and error bars indicate SD. *P < 0.05, **P < 0.01, ***P < 0.001; ns, not significant.
图4 · PDF 第 7 页
Fig. 4. Comprehensive lipidomic profiling reveals tumor and diet induced enrichment of ceramide metabolism. (A) Schematic of spatial lipidomic analysis of primary tumors, generation of primary tumor-derived AKP organoids (primary CD and HFD CRCOs), followed by analysis of metastatic potential (in CD recipient mice) and lipidomics, and generation of secondary CD→CD and HFD→CD CRCOs followed by lipidomic analysis. (B) Liver metastasis burden per mouse of CD recipient mice injected with primary CD and HFD CRCOs. n = 14 (primary CD CRCO) and 13 (primary HFD CRCO) mice per group, two-tailed Student’s t test. The height of bars indicates mean, and error bars indicate SD. (C) Schematic of enrichment of GFP+ cells from CD and HFD primary tumors, followed by serial transplantation of equal number of GFP+ cells (50,000 per mouse) into secondary CD recipients and analysis of metastasis at 4 weeks. (D) Liver metastasis per mouse of CD recipient mice injected with CD and HFD-derived GFP+ cells. Each dot represents a mouse. n = 18 (CD-derived GFP+) and 19 (HFD-derived GFP+) mice per group, two-tailed Student’s t test. The height of bars indicates mean, and error bars indicate SD. (E) Principal components analysis (PCA) plot of all individual lipids quantified by mass spectrometry from primary CD and HFD CRCOs. Each dot represents a primary (in vivo tumor-derived) CRCO, n = 6 per group. (F) Volcano plot of up-regulated lipid species in primary HFD CRCOs organoids compared with the CD group. Each dot represents a lipid; lipids with log2FoldChange (log2FC) >1 or <–1 and adjusted P value <0.05 are highlighted. (G) Schematic of the de novo ceramide synthesis pathway in cells. Degs1, catalyzing conversion of dihydroceramide to ceramide, is highlighted. (H) PCA plot of ceramides in primary CD and HFD CRCOs. Each dot represent a CRCO, n = 6 per group. (I) PCA analysis of spatial metabolomics results for CRC gut tissue from colon of CRC-transplanted mice. (J) Volcano plot of colon of CRC-transplanted mice comparing tumor-containing and non–tumor-containing tissue regions. Ceramides are significantly up-regulated in tumor regions. Log2FC > 1.5 and Padj < 0.05. (K) Quantification of specific ceramide species in tumor and nontumor regions. Each dot represents a region of interest, n = 155 (nontumor) and 88 (tumor) per group for (I) and (K). Two-tailed Student’s t test. (L) Comparison of spatial lipidomics results for [Cer 42:2;O2+Na]+ in representative CD and HFD samples with hematoxylin and eosin (H&E) stains of the same tissue sections. Total ion current normalized intensities are indicated, and scale bars are 400 μm. (M) H&E stain and spatial lipidomics of the same HFD gut section. The ceramide [Cer 42:2;O2+Na]+ (m/z 670.6109, red) is compared with [CerP 44:2;O2+Na]+ (m/z 778.6085, blue) and [PA O-40:6+Na]+ (m/z 757.5143, green). Scale bars are 400 μm (top) and 250 μm (bottom) in the magnified views. (N) PCA plot of all individual lipids quantified by mass spectrometry from secondary CD→CD and HFD→ CD CRCOs. Secondary HFD→CD CRCOs still retain distinct lipid profiles from secondary CD→CD CRCOs. Each dot represents a CRCO, n = 11 (CD→CD) and 8 (HFD→CD) per group. (O) Box plots showing levels of specific ceramide species in the secondary CD→CD and HFD→CD CRCOs. Each dot represents a mouse, n = 11 (CD→CD) and 8 (HFD→CD) per group, two-tailed Student’s t test. The middle lines of the boxes indicate mean, and the top and bottom edges of boxes indicate the third (75th) and first (25th) quartiles. *P < 0.05, **P < 0.01.
图5 · PDF 第 9 页
Fig. 5. High-fat diet increases ceramide synthesis in YAP-DRhigh CSCs. (A) UMAP plots of Basp1, Degs1, and Degs2 expression in tumor cells. (B) Violin plot showing increased Degs1 expression in colon tumors from HFD-fed mice compared with the CD group, two-tailed Student’s t test. (C) Representative images and quantification of ISH for Degs1 in colon tumors from CD- and HFD-fed mice. Scale bars, 20 μm. Each dot represents a field quantified as percent positive cells of total cells per 400 μm2 (n = 15 fields from 3 mice for CD group and 20 fields from 4 mice for HFD group), two-tailed Student’s t test. (D) Violin plot (left) and box plot (right) of DEGS1 expression in CRC tumors from scRNA-seq [two-tailed Student’s t test (4)] and bulk RNA-seq (one-tailed Student’s t test, n = 11 and 9 per group, TCGA stage IV) of lean and obese CRC patients. (E) Representative images and (F) quantification of ISH showing increased expression of DEGS1 in colon tumors of obese CRC patients compared with lean patients. Scale bars, 50 μm. Each dot represents the average number of fluorescent puncta per cell (n = 17 fields from 3 lean patients and 14 fields from 3 obese patients), two-tailed Student’s t test. (G) Schematic showing transcriptomic and open chromatin analysis of primary CD and HFD CRCOs. (H) Box plots showing increased expression (RNA-seq) and normalized ATAC-seq tracks showing increased open chromatin regions of Basp1 and (I) Degs1 in primary HFD CRCOs compared with CD group. Each dot represents a CRCO; n = 3 (CD) and 5 (HFD) per group, one-tailed Student’s t test. In bar plots, the height of bars indicates mean, and error bars indicate SD. In box plots, the middle lines indicate median, and the top and bottom edges of boxes indicate the third (75th) and first (25th) quartiles, respectively. *P < 0.05, **P < 0.01, ****P < 0.0001.
图6 · PDF 第 10 页
Fig. 6. Ceramides activate the YAP-DR program to promote liver metastasis. (A) Part of ceramide de novo synthesis pathway highlighting Degs1 and Asah1. (B) schematic of generation of Scrambled control and Degs1−/− naive AKP-tdT organoids through CRISPR-editing. (C) Functional validation of loss-of-function deletion of DEGS1 in Degs1−/− AKP-tdT CRCOs, as seen by significant decrease in production of ceramides (Cer d18:1). Each dot represents a CRCO; n = 5 (Scrambled) and 6 (Degs1−/−) per group, one-tailed Student’s t test. (D) Box plots showing expression of YAP targets and regenerative marker Basp1 in Degs1−/− AKP-tdT CRCOs. Knockout of Degs1 significantly decreases YAP activity and Basp1 marker. Each dot represents a CRCO; n = 12 (Scrambled) and 18 (Degs1−/−) per group, two-tailed Student’s t test. (E) Scrambled and Degs1−/− AKP-tdT CRCOs were orthotopically transplanted into mice on regular chow to assess metastatic potential after 8 weeks. (F) Liver metastasis per mouse. Degs1−/− AKP-tdT CRCOs give rise to significantly less metastasis. Each dot represents a mouse; n = 13 (Scrambled) and 12 (Degs1−/−) mice per group, two-tailed Student’s t test. The height of bars indicates mean, and error bars indicate SD. (G) Scrambled and Degs1−/− AKP-tdT CRCOs were orthotopically transplanted into mice fed CD or HFD to assess impact on tumor progression. (H) Liver metastasis per mouse. Degs1−/− reversed the ability of HFD to increase metastasis, as seen in Scrambled control. Each dot represents a mouse; n = 16 (Scrambled, CD), 25 (Scrambled HFD), 18 (Degs1−/− CD), and 19 (Degs1−/− HFD) mice per group, 2-way ANOVA. The three dashed lines in the violins from top to bottom represent top quartile (75th), median, and bottom quartile (25th), respectively. Dashed horizontal line at y = 0 reference line; y axis extends below zero to display the full kernel density estimate of the violin plot. (I) Schematic showing generation of tdTomato-labeled, DEGS1−/− human CRC patient–derived organoids (patient-derived material or PDM) followed by orthotopic transplantation. (J) Functional validation of loss-of-function deletion of DEGS1 in DEGS1−/− PDMs, as seen by significant decrease in production of ceramides. PDM5: n = 12 (Scrambled) and 3 (DEGS1−/−), one-tailed Student’s t test. PDM7: n = 6 (Scrambled) and 12 (DEGS1−/−), one-tailed Student’s t test. PDM9: n = 9 (Scrambled) and 6 (DEGS1−/−), one-tailed Student’s t test. (K) Representative brightfield and fluorescent images of primary tumor in the colon and metastatic tumors in the liver when mice were transplanted with patient-derived organoids. (L) Liver metastasis per mouse. DEGS1−/− CRCOs give rise to significantly less metastasis across PDM5, 7, and 9. Each dot represents a mouse. PDM5: n = 9 (Scrambled and DEGS1−/−) mice per group, two-tailed Student’s t test. PDM7: n = 8 (Scrambled) and 7 (DEGS1−/−) mice per group, two-tailed Student’s t test. PDM9: n = 5 (Scrambled) and 4 (DEGS1−/−) mice per group, two-tailed Student’s t test. The height of bars indicates mean, and error bars indicate SD. (M) Loss of function of acid ceramidase Asah1 in Asah1−/− AKP-tdT CRCOs resulted in significantly increased ceramides. n = 8 (Scrambled) and 15 (Asah1−/−) per group, one-tailed Student’s t test, ± SD. (N) Box plots showing expression of YAP targets and regenerative marker Basp1 in Asah1−/− AKP-tdT CRCOs in RNA-seq. Knockout of Asah1 significantly increases YAP activity and Basp1 expression in two independent clones. n = 3 (Scrambled) and 5 (Asah1−/−) mice per group, one-tailed Student’s t test. (O) Liver metastasis per mouse at 4 weeks. Asah1−/− AKP-tdT CRCOs give rise to significantly higher metastasis. Each dot represents a mouse; n = 9 (Scrambled) and 19 (Asah1−/−) mice per group, two-tailed Student’s t test. (P) Immunoblot- ting of active YAP levels in AKP CRCOs treated with ceramide C16 and C24:1 liposomes (LP), 5 μM for 5 days. C24:1-LP—but not C16-LP—significantly increased active YAP. Representative images and quantification of n = 6 for control, C16-LP and C24:1-LP groups, one-way ANOVA, ± SD. (Q) Box plots showing expression of YAP-DR marker Basp1 and (R) YAP targets in Control and Degs1 overexpressing (Degs1 OE) cells, treated with or without PP2A inhibitor LB100 (5 μM). LB100 treatment reverses Degs1 OE– mediated increase in YAP-DR markers and YAP targets. n = 3 (Control), 5 (Degs1 OE), 3 (Control LB100), and 3 (Degs1 OE LB100) replicates per group, one-tailed Student’s t test. (S) Immunoblotting and quantification showing coimmunoprecipitation of PP2A catalytic subunit with total YAP in Control and Degs1 OE. Increased levels of PP2A coimmunoprecipitated with total YAP protein in Degs1 OE cells, indicating increased interaction. n = 3 (Control and Degs1 OE), one-tailed Student’s t test, ± SD. (T) Schematic summarizing overall observations. Ceramide synthesis, further enhanced by exposure to dietary fat, can activate YAP to drive YAP-DR programs which are responsible for metastatic initiation from the primary tumor. In bar plots, the height of bars indicates mean, and error bars indicate SD. In box plots, the middle lines indicate median, and the top and bottom edges of boxes indicate the third (75th) and first (25th) quartiles, respectively. *P < 0.05, **P < 0.01, ***P < 0.001, ****P < 0.0001.
完整阅读记录与证据表
文献分析
文献信息与实际范围
- 标题:Ceramide synthesis mediates colorectal cancer metastasis through a YAP-driven regenerative program
- 期刊:Science 393 (6818), eadw8520,2026-09-24;DOI 10.1126/science.adw8520
- 登记:2026-10-13;晨会2026-10-14;来源morning-report
- 状态:processing_status=partial;human_review=pending
- 读取:主PDF20页中的科学正文、6主图/图注、方法已读;引文未逐篇追读,独立补充材料返回403。实际覆盖及文字口径见coverage.md。
研究问题与方法
研究高脂环境如何改变原发CRC中的转移启动细胞状态。主模型为Apc、Kras、Trp53改变的AKP类器官原位移植,并扩展至Pten或Smad4改变背景;包括免疫完整及Rag2缺陷受体。脂肪供能60%的高脂饮食与蔗糖匹配精制对照比较,结合单细胞转录组、Basp1-eGFP-DTR系统、连续移植、脂质组及ATAC-seq。用DEGS1合成环节、ASAH1降解环节及PP2A/YAP信号干预检验功能。
证据链
| 观察或干预 | 实际结果及条件 | 位置 |
|---|---|---|
| 高脂饮食 | 免疫完整小鼠肝转移增加、生存缩短;生存n=25/18,转移n=26/22;原发瘤质量NS | 图1,第2–3页 |
| Rag2缺陷背景 | 高脂下仍增加转移,支持不依赖成熟T/B细胞的环节 | 图1g–j,第2–3页 |
| 细胞状态 | Lgr5高表达、增殖型及YAP再生型;高脂组再生型超过两倍 | 图2,第4–5页 |
| 人类表达 | Ⅳ期TCGA瘦11/肥胖9,YAP/再生评分P=0.0250,单侧;另有人类肝转移数据 | 图2,第5页及第17页方法 |
| Basp1标记群体分选/清除 | 阳性群体移植转移较多;成瘤后清除群体减少转移;检测的是群体贡献 | 图3,第6页 |
| 连续移植与等量阳性细胞 | 在对照饮食受体中,高脂来源仍有较强转移能力;群体数量与状态差异分别测试 | 图4a–f,第7–8页 |
| 脂质及染色质 | 249种脂质上调;神经酰胺富集并在二次移植后持续,Basp1/Degs1可及性较高 | 图4–5,第7–9页 |
| 人类DEGS1染色 | 瘦/肥胖各3位患者,17/14是视野数 | 图5E–F,第9页 |
| Degs1缺失 | 降低神经酰胺、YAP程序及肝转移;高脂转移增加减弱,生存未完全改善;多种模型及3株PDO | 图6a–l,第10–11页 |
| Asah1缺失 | 增加神经酰胺、YAP相关程序与肝转移;转移n=9/19 | 图6m–o,第10–11页 |
| 神经酰胺种类与PP2A | C24:1显著、C16相应比较NS;PP2A抑制及共免疫沉淀支持PP2A–YAP环节 | 图6p–t,第10–11页;活性实验为正文转述补图S14 |
DEGS1参与从头合成末端转换,ASAH1参与降解;相反方向的遗传扰动共同支持神经酰胺池的功能贡献。Basp1用于标记、分选及清除再生样群体,本文未以Basp1基因敲除验证其自身的驱动作用。PP2A/YAP共免疫沉淀显示复合物关联;对神经酰胺直接分子结合方式仍需专门实验。
AI分析
代谢通路的作用可以体现为细胞功能状态与转移能力变化,原发瘤大小不是这类干预的唯一评价终点。连续移植的持续表型,使“环境诱导状态”与“已有亚群选择”成为值得拆分的问题。转移启动、已建立转移灶的维持及总体生存应分别检验,将影响干预时序与药物定位。
局限与待解问题
功能证据以类器官/移植模型为主,人类组织样本较少,3株PDO并非临床疗效试验。原发瘤质量的NS结果未作等效性检验;转移减少的生存效应受原发负担与随访影响。神经酰胺链长、来源和细胞区室可能决定作用。独立补图S1–S15、补表S1–S12及MDAR未取得;相应结果按正文转述。脂质、单细胞及空间数据未重算,被引论文未逐篇全文验证。
人工核对
待人工确认机制强度、转移与生存终点以及补充材料缺项;状态保持pending。人工现场记录保存在discussion.md。