研究问题与设计
胰腺导管腺癌(PDAC)中,不同肿瘤细胞状态与不同免疫环境相伴。本文进一步检验:哪些肿瘤细胞产生的胞外因子,能够改变局部微环境并影响克隆生长?
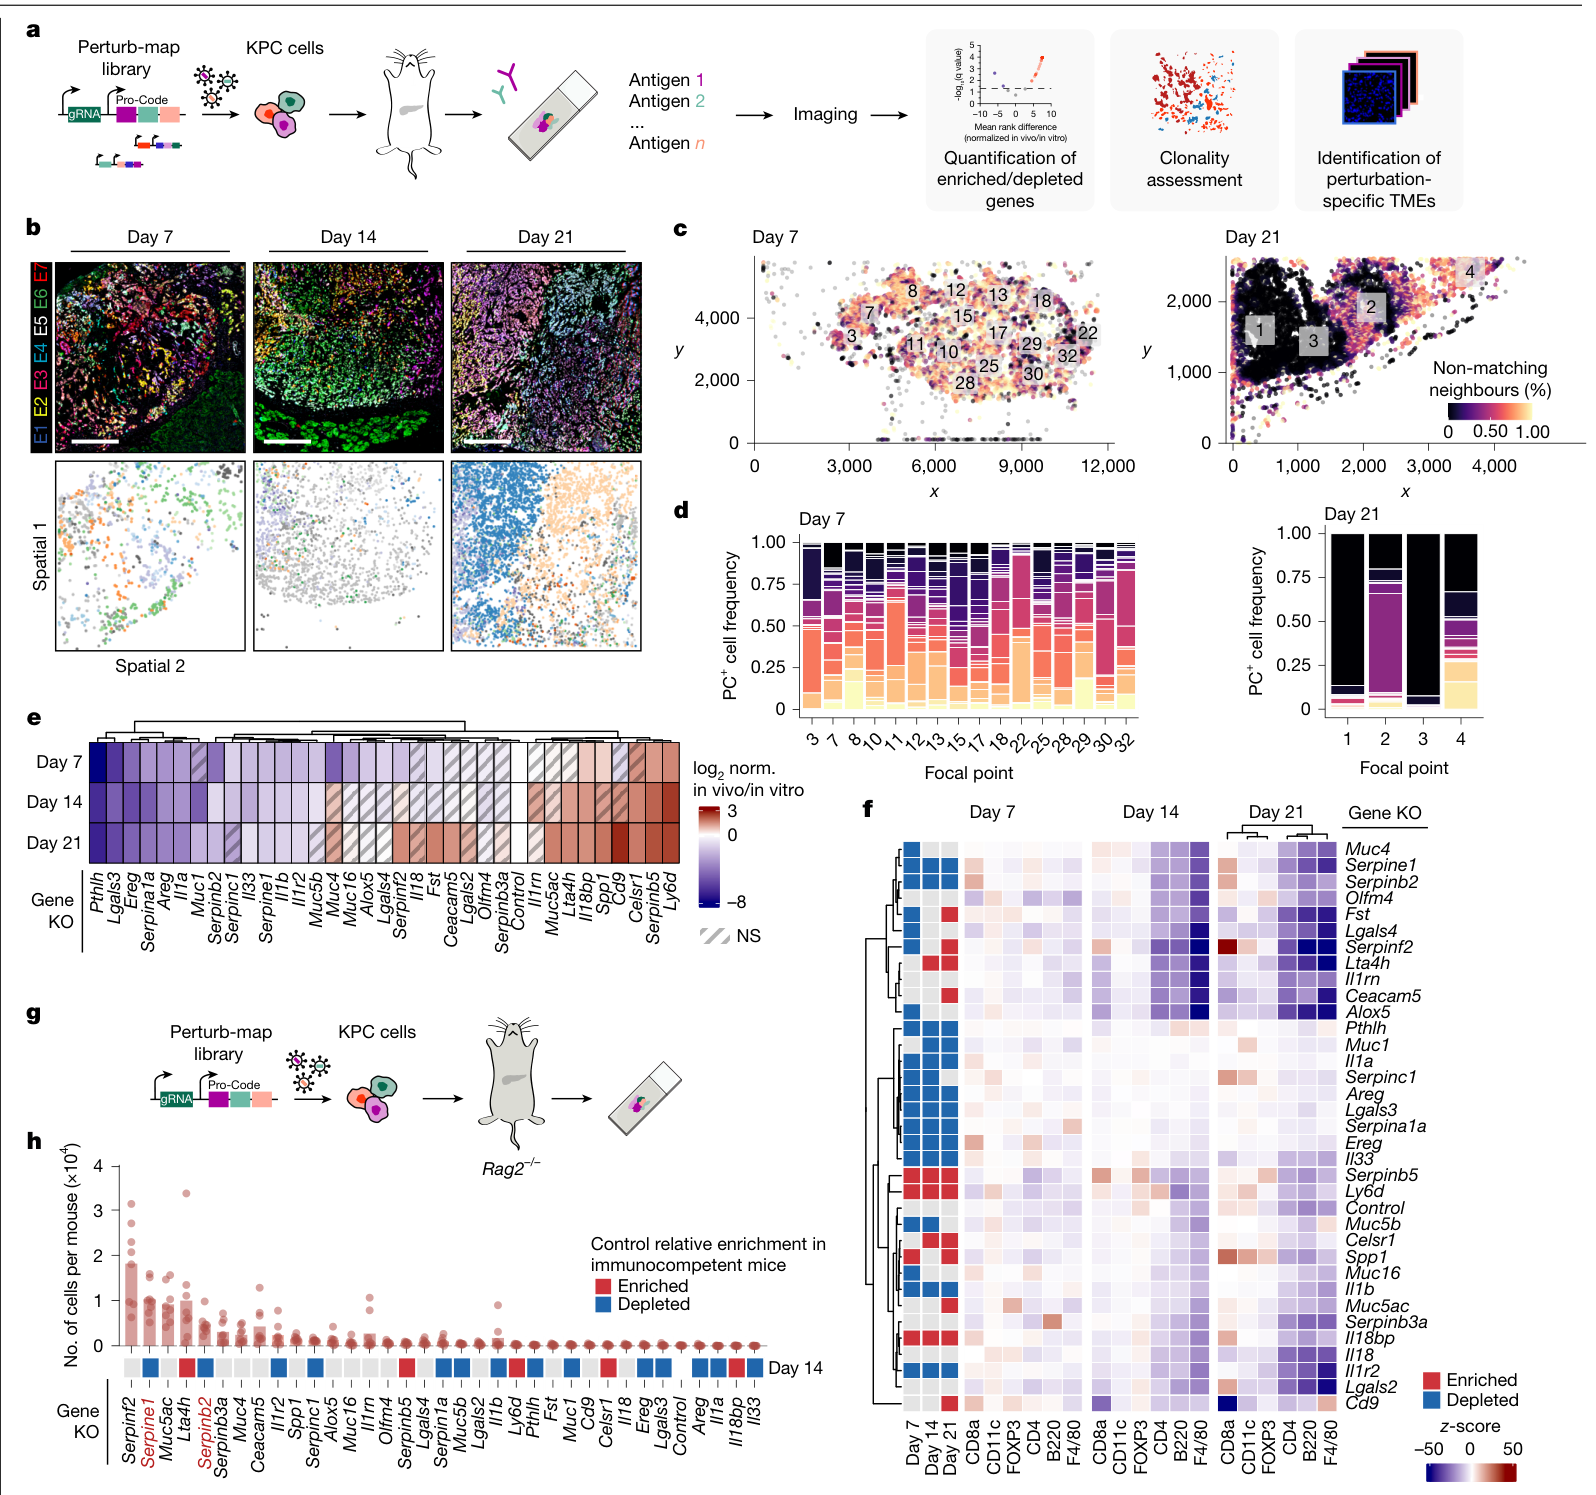
作者使用Perturb-map,将基因扰动与蛋白条码结合,在组织切片中同时定位肿瘤细胞的基因型及周围免疫细胞。筛选包括34个候选基因及F8对照,共35种带条码的细胞群体;候选选择参考了46株人类PDAC细胞系中的依赖性数据,优先考察体外生长影响较小的胞外相关基因。
| 研究部分 | 主要用途 |
|---|---|
| 小鼠原位肿瘤的空间CRISPR筛选 | 将局部免疫结构与不同扰动群体的适应度关联 |
| Serpinb2、Serpine1单独敲除 | 检验生长变化对免疫背景的依赖 |
| 单细胞、空间转录组及组织染色 | 追踪细胞状态、基质及巨噬细胞分布 |
| PAI-1、巨噬细胞和CD18干预 | 测试通路环节与PD-1阻断的组合 |
| 人类队列与混合移植 | 核查临床材料中的空间联系,以及少数生产者对邻近细胞的影响 |
空间筛选连接局部免疫环境与克隆适应度
作者在移植后第7、14、21天分别分析5、7、8只小鼠,共计超过450万个细胞。早期局部免疫细胞的分布已随基因扰动改变,之后不同肿瘤细胞群体的相对丰度逐渐分化。第21天有11种扰动群体富集、12种减少。
这些时间点来自不同小鼠。空间细胞数描述测量规模,独立小鼠是生物学重复。
在免疫完整模型中减少、在Rag2缺陷背景下恢复的群体中,Serpinb2与Serpine1成为重点。两者分别编码PAI-2与PAI-1,是纤溶系统的抑制因子。
Serpin缺失的生长效应依赖免疫背景
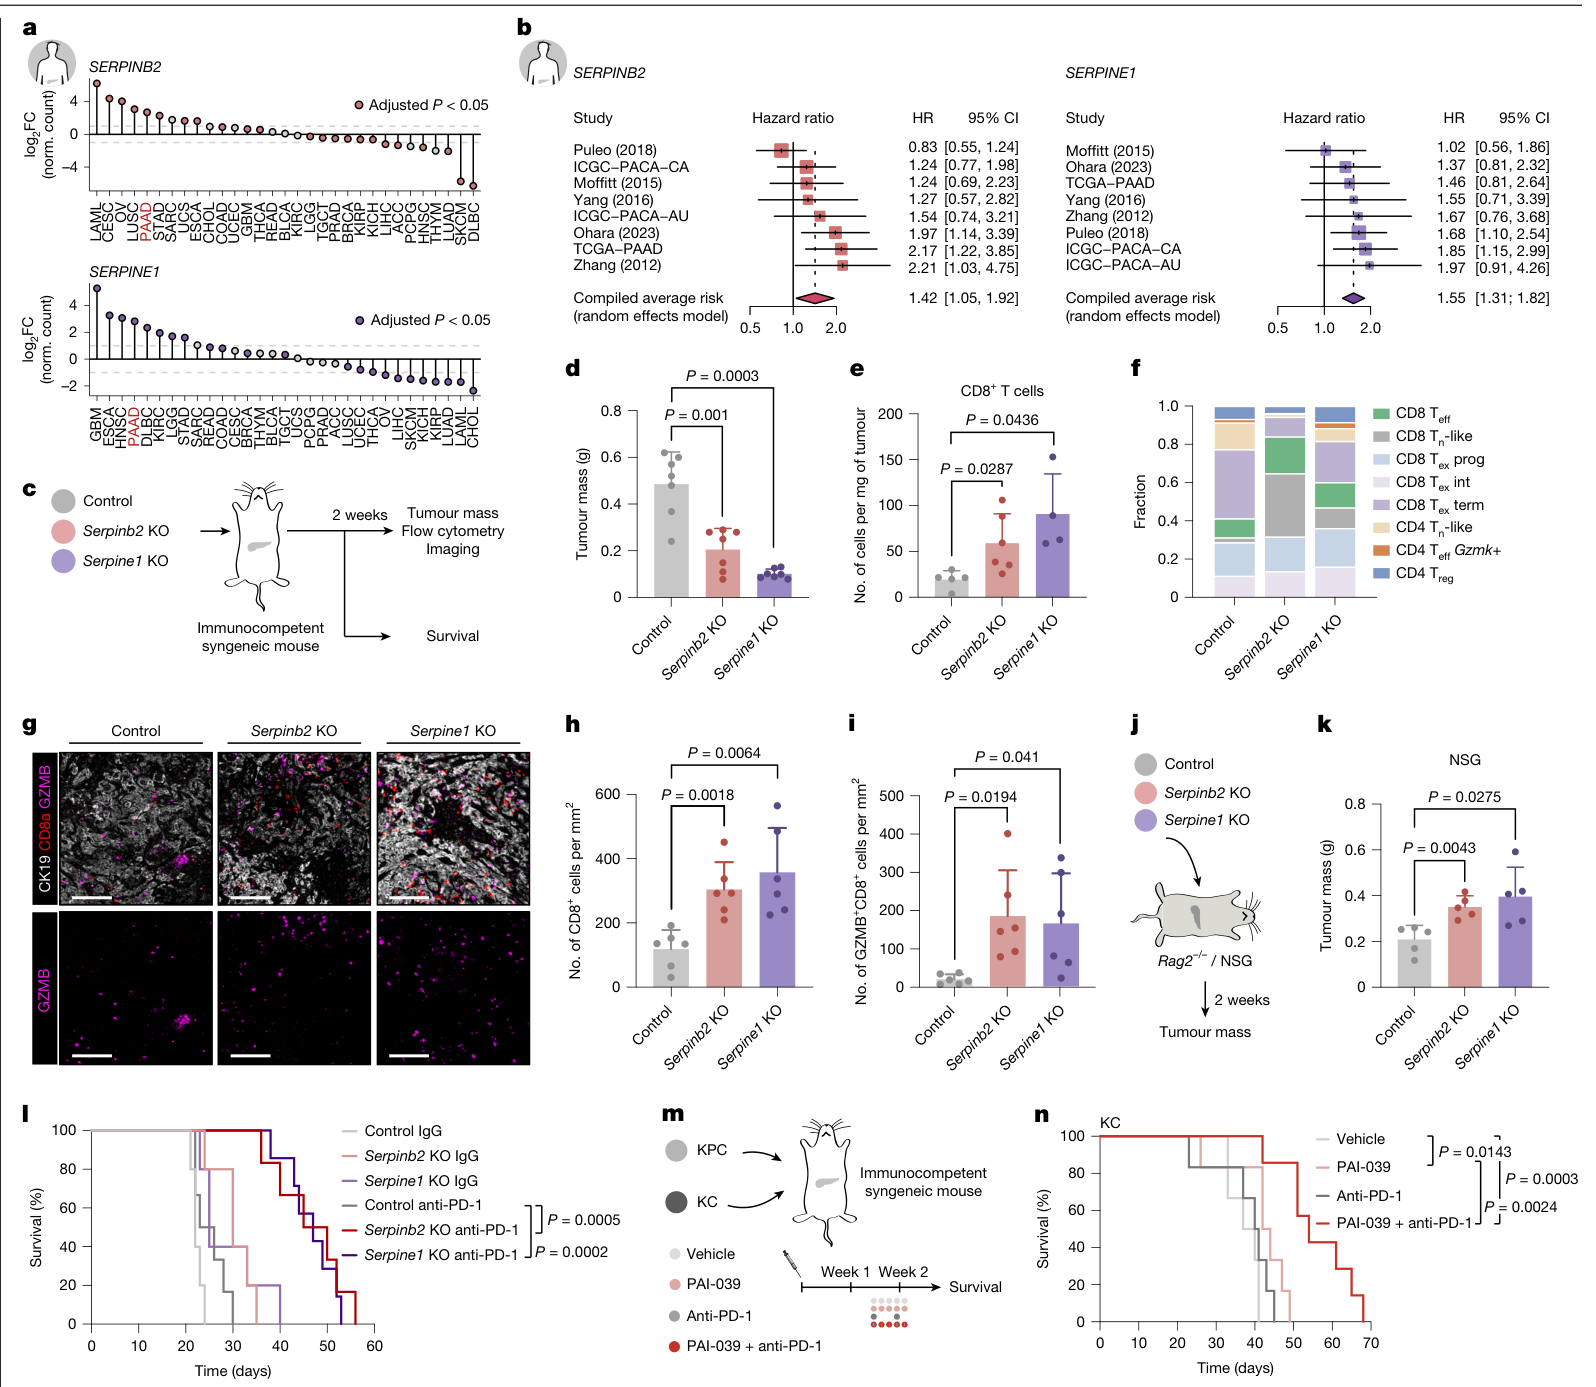
单独破坏Serpinb2或Serpine1,在体外未见明显增殖变化。在免疫完整小鼠中,两种敲除均降低肿瘤质量,组均值下降超过50%(每组7只),同时增加瘤内CD8 T细胞及GZMB阳性效应细胞。
单细胞分析中,终末耗竭T细胞所占比例下降,效应相关程序增强;这些比例变化与组织中细胞数量的测量分别保留。在Rag2缺陷及NSG小鼠中,敲除群体反而生长更快,显示这条通路的净效应随免疫环境改变。
人类数据提供预后联系:8个PDAC队列、1,176位患者的分析中,高表达SERPINB2与SERPINE1均与较差总生存相关,合并HR分别为1.42(95% CI 1.05–1.92)及1.55(1.31–1.82)。这里比较的是表达与预后的关联。
基因敲除与抗PD-1联合,在KPC模型中延长小鼠生存(各组5–7只)。PAI-1抑制剂PAI-039与抗PD-1联合,也在KC模型中延长生存,KPC模型的结果见扩展图。药物实验从移植后第10天开始干预已建立的肿瘤。
Serpin改变基质与巨噬细胞所在的局部环境
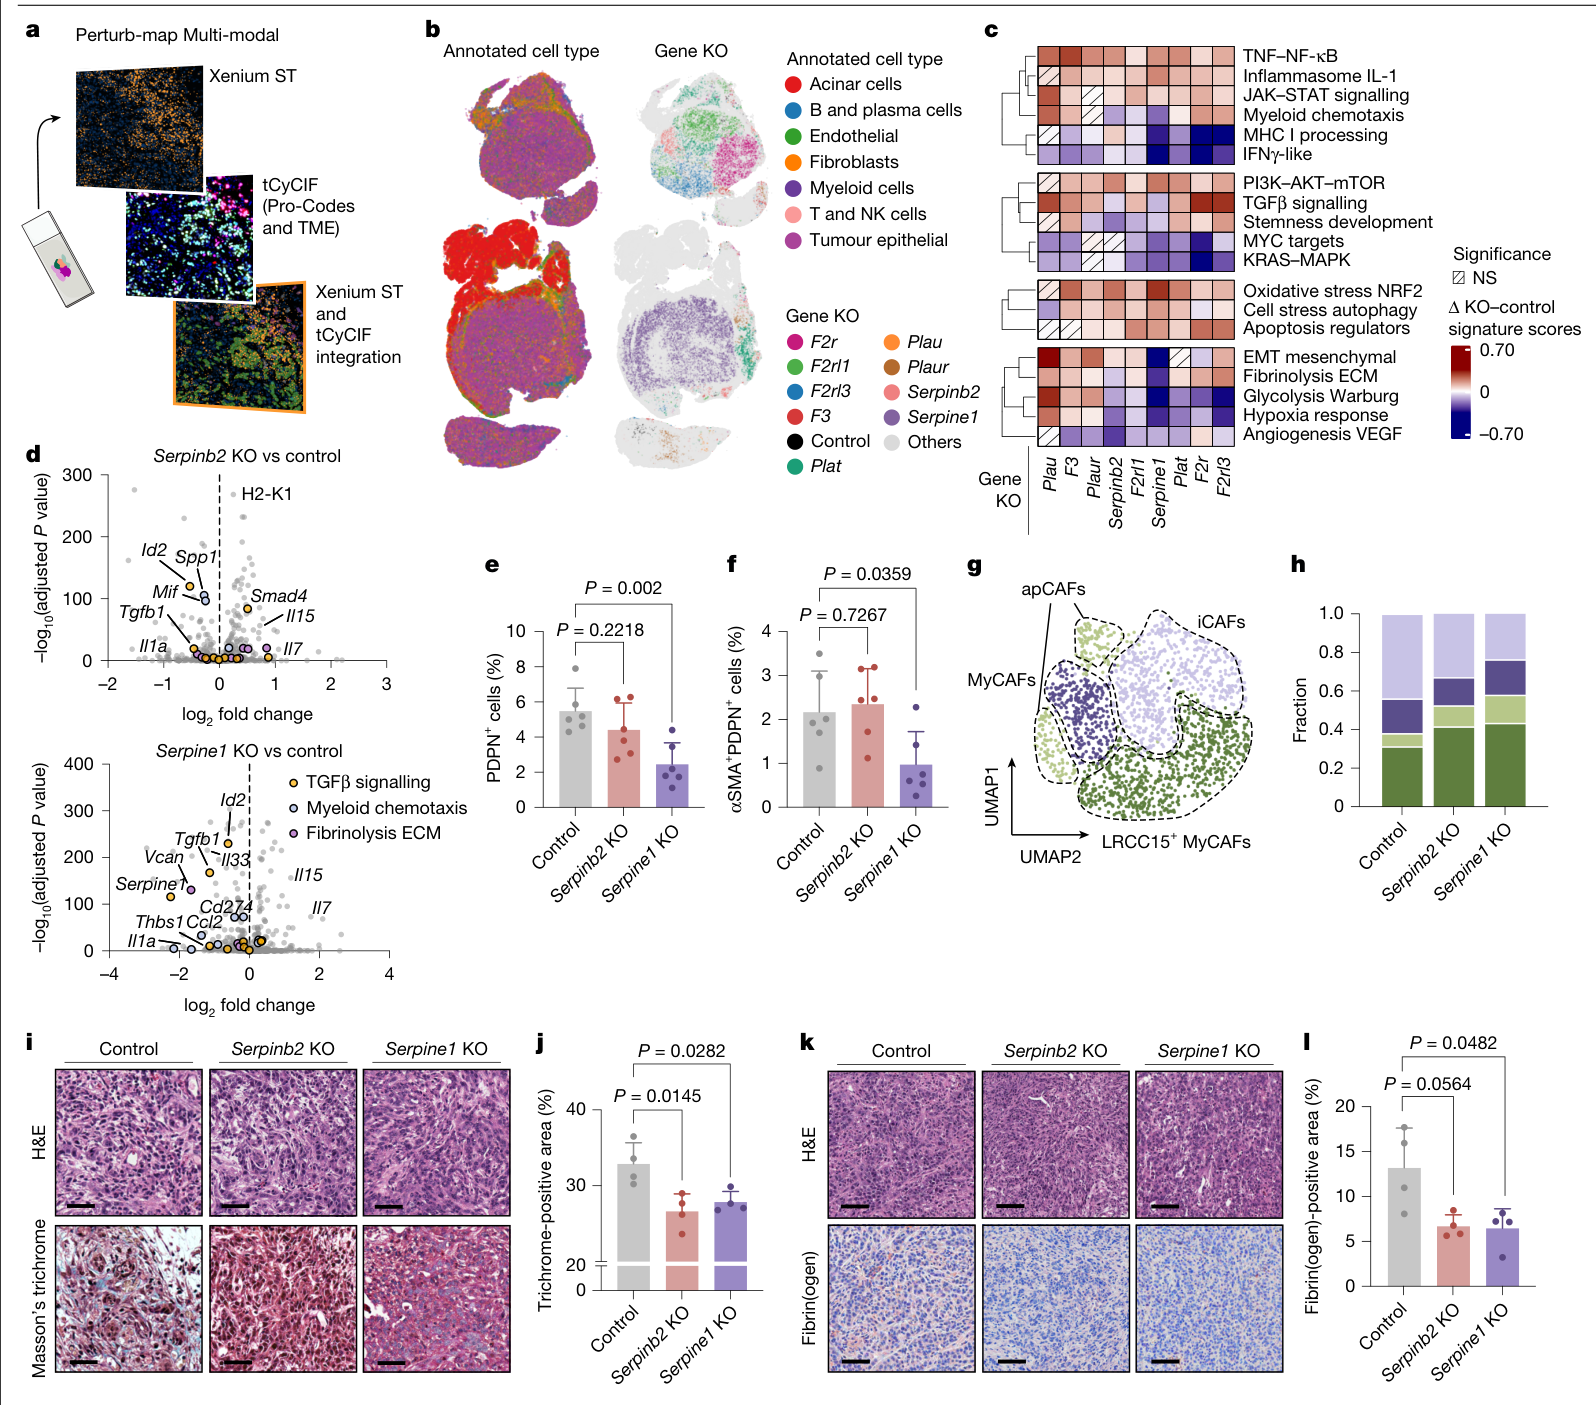
敲除后,肿瘤细胞的Tgfb1表达下降,Il7与Il15升高;两种敲除还呈现各自的趋化和髓系细胞相关变化。这些转录变化与组织中的基质重塑相伴。
两种敲除均减少胶原染色;CAF总量在Serpine1敲除中下降,Serpinb2敲除未达显著。图3l中的纤维蛋白(原)染色两组均呈下降方向,但Serpinb2比较P=0.0564、未达显著,Serpine1比较P=0.0482。该抗体检测纤维蛋白与纤维蛋白原,结果按实际检测名称表达。
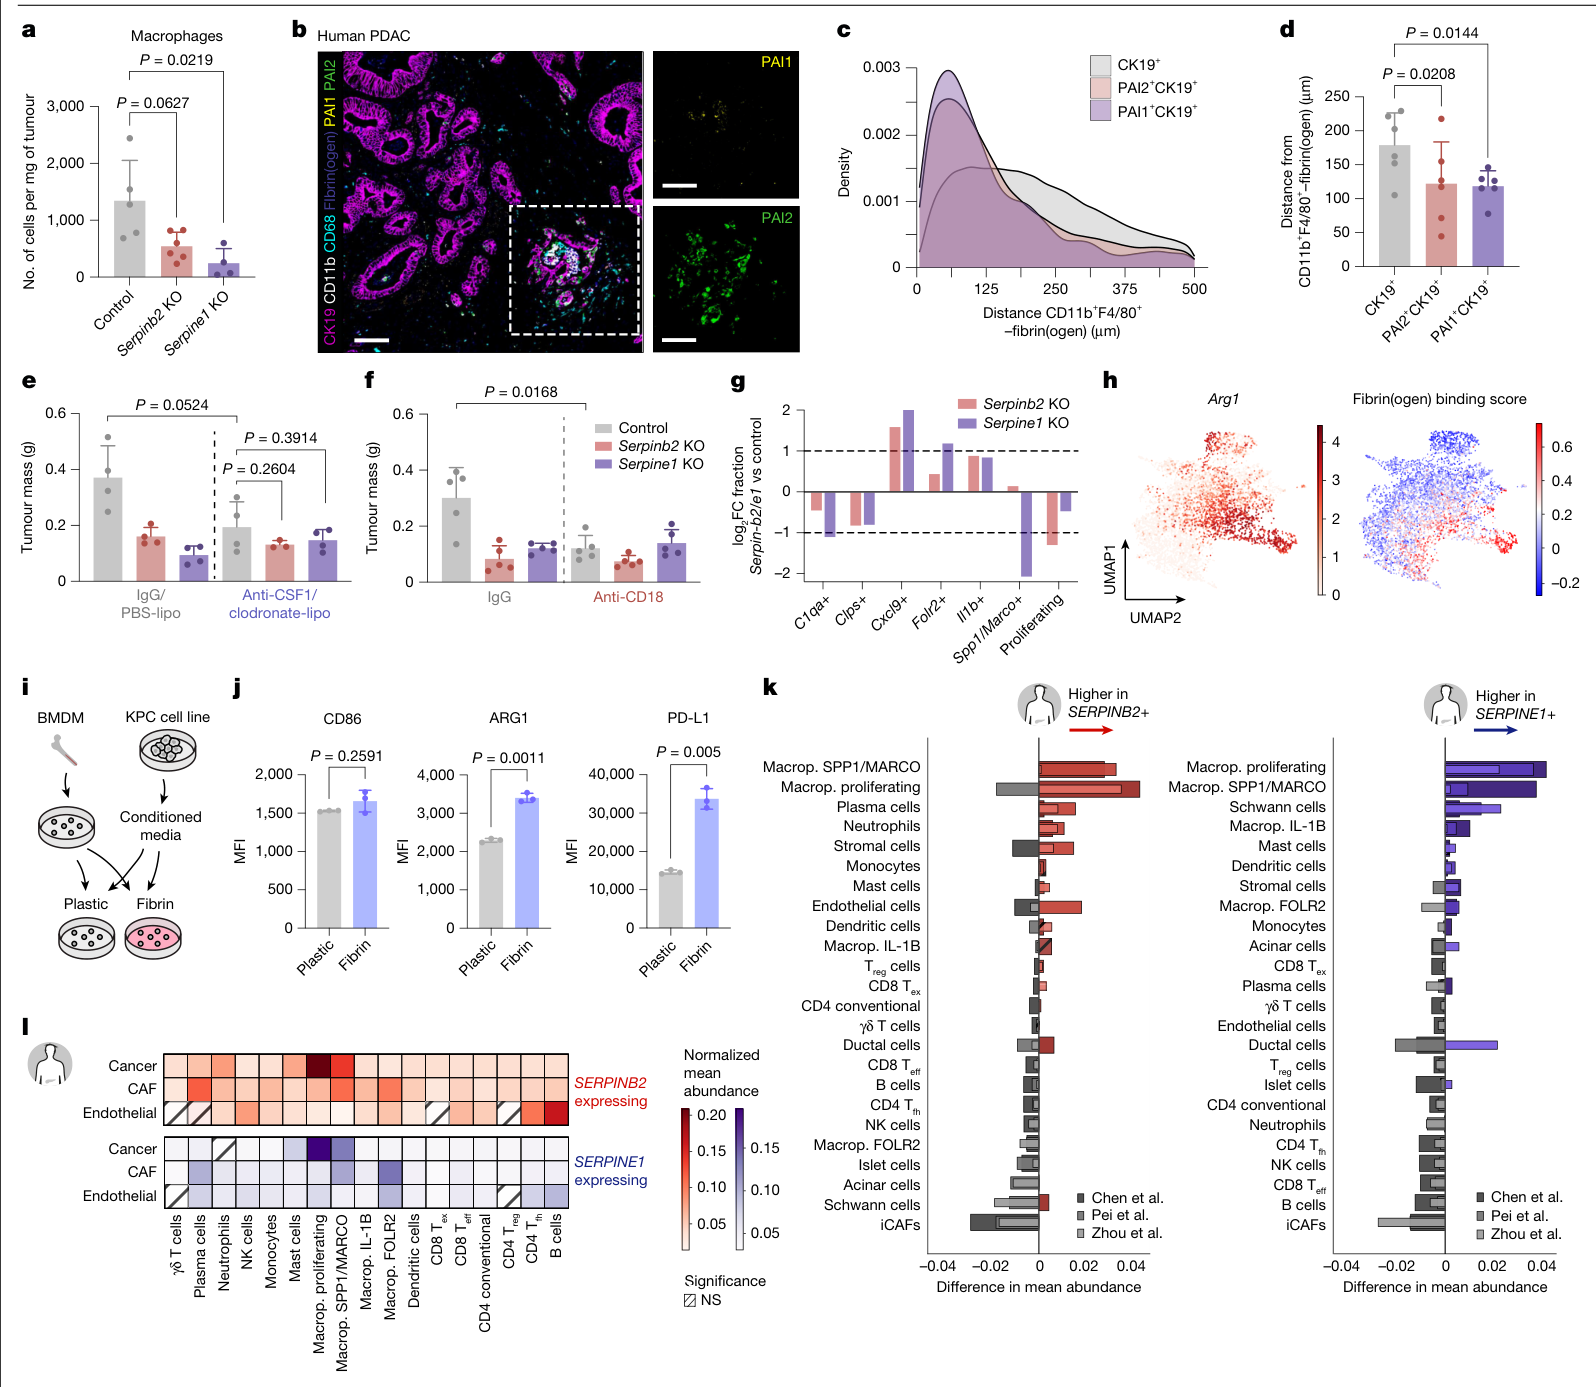
肿瘤相关巨噬细胞的变化也存在差别:图4a中,Serpine1敲除显著减少巨噬细胞,Serpinb2比较P=0.0627、未达显著。组织成像则显示PAI阳性肿瘤细胞、纤维蛋白(原)及巨噬细胞在局部相邻分布。这种空间关系在人类PDAC组织中同样可见;30份组织用于染色核查,另有空间数据集提供验证。
在骨髓来源巨噬细胞实验中,纤维蛋白环境与KPC条件培养基共同促进ARG1、PD-L1表达,CD86未见显著变化。巨噬细胞清除后,对照肿瘤质量均值下降,但图4e比较P=0.0524、未达显著;阻断CD18减少局部巨噬细胞与肿瘤负担,并与PD-1阻断出现组合效果。CD18在多类白细胞中表达,这些实验的作用范围包含相应细胞群。
少数生产者影响邻近的非生产者
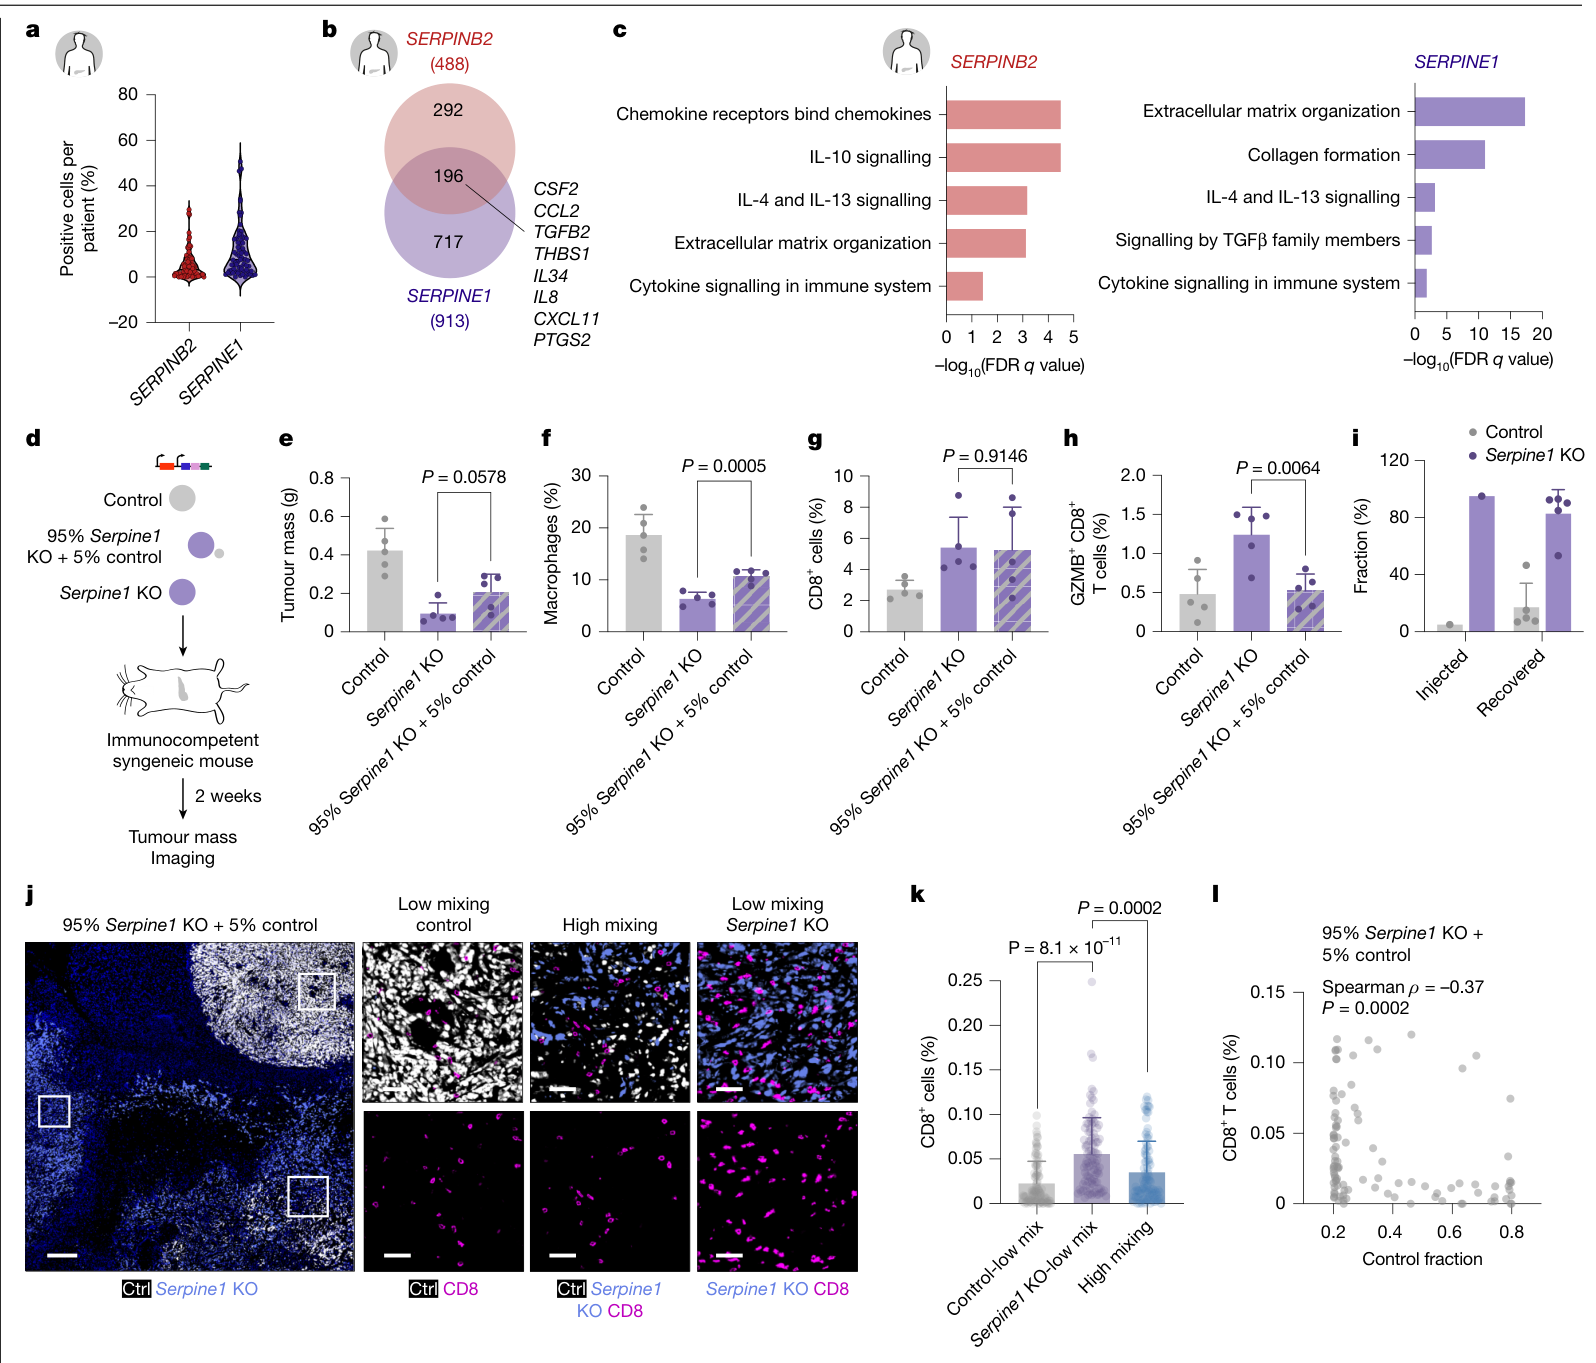
5个人类单细胞队列、71位患者的分析显示,SERPINB2与SERPINE1主要由部分肿瘤细胞表达,并富集于基底样状态。两种表达群体并不完全重合,因此整体平均表达会压缩细胞间差异。
作者将95%的Serpine1敲除细胞与5%的对照细胞混合移植(每组5只小鼠)。两周后,对照群体增至约17%。混合肿瘤的生长量介于纯对照与纯敲除之间,与纯敲除相比P=0.0578、未达显著;巨噬细胞显著增加,总CD8细胞数量未见显著变化,而GZMB阳性的CD8细胞减少。
在混合肿瘤内部,对照细胞富集区域的CD8细胞较少。这个局部结果与全肿瘤CD8总量的比较对应不同层级。视野嵌套于5只小鼠,区域数量用于空间测量。
进一步理解
本文的关键联系是:肿瘤异质性不仅改变单个细胞的性质,还能改变邻居所处的环境。少数细胞生产的胞外因子,通过基质与髓系细胞参与建立局部保护,使同一区域中的其他细胞共同受到影响。
由此可以提出一个后续分层问题:哪些特征最能识别依赖这类生态位的肿瘤——平均serpin表达、阳性细胞比例、空间聚集,还是与纤维蛋白(原)和巨噬细胞的共同分布?研究中的空间证据提示,这些指标需要分别比较其增量价值。是否能够用阻断环境组织者的方式覆盖多个肿瘤细胞状态,仍需在不同模型与患者材料中测试。
局限与待解问题
功能证据主要来自小鼠原位移植与体外系统。人类材料支持表达、预后及空间联系;文中JAVELIN治疗关联来自肾癌的avelumab与axitinib队列,PDAC中的疗效分层价值尚需临床验证。
研究未直接测量局部纤溶活性,也未完整区分肿瘤细胞与基质、免疫细胞来源的serpin贡献。筛选限于预选胞外相关候选;后续需要扩大扰动范围并测试已形成的人类肿瘤生态位。
部分纤维蛋白(原)、巨噬细胞及混合肿瘤生长的比较未达显著,分别保留在对应结果旁。混合实验中生产者比例随时间增长,局部作用的阈值、距离和持续时间还未确定。药物从成瘤后开始,而巨噬细胞清除与CD18阻断包含移植前干预,治疗时点的效果需要分开评价。
原图、扩展图和已取得的补充科研图均已归档;长基因清单、序列表及细胞级原始数据未逐项重算。
原文:A serpin–myeloid axis in pancreatic cancer heterogeneity and immune evasion
主图与表格 · 5 张
图1 · PDF 第 3 页
Fig. 1 | Perturb-map identifies tumour-derived extracellular factors controlling PDAC growth and TME architecture. a, Schematic of the Perturb- map approach. KPC cells were transduced with a PC/CRISPR library, enabling spatially resolved analysis of clonal fitness and tumour–microenvironment interactions in vivo. gRNA, guide RNA. b, Representative images and digital reconstructions of orthotopic KPC tumours at days 7, 14 and 21 after transplantation. Colours indicate gene knockouts (35 Pro-Codes, 7 epitope tags (E)). Tumours from n = 5 (day 7), n = 7 (day 14) and n = 8 (day 21) mice were analysed; two images acquired per mouse. Individual mice represent biological replicates. Scale bars, 250 μm. c, Representative spatial heterogeneity maps of tumours at days 7 and 21. Colours indicate the percentage of non-matching neighbouring tumour cells (yellow, higher heterogeneity; black, lower heterogeneity). White boxes denote focal regions identified by mean-shift clustering. d, Representative Pro-Code (PC) composition in focal regions shown in c. Each colour represents a distinct knockout population. Quantification is shown in Extended Data Fig. 4c. e, log2-transformed fold change of normalized (norm.) fitness scores (in vivo/in vitro) relative to the F8-knockout (KO) control. Hatched cells indicate adjusted P > 0.05. Two-sided Mann–Whitney tests with false discovery rate (FDR) correction for multiple comparisons. NS, not significant. f, Neighbourhood enrichment analysis of immune cells within 25 μm of knockout tumour cells at days 7, 14 and 21. Heat map colours indicate interaction significance relative to a permuted null distribution. Red and blue annotation (left) indicates relative fitness enrichment and depletion, respectively, compared with control. g, Experimental design for analysis in Rag2−/− mice. KPCPC/CRISPR cells were orthotopically transplanted and tumours were collected 14 days later. One section from n = 8 mice was analysed. h, Abundance of knockout populations across Rag2−/− tumours. Colours below the axis show relative depletion or enrichment in immunocompetent mice at day 14. Serpinb2 and Serpine1 are highlighted in red. Statistical evaluation is shown in Extended Data Fig. 4f. Histology slides in a,g adapted from Servier Medical Art, microbiology and cell culture image kit, histology slide illustration, CC BY 4.0 (https://smart.servier. com/); mouse outlines in a,g adapted from ref. 47 (copyright © 2026 MyJoVE Corporation).
图2 · PDF 第 5 页
Fig. 2 | Loss of Serpinb2 and Serpine1 promotes T cell-mediated anti- tumour immunity. a, Differential expression of SERPINB2 (top) and SERPINE1 (bottom) in human tumours versus normal tissues across cancers. Pancreatic adenocarcinoma cohorts are labelled in red; non-significant comparisons are represented in grey. TCGA and GTEx data. ACC, adrenocortical carcinoma; BLCA, bladder urothelial carcinoma; BRCA, breast invasive carcinoma; CESC, cervical squamous cell carcinoma and endocervical adenocarcinoma; CHOL, cholangiocarcinoma; COAD, colon adenocarcinoma; DLBC, diffuse large B cell lymphoma; ESCA, oesophageal carcinoma; FC, fold change; GBM, glioblastoma multiforme; HNSC, head and neck squamous cell carcinoma; KICH, kidney chromophobe; KIRC, kidney renal clear cell carcinoma; KIRP, kidney renal papillary cell carcinoma; LAML, acute myeloid leukaemia; LGG, low-grade glioma; LIHC, liver hepatocellular carcinoma; LUAD, lung adenocarcinoma; LUSC, lung squamous cell carcinoma; OV, ovarian serous cystadenocarcinoma; PAAD, pancreatic adenocarcinoma; PCPG, pheochromocytoma and paraganglioma; PRAD, prostate adenocarcinoma; READ, rectum adenocarcinoma; SARC, sarcoma; SKCM, skin cutaneous melanoma; STAD, stomach adenocarcinoma; TGCT, testicular germ cell tumour; THCA, thyroid carcinoma; THYM, thymoma; UCEC, uterine corpus endometrial carcinoma; UCS, uterine carcinosarcoma. b, Meta-analysis of SERPINB2 (left) or SERPINE1 (right) expression and overall survival (data from refs. 48–52). Squares indicate hazard ratios (HRs; size proportional to sample size), lines represent 95% confidence intervals (CIs) and diamonds show pooled random-effects estimates (n = 1,176 patients from 8 PDAC cohorts). c, Experimental design for in vivo validation of Serpinb2 and Serpine1 knockout. Control cells carried an F8-targeting single guide RNA (sgRNA). d, Tumour mass of control, Serpinb2-KO, and Serpine1-KO orthotopic tumours (n = 7 mice per group). e, Intratumoural CD8+ T cells quantified by flow cytometry (control n = 5, Serpinb2-KO n = 6, Serpine1-KO n = 4). f, Relative abundance of T cell subsets identified by scRNA-seq of control, Serpinb2-KO and Serpine1-KO tumours. Teff, effector T cells; Tex, exhausted T cells; Tn, naive T cells; Treg, regulatory T cells. g, Representative pseudocoloured immunohistochemistry of control, Serpinb2-KO and Serpine1-KO tumours stained for CK19, CD8a and GZMB. Scale bars, 125 µm. h,i, Quantification of CD8+ (h) and GZMB+CD8+ (i) cells in tumours from g (n = 6 mice per group). j, Experimental design for analysis of serpin-knockout tumours in Rag2−/− and NSG mice. k, Tumour mass of control, Serpinb2-KO and Serpine1-KO tumours from NSG mice (n = 5 mice per group). l, Kaplan–Meier survival of mice bearing control, Serpinb2-KO or Serpine1-KO tumours treated with IgG (n = 5 per group) or anti-PD-1 (control n = 6, Serpinb2-KO n = 6, Serpine1-KO n = 7). m, Experimental design for evaluation of PAI-039 and anti-PD-1 combination therapy. n, Kaplan–Meier survival analysis of mice bearing KC tumours treated with vehicle (n = 6), PAI-039 (n = 6), anti-PD-1 (n = 6) or PAI-039 plus anti-PD-1 (n = 7). d,e,h,i,k, Two-sided unpaired Welch’s t-tests. Dots represent individual mice; bars show mean and s.d. l,n, Two-sided log-rank (Mantel–Cox) tests. Human body outlines in a,b adapted from Servier Medical Art, people image kit, human body outline illustration, CC BY 4.0 (https://smart.servier. com/); mouse outlines in c,j,m adapted from ref. 47 (copyright © 2026 MyJoVE Corporation).
图3 · PDF 第 6 页
PAI1 and PAI2 inhibit plasmin generation and thereby prevent fibrin degradation. Consistent with this role, fibrin(ogen)-dense regions were readily detected in orthotopic PDAC tumours (Fig. 3k). Both Serpinb2-KO and Serpine1-KO tumours showed reduced fibrin(ogen) deposition, indicating that each gene independently promotes fibrin accumulation in PDAC (Fig. 3k,l). These data indicate that cancer-produced Serpine1 and Serpinb2 remodel the ECM by promoting collagen and fibrin deposition. Fig. 3 | Serpinb2 and Serpine1 loss alters tumour transcriptional programmes and ECM deposition. a, Schematic overview of the Perturb-Map Multi-modal workflow. Histology slide adapted from Servier Medical Art, microbiology and cell culture image kit, histology slide illustration, CC BY 4.0 (https://smart. servier.com/). b, Representative tumour region of KPCPC/CRISPR tumours analysed by Xenium ST and tissue-based cyclic immunofluorescence (t-CyCIF). Left, Xenium-derived cell-type annotations; right, Pro-Code-defined tumour cell knockouts. c, Heat map of pathway activity derived from per-cell signature scores in tumour cells assigned to knockouts. Control-knockout (F8-KO) differences are shown as pathway activity scores (red, higher in knockout; blue, lower in knockout). Significance was defined at q < 0.01 after Benjamini– Hochberg correction. EMT, epithelial–mesenchymal transition; MHC I, major histocompatibility complex class I. d, Volcano plots showing differential gene expression in tumour epithelial cells from Serpinb2-KO (top) and Serpine1-KO (bottom) tumours compared with control (F8-KO). Differential expression was assessed using a two-sided Wilcoxon rank-sum test with Benjamini–Hochberg correction for multiple testing. Genes were considered significant at adjusted P ≤ 0.05 and are coloured by pathway membership as shown in c. e,f, Imaging- based quantification of PDPN+ (e) and αSMA+PDPN+ (f) cells, expressed as percentage per tumour (control n = 6, Serpinb2-KO n = 6, Serpine1-KO n = 6). Representative images are shown in Extended Data Fig. 7a. g,h, scRNA-seq analysis of stromal compartments showing CAF clusters (g) and relative abundance of CAF subsets (h). apCAFs, antigen-presenting CAFs; iCAFs, inflammatory CAFs; myCAFs, myofibroblastic CAFs; UMAP, uniform manifold approximation and projection. i, Representative haematoxylin and eosin (H&E) and Masson’s trichrome staining of control, Serpinb2-KO and Serpine1-KO tumours. Scale bars, 50 µm. j, Quantification of trichrome-positive collagen area (control n = 4, Serpinb2-KO n = 4, Serpine1-KO n = 4). k, Representative H&E and fibrin(ogen) immunohistochemistry of control, Serpinb2-KO, and Serpine1- KO tumours. Scale bars, 50 µm. l, Quantification of fibrin(ogen)-positive area in tumours isolated from control (n = 4), Serpinb2-KO (n = 4) and Serpine1-KO (n = 4). e,f,j,l Two-tailed, unpaired Welch’s t-test. Dots represent individual mice; bars indicate mean + s.d.
图4 · PDF 第 8 页
Supplementary Table 2). Although SERPINB2+ and SERPINE1+ tumour cells also exhibited unique transcriptional signatures, both states con- verged on pathways linked to ECM remodelling and immune signalling, processes associated with immunosuppression in cancer (Fig. 5c). These programmes mirrored the pathway alterations observed in KPC cancer cells upon Serpinb2 and Serpine1 deletion in our spatial tran- scriptomics analysis of mouse PDAC, including TGFβ signalling, ECM remodelling and myeloid chemotactic pathways (Fig. 3c), supporting Fig. 4 | Serpinb2 and Serpine1 promote fibrin-dependent macrophage retention and immunosuppressive polarization. a, Intratumoural macrophages quantified by flow cytometry in control, Serpinb2-KO, and Serpine1-KO tumours. Same cohort as Fig. 2e (control n = 5, Serpinb2-KO n = 6, Serpine1-KO n = 4). b, Representative human PDAC section stained for CK19, CD11b, CD68, fibrin(ogen), PAI1 and PAI2. Cohort details in Extended Data Fig. 8d. Scale bars, 100 μm (main image) and 50 μm (enlarged view (right)). c,d, Spatial proximity of fibrin(ogen)-colocalized CD11b+F4/80+ cells to CK19+, PAI1+CK19+ or PAI2+CK19+ tumour cells. Quantification in d used control tumours (n = 6). e, Tumour mass following macrophage depletion (IgG control n = 4, IgG Serpinb2-KO n = 4, IgG Serpine1-KO n = 4, anti-CSF1 plus clodronate control n = 4, anti-CSF1 plus clodronate Serpinb2-KO n = 3, anti-CSF1 plus clodronate Serpine1- KO n = 4). Lipo, liposomes. f, Tumour mass after IgG or anti-CD18 treatment in mice bearing control, Serpinb2-KO or Serpine1-KO tumours (n = 5 per group or treatment group). g, Abundance of macrophage subsets determined by scRNA-seq in Serpinb2-KO and Serpine1-KO tumours versus control. h, UMAP of Arg1 expression (left) and fibrin(ogen) binding score (right) in macrophages. i, Schematic of BMDM fibrin culture assay. j, Mean fluorescence intensity (MFI) of CD86, ARG1 and PD-L1 in BMDMs cultured on plastic or fibrin-coated surfaces. Representative of three independent experiments. k, Cell-type enrichment analysis comparing the local microenvironment surrounding SERPINB2+ versus SERPINB2− (left) and SERPINE1+ versus SERPINE1− tumour regions (right). Effect sizes for three human PDAC datasets10,33,34. Macrop., macrophage. l, Enrichment of immune and stromal populations in proximity to SERPINB2+ and SERPINE1+ regions in three human PDAC datasets10,33,34. Two-sided Mann–Whitney U tests with Benjamini–Hochberg FDR correction. a,e,f,j, Two-sided unpaired Welch’s t-tests; dots represent individual mice (a,e,f) or technical replicates (j). d, Two-sided paired t-test. Bars show mean + s.d. Control denotes F8-targeting sgRNA cells unless indicated. Petri dish in i adapted from Servier Medical Art, microbiology and cell culture image kit, Petri dish illustration elements, CC BY 4.0 (https://smart.servier.com/); human body outlines in k,l adapted from Servier Medical Art, people image kit, human body outline illustration, CC BY 4.0 (https://smart.servier.com/).
图5 · PDF 第 9 页
conservation of a serpin-associated epithelial programme linked to immune modulation in PDAC. Serpin-expressing cells dominate local immunity In human and mouse pancreatic tumours, SERPINB2 and SERPINE1 are expressed by only a subset of malignant cells (Fig. 5a) and are associated with distinct microenvironments compared to non-serpin-expressing cells (Fig. 4k). We therefore asked whether this minority popula- tion is sufficient to drive broader TME remodelling and exert domi- nant, non-cell-autonomous effects. To model the low frequency of serpin-positive tumour cells in patient tumours, we co-transplanted 95% Serpine1-KO KPC cells with 5% serpin-expressing control KPC cells (Fig. 5d). Introduction of this small population led to preferential Fig. 5 | Rare SERPINB2- and SERPINE1-expressing tumour cells define immunosuppressive dominant programmes. a, Fraction of SERPINE1+ and SERPINB2+ tumour cells per patient across five human PDAC scRNA-seq datasets10,14,16,34,35. Only patients with more than 100 tumour cells were included (n = 71). b, Venn diagram showing the overlapping upregulated genes in SERPINB2+ and SERPINE1+ tumour cells (log2FC ≥ 1; adjusted P value ≤ 0.05). c, Pathway enrichment analysis of SERPINB2+ and SERPINE1+ malignant epithelial cells across the integrated human PDAC scRNA-seq dataset. Selected enriched pathways are shown. Complete results are reported in Supplementary Table 2. d, Schematic of the clonal mixing experiment. Serpine1-KO and control cells were mixed at a 95:5 ratio and orthotopically transplanted into immunocompetent mice. Adapted from ref. 47 (copyright © 2026 MyJoVE Corporation). e, Tumour mass of control, Serpine1-KO, and mixed tumours (95% Serpine1-KO:5% control; n = 5 per condition). f–h, Imaging-based quantification of intratumoural macrophages (f), CD8+ T cells (g) and GZMB+CD8+ T cells (h). Five mice were analysed per condition. i, Fraction of knockout and control tumour cells at injection and end-point in Serpine1-KO mixing experiments. Injected fractions represent the input cell composition. End-point (recovered) fractions are shown as mean + s.d. (n = 5 mice). j, Representative multiplex immunofluorescence images from tumours generated by mixing 95% Serpine1-KO and 5% serpin-expressing cells. Scale bars, 250 μm (main image) and 50 μm (enlarged view (right)). k, CD8+ T cell fractions across low-mixing control-majority, low-mixing Serpine1-KO-majority, and high-mixing regions of interest (ROIs). Up to 20 spatially distributed ROIs per category were sampled from each of 5 independent tumours. ROIs from five mice are shown. l, ROI-level relationship between control tumour cell fraction and CD8+ T cell abundance in Serpine1 mixing experiments; each dot represents one ROI. e–h,k Two-tailed, unpaired Welch’s t-test. Bars indicate mean + s.d. Human body outline in a–c adapted from Servier Medical Art, people image kit, human body outline illustration, CC BY 4.0 (https://smart.servier.com/).
完整阅读记录与证据表
文献分析
文献信息与范围
- 标题:A serpin–myeloid axis in pancreatic cancer heterogeneity and immune evasion
- 期刊:Nature,2026-09-09在线发表;DOI 10.1038/s41586-026-11002-8
- 登记:2026-10-13;晨会2026-10-16;来源morning-report
- 状态:processing_status=partial;human_review=pending
- 材料:42页来稿、3页补充科研图、7页报告摘要、5补表原件、4主图Source Data工作簿。科学正文、方法、5主图/10扩展图及补充科研图已读,长清单与细胞数据未逐项验证。实际范围见coverage.md。
研究设计
用Perturb-map将CRISPR扰动与蛋白条码结合,空间解析肿瘤细胞基因型、克隆适应度与邻近免疫细胞。34个候选加F8对照为35种群体;候选依赖性参考46株人类PDAC细胞系。KPC原位移植后7/14/21天分别5/7/8只小鼠、超过450万个细胞;各时间点不同动物,生物学重复是小鼠。
单独Serpinb2/Serpine1敲除检验免疫背景、基质和巨噬细胞;药物、抗PD-1、巨噬细胞清除及CD18阻断作进一步功能测试。人类部分包括预后表达队列、单细胞/空间资料及30份存档组织;混合移植检验非细胞自主的局部效应。
主要证据
| 环节 | 结果及条件 | 位置 |
|---|---|---|
| 空间筛选 | 早期免疫邻域随扰动改变,21天11群体富集、12减少;Rag2背景中serpin依赖改变 | 图1,第2–3页,扩展图4 |
| 独立敲除 | 体外增殖NS;免疫完整鼠质量均值下降>50%,每组7;CD8与GZMB效应增强 | 图2c–i,第4–5页 |
| 免疫依赖 | Rag2及NSG中敲除群体生长更快,净生长效应随免疫背景改变 | 图2j–k,扩展图5,第4–5页 |
| 人类预后 | 8队列1,176患者;SERPINB2 HR1.42(1.05–1.92)、SERPINE1 HR1.55(1.31–1.82);表达极端四分位、单变量随机效应荟萃 | 图2b,第4–5页,方法17页 |
| 联合抗PD-1 | 敲除联合在KPC延长生存,组别5–7;PAI-039联合在KC,另有KPC扩展结果 | 图2l–n,扩展图5l;Source Data图2 |
| 转录与基质 | Tgfb1下降,Il7/Il15升高;胶原两组下降;CAF仅E1显著;纤维蛋白(原)B2 P0.0564、E1 P0.0482 | 图3,第6–7页;Source Data图3 |
| 巨噬细胞 | TAM B2 P0.0627 NS、E1 P0.0219;组织局部相邻,人类组织也见联系 | 图4a–e,第7–8页;Source Data图4 |
| 巨噬细胞状态与功能 | 纤维蛋白+KPC条件培养基上调ARG1/PD-L1,CD86 NS;清除后对照瘤质量均值下降,P0.0524 NS;CD18阻断降低负担 | 图4,扩展图8 |
| 人类状态异质性 | 5单细胞队列71患者;部分细胞表达,两种serpin群体并非完全重合,富集于基底样 | 图5a–c,扩展图9 |
| 少数生产者 | 95%Serpine1-KO+5%F8对照,5只/组,终点对照约17%;生长介于两纯群体,mix对KO P0.0578 NS | 图5d–f,第9–10页;Source Data图5 |
| 混合免疫环境 | TAM增加;全瘤CD8 NS;GZMB+CD8减少;局部对照富集区CD8较少,视野嵌套于小鼠 | 图5g–l,扩展图10;Source Data图5 |
SERPINB2=PAI-2,SERPINE1=PAI-1。纤溶抑制功能为已有背景,本文以肿瘤扰动、空间基质及巨噬细胞干预连接免疫效应,未直接测量局部纤溶活性。两种敲除影响部分重叠且部分不同;未将两者合并为相同效应量。
AI分析
少数细胞产生的胞外因子可改变多个肿瘤细胞共同生活的局部环境,患者分层可能需要同时考虑生产者状态和空间生态位。平均表达、阳性比例、聚集方式以及基质/巨噬细胞共定位值得比较,而不是先设一个未经验证的5%阈值。阻断环境组织者能否覆盖多个细胞状态,是模型证据引出的后续治疗问题。
局限与待解问题
候选筛选及肿瘤细胞敲除不能穷尽基质/免疫细胞来源贡献;局部纤溶、不同serpin的组织来源和空间效应距离仍待直接检验。药物从移植后10天起,巨噬细胞清除/CD18干预包含移植前处理,时序需要分别解释。CD18在多类白细胞表达,其阻断非巨噬细胞专属。
部分基质、TAM及混合生长结果NS;视野/细胞数不等同独立动物数。人类组织没有相应干预数据;JAVELIN的治疗关联为肾癌avelumab+axitinib队列,SERPINE1 PFS相关P0.029、SERPINB2 P0.4,PDAC预测价值仍待验证。长表、细胞级原始数据及代码未重跑,源数据与作者中位生存归纳的差异见coverage.md。
人工核对
待核机制链、免疫背景、非显著结果与空间实验单位;人工pending。现场记录保存在discussion.md。