研究问题
ADC的作用既取决于载荷,也取决于它能否进入肿瘤细胞。靶抗原表达低、分布不均,或抗体结合后内吞不足,都可能限制有效递送。
这篇研究把另一种抗体作为递送伙伴:先给予带反式环辛烯(TCO)的抗体,再给予带四嗪(Tz)的抗体或ADC,两者通过生物正交点击反应形成共价复合物。主要组合为抗EGFR的帕尼单抗与抗HER2的T-DXd或T-DM1,也研究了帕妥珠单抗与HER2靶向ADC的组合。
研究依次检验连接、细胞内转运、动物体内分布和治疗效果。早期成像与内吞实验多使用不带细胞毒载荷的抗体,动物治疗实验再使用ADC。
研究设计
| 证据层次 | 模型与读出 | 主要比较 |
|---|---|---|
| 连接与构型 | 凝胶电泳、质谱、电镜及血清中反应 | 可点击抗体与未连接组合 |
| 细胞内递送 | NCIN87、MIAPaCa-2、MDA-MB-231等;pHrodo活细胞成像、LAMP1共定位 | click与no click;双阴性细胞及IgG对照 |
| 肿瘤分布 | 同鼠携带HER2高表达NCIN87和超低表达A431肿瘤;PET和离体分布 | 单抗、点击组合与不同靶向伙伴 |
| 治疗效果 | 混合乳腺癌、胰腺癌、胃癌及耐药模型 | ADC单药、抗体加ADC、点击连接;多项研究采用单次5 mg/kg给药,前后间隔24小时 |
| 免疫完整模型 | 表达人HER2的CT26小鼠结肠癌模型,BALB/c宿主 | 帕妥珠单抗与T-DXd的连接和未连接组合 |
来源:主PDF第11–15页;补表3–4。免疫完整模型使用经人HER2改造的CT26细胞。
共价连接与细胞内转运
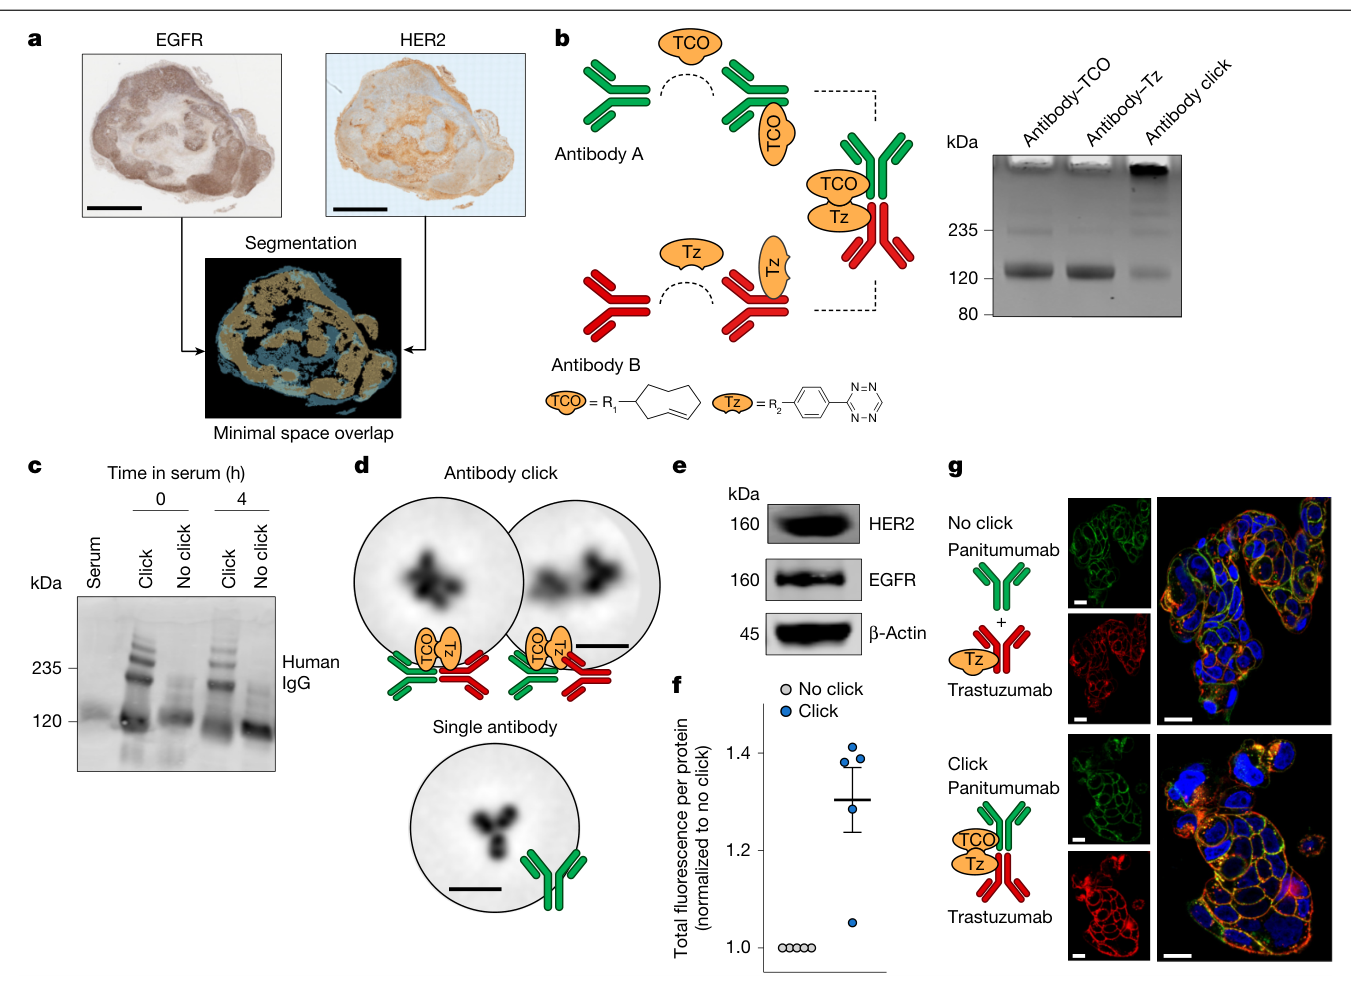
图1首先验证互补基团能够形成较高分子量的抗体复合物。随机修饰体系中,每个抗体带约3–12个点击基团;产物可形成多价复合物。组织染色中,两份混合肿瘤切片的EGFR和HER2高表达区域重叠较少,Dice系数分别为0.12和0.26(图1a、补图2)。
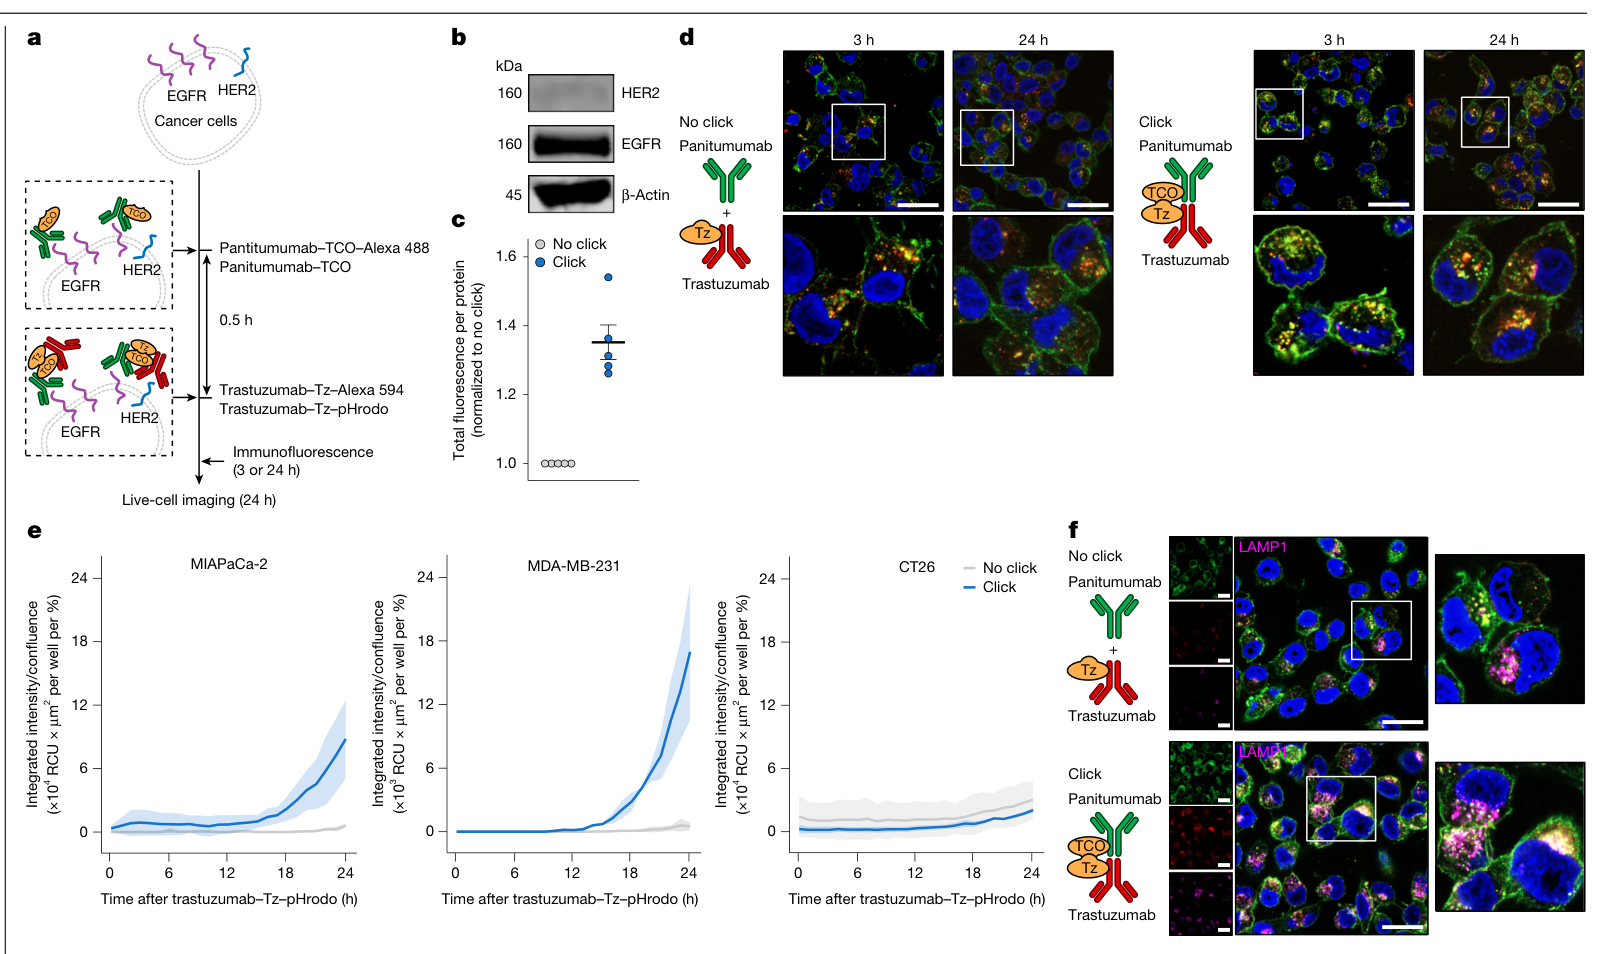
在MIAPaCa-2和MDA-MB-231细胞中,click组合提高了进入酸性胞器后的pHrodo信号,组内比较均P<10⁻⁶;双阴性的CT26对照未见显著变化(P>0.9999,图2e)。这些实验每组3孔,为技术重复。LAMP1共定位进一步支持抗HER2抗体向晚期内体和溶酶体转运(图2f)。
肿瘤分布与治疗响应
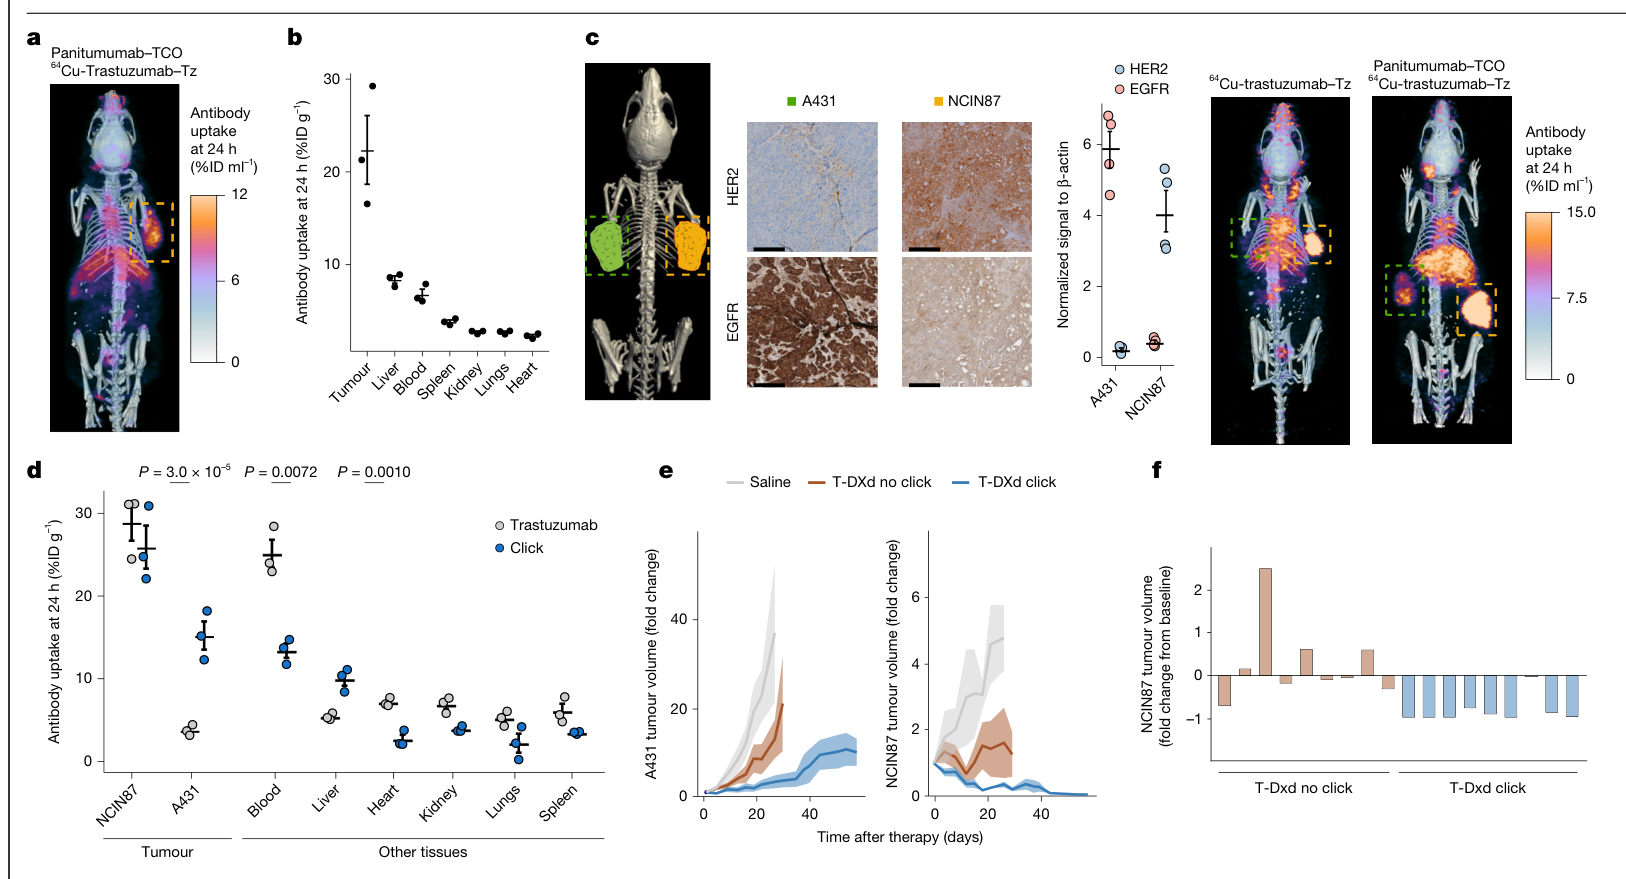
双侧模型把不同受体表达的两种肿瘤放在同一只小鼠中。图3d显示,点击组合在HER2超低表达的A431肿瘤中增加了放射标记抗HER2抗体的积聚;NCIN87本身已有较高的抗体摄取。这里测量的是抗体分布,具体摄取增幅的源文差异列于文末。
治疗实验中,click组的肿瘤生长轨迹更低。图3e的整体组别×时间检验在A431和NCIN87分别为P=0.0138和P=0.00976;同图列出的click对no-click比较分别为P=0.0501和P=0.1269,均未达0.05。该图的生长曲线每组4–5只,图3f的单鼠终点变化另列每组9只,分母分别保留。
低HER2模型和耐药后转用
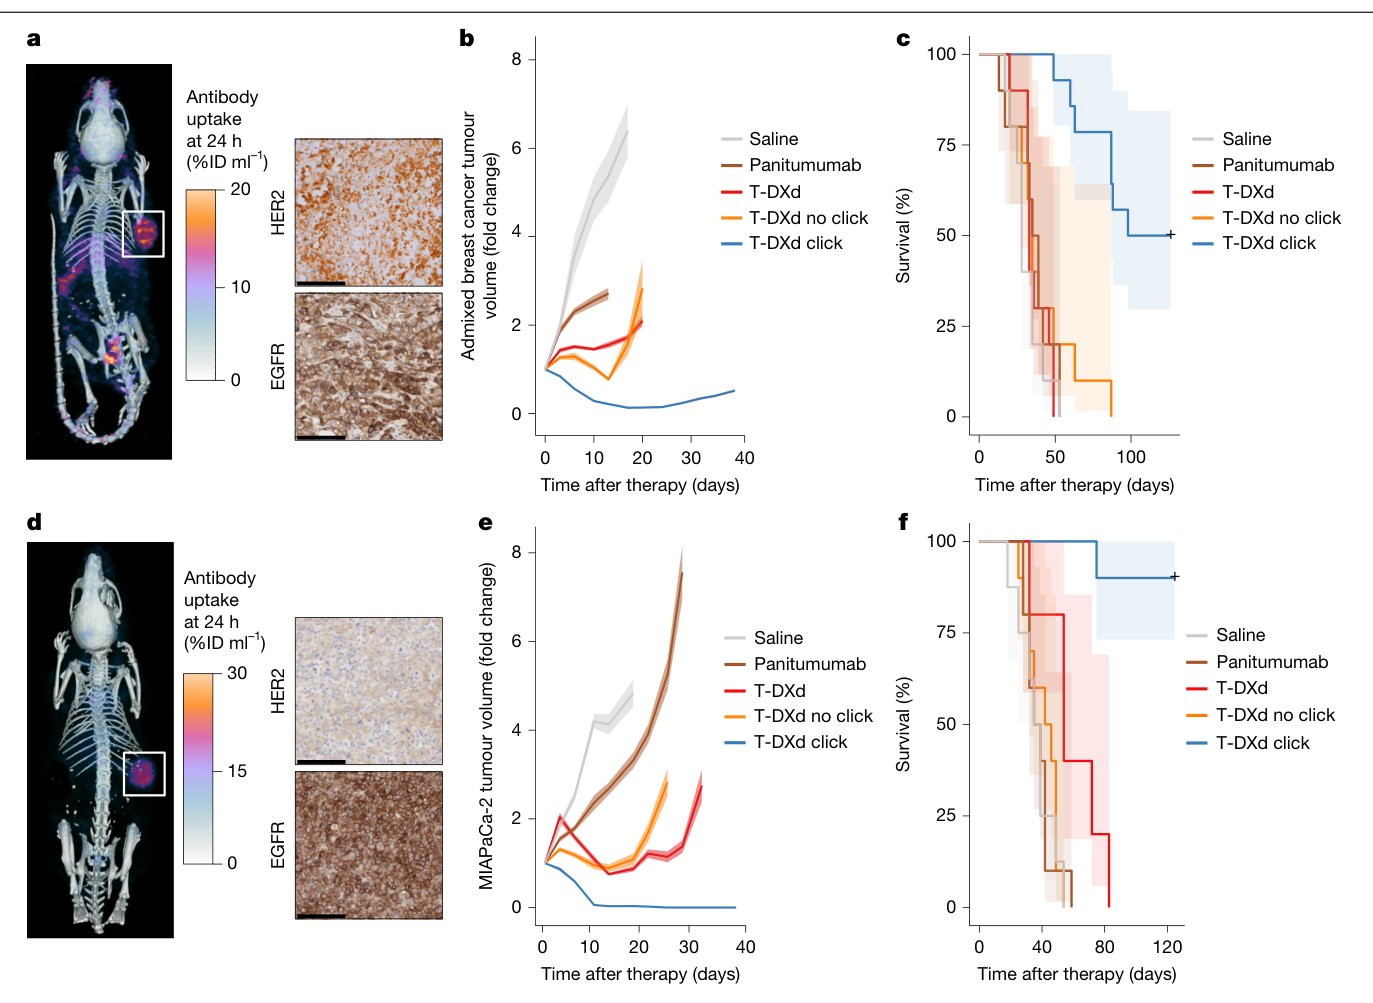
更明确的疗效比较来自混合乳腺癌与MIAPaCa-2胰腺癌模型。混合模型由HER2阳性JIMT1与HER2阴性MDA-MB-231细胞按4∶1植入;胰腺癌模型按作者IHC判定为HER2阴性。两者均在免疫缺陷小鼠中研究。
| T-DXd click对未连接的帕尼单抗加T-DXd | 混合乳腺癌 | MIAPaCa-2胰腺癌 |
|---|---|---|
| 每组动物数 | 10–14只 | 8–10只 |
| 生存比较 | 校正后P=1.20×10⁻⁴ | 校正后P=5.26×10⁻⁵ |
| 观察结果 | 肿瘤控制改善,生存延长 | 肿瘤控制改善,生存延长 |
来源:图4b–f;生存采用log-rank检验并作Bonferroni多重比较校正。生存终点包含方案规定的动物人道终点。
在曲妥珠单抗耐药BT474模型中,10只小鼠先接受T-DXd,6只未应答;这6只转用帕妥珠单抗–TCO加T-DXd–Tz后,5只出现肿瘤回缩(扩展图4d)。转用阶段为同鼠序贯观察,没有同期随机再治疗对照。
另外两项对照检验了化学连接与靶向成分的作用:提前用游离四嗪占据可反应基团后,疗效出现不同程度减弱(补图17);帕尼单抗与非靶向IgG–DM1连接的组合未改善肿瘤生长,整体交互P=0.761(扩展图3d)。这些结果支持连接与所选靶向组合共同参与递送,具体分子贡献仍需拆分。
定点修饰与分布优化
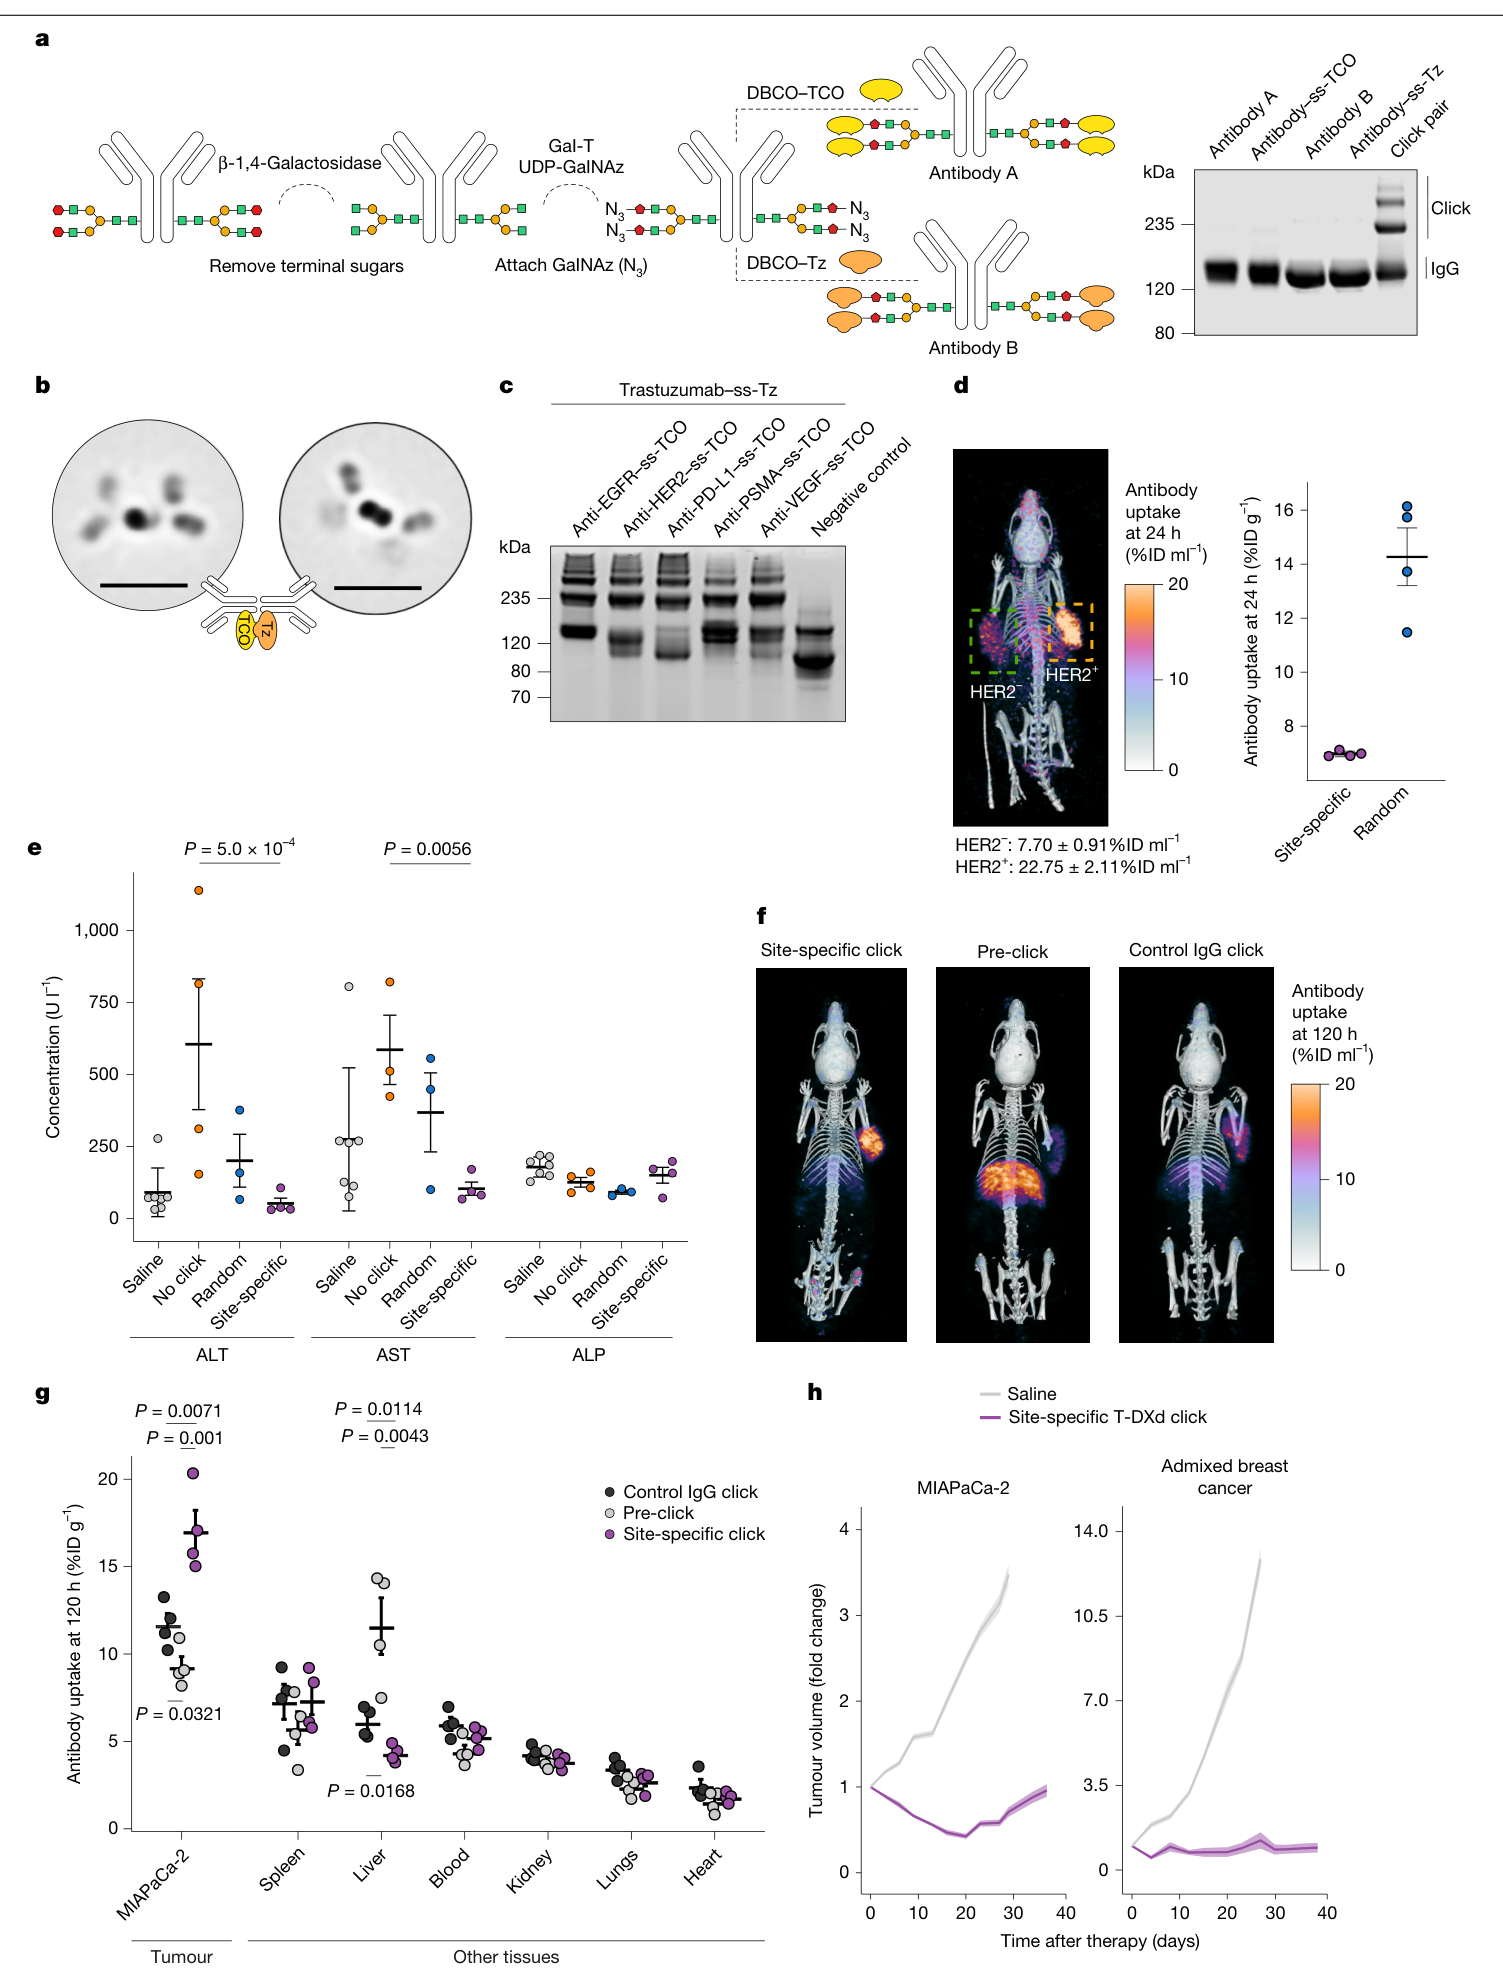
作者随后在抗体Fc糖链上进行定点修饰,把该HER2/EGFR体系的点击基团数控制到约2–4个。相较随机修饰,定点修饰后的肝摄取约降低一半(图5d,每组4只,P=0.0064)。
在MIAPaCa-2模型中,序贯给药的定点点击组合在120小时的PET肿瘤摄取高于预先连接后注射的组合和IgG对照。图5g另以离体组织的%ID/g报告分布,与PET的%ID/mL分别呈现。图5h显示定点修饰组合相对盐水仍有抑瘤活性,该面板的治疗比较限于这两组。
局限与待解问题
体内反应既可能发生在血液循环中,也可能发生在肿瘤部位。受体介导摄取、抗体聚集和药代改变的相对贡献尚未分开测定。PD-L1、PSMA和VEGF抗体的扩展实验主要验证化学修饰与连接,治疗证据仍集中于HER2/EGFR及双HER2体系。
若干定量结果存在源文出入:正文把NCIN87结果概括为100%完全缓解,而图3f公开源表的9个终点值虽均较基线下降,只有4个等于−1;CT26-hHER2完全缓解计数、NCIN87转用治疗的响应计数及图3d对照摄取值,也未在正文、图和源表之间完全对应。相应的完全缓解率与精确摄取增幅仍待澄清,逐项位置保留在完整证据记录中。
安全性资料主要是单次小鼠暴露后的肝酶、体重及组织病理。补表2记录了肺出血、肝细胞变性或坏死等改变,病理医师将其解释为背景或濒死期相关;重复给药、长期风险及DXd相关肺毒性还需进一步研究。研究尚无患者治疗数据。
双抗对照仅涉及一种商业构型的分布实验,与不同设计的双特异ADC之间仍缺系统疗效比较。耐药后转用也是小样本序贯观察;哪些耐药机制最适合这种递送方式,需要在后续分层研究中验证。
进一步理解与文献线索
这项工作的推进在于把“抗原识别”和“载荷递送”组织成可更换伙伴的体内组合。由此提出的后续问题是:HER2表达、另一靶点的空间分布、受体内吞能力与载荷敏感性,能否共同预测增益。这里的分层设想属于基于研究提出的问题。
两篇承接这一问题的原始研究是EGFR-directed antibodies promote HER2 ADC internalization and efficacy与A Biparatopic HER2-Targeting Antibody-Drug Conjugate Induces Tumor Regression in Primary Models Refractory to or Ineligible for HER2-Targeted Therapy。本次仅核对其书目和公开检索摘要片段,未完成全文及附件评审。
原文:Modular in vivo antibody–ADC click to reverse drug resistance in tumours
主图与表格 · 5 张
图1:体内抗体点击连接与初步表征 · PDF 第 2 页
Fig. 1 | Antibody click platform for in vivo ligation of antibody–ADC constructs via bioorthogonal chemistry. a, Co-registered EGFR and HER2 IHC images (top) from the same tumour section and corresponding segmentation masks (bottom) confirm the limited spatial overlap between regions of high protein expression. The DSC value was 0.12. DSC values range from 0 to 1 and quantify how much two regions overlap, with lower values indicating less similarity. Co-registration was repeated two times independently. b, Schematic of the antibody–ADC click strategy. Antibodies are conjugated to TCO or tetrazine (Tz) groups to enable antibody click. Details on the substituents R1 and R2 in the TCO and tetrazine chemical structures are provided in Supplementary Fig. 3. Right, SDS–PAGE confirms the increase in molecular mass after antibody click. This result was repeated for all the experiments involving antibody–ADC click. c, SDS–PAGE of non-clicked (no click; panitumumab plus trastuzumab–tetrazine) and clicked (click; panitumumab–TCO plus trastuzumab– tetrazine) antibody pairs after incubation in mouse serum (n = 2 mice per group and time). d, Cryo-TEM images of single or clicked antibodies. TEM images were obtained for n = 3 of the same conjugate. e, Western blot of EGFR and HER2 protein levels in NCIN87 cells was routinely repeated across experiments. A representative blot is shown. β-Actin was the loading control. f,g, Fluorescence quantification (f; via a plate reader) and confocal microscopy images (g) of NCIN87 cells 3 h after incubation with fluorescently labelled antibody pairs: either non-clicked (panitumumab plus trastuzumab–tetrazine) or clicked (panitumumab–TCO plus trastuzumab–tetrazine). Total fluorescence intensity was normalized to the protein amount and the no-click group (P = 0.01032, n = 5 coverslips per well per group, technical replicates). Data are the mean ± s.e.m.; significance was determined using the Welch two-sample t-test. Panitumumab or panitumumab–TCO were conjugated to Alexa Fluor 488 (green), whereas trastuzumab–tetrazine was conjugated to Alexa Fluor 594 (red). Scale bars, 2 mm (a), 28 nm (d) or 50 µm (g).
图2:HER2阴性细胞中的内吞与溶酶体转运 · PDF 第 4 页
Fig. 2 | Antibody click enhances internalization in HER2– cancer cell lines. a, Schematic of immunofluorescence and live-cell imaging experiments. Cells were incubated with the first pair (panitumumab–TCO) for 30 min, followed by the second pair (trastuzumab–tetrazine) for the corresponding time of the analyses. b, Western blot of EGFR and HER2 protein levels in MIAPaCa-2 cancer cells was routinely repeated across experiments. A representative blot is shown. β-Actin was the loading control. c,d, Quantification of fluorescence (c; via a plate reader) and confocal images (d) of MIAPaCa-2 cells after incubation with fluorescently labelled antibodies: either non-clicked (panitumumab plus trastuzumab–tetrazine) or clicked (panitumumab–TCO plus trastuzumab– tetrazine) antibody pairs. Total fluorescence intensity was normalized to the protein amount and no-click group (P = 0.00216, n = 5 coverslips per well per group, technical replicates). Panitumumab and panitumumab–TCO was conjugated to Alexa Fluor 488 (green), whereas trastuzumab–tetrazine was conjugated to Alexa Fluor 594 (red). Data are the mean ± s.e.m.; significance was determined using the Welch two-sample t-test. e, Quantification of trastuzumab–tetrazine–pHrodo fluorescence in EGFRhighHER2– MIAPaCa-2 and MDA-MB-231 cells and in EGFR–HER2– CT26 cells for 24 h after incubation with either non-clicked (panitumumab plus trastuzumab–tetrazine–pHrodo) or clicked (panitumumab–TCO plus trastuzumab–tetrazine–pHrodo) antibody pairs. The results showed an increase in internalization in the click group over time (P < 1.0 × 10⁻⁶ for MIAPaCa-2 and MDA-MB-231, and P > 0.9999 for CT26, n = 3 wells per group, technical replicates). Data are the mean ± s.d.; significance between no click and click was determined using two-way analysis of variance (ANOVA). No comparison across cell lines was performed. ‘%’ represents the phase area confluence of the cells in the well. RCU, relative calibrated units. f, Confocal fluorescence microscopy images of MIAPaCa-2 cells treated with either non-clicked (panitumumab plus trastuzumab–tetrazine) or clicked (panitumumab–TCO plus trastuzumab–tetrazine) antibody pairs and stained for LAMP1, a lysosomal marker. Panitumumab and panitumumab–TCO were conjugated to Alexa Fluor 488 (green), whereas trastuzumab–tetrazine was conjugated to Alexa Fluor 594 (red). Immunofluorescence experiments were repeated three times independently. Scale bars, 40 µm (d,f).
图3:双侧肿瘤中的分布及治疗响应 · PDF 第 5 页
Fig. 3 | Antibody–ADC click enhances tumour uptake and therapeutic efficacy. a,b, PET–CT image (a) and biodistribution (b) of 64Cu-labelled trastuzumab– tetrazine in NCIN87 tumours at 24 h after injection. 64Cu-labelled trastuzumab– tetrazine was administered 24 h after injection of panitumumab–TCO (n = 3 mice, biological replicates). Data are the mean ± s.e.m. c, Left, IHC images of HER2 and EGFR in a bilateral tumour model (highlighted areas in the image to the left) inoculated with A431 (HER2ULEGFRhigh, HER2 IHC of 1+/0; green) and NCIN87 (HER2+EGFRlow, HER2 IHC of 3+; orange) xenografts. Middle, corresponding western blot analyses of HER2 and EGFR protein levels (P = 0.00765 and P = 0.00156, respectively, n = 4 tumour lysates per group, biological replicates). Data are the mean ± s.e.m.; significance was determined using the Welch two-sample t-test. Right, PET–CT analyses show uptake of 64Cu-labelled trastuzumab–tetrazine alone compared with after click with panitumumab–TCO (n = 3 mice per group, biological replicates). 64Cu-trastuzumab–tetrazine was administered 24 h after panitumumab–TCO. PET–CT images were collected 24 h after 64Cu-trastuzumab–tetrazine administration. Scale bars, 250 µm. d, 64Cu-labelled trastuzumab–tetrazine biodistribution at 24 h after injection in the bilateral A431 and NCIN87 tumour model shown in c, comparing 64Cu-trastuzumab–tetrazine single antibody versus panitumumab–TCO plus 64Cu-trastuzumab–tetrazine (click). Antibody– ADC click significantly increased tumour uptake in HER2UL A431 tumours (n = 3–4 mice per group, biological replicates). Data are the mean ±s.e.m.; significance was determined using an unpaired t-test. e, Tumour growth curves in the bilateral A431 and NCIN87 tumour model. T-DXd click (panitumumab–TCO plus T-DXd–tetrazine) improved efficacy compared with no click (panitumumab plus T-DXd) or saline. Group × day, P = 0.0138 (A431) and P = 0.00976 (NCIN87). T-DXd no click × click, P = 0.0501 (A431) and P = 0.1269 (NCIN87). T-DXd– tetrazine (5 mg kg–1, intravenously) was administered 24 h after panitumumab– TCO (5 mg kg–1, intravenously). Data are the mean ± s.e.m.; n = 4–5 mice per tumour type, biological replicates; significance was determined using type III analysis and the emmeans package (v.1.10.7) with Dunnett’s correction for multiple comparisons. f, Responses in individual NCIN87 tumours following treatment with T-DXd, no click (panitumumab plus T-DXd) or T-DXd click (panitumumab–TCO plus T-DXd–tetrazine). Bars represent the fold change in tumour volume at the study end point relative to baseline at the start of therapy (n = 9 mice per group, biological replicates). Illustrations in c adapted from Servier Medical Art (https://smart.servier.com/) under a Creative Commons licence CC BY 4.0.
图4:低HER2与耐药模型中的肿瘤控制 · PDF 第 6 页
Fig. 4 | Antibody–ADC click overcomes tumour resistance to T-DXd. a, IHC images (right) of the highlighted area in the PET–CT image (left) of an admixed breast cancer model demonstrating low HER2 expression (IHC 2+) and high EGFR expression. PET–CT images were obtained 24 h after injection of 64Cu-labelled trastuzumab (9.90 ± 0.65%ID ml–1 mean tumour uptake, n = 4 mice, biological replicates). b, Tumour growth curves for the admixed breast cancer model following a single intravenous dose (5 mg kg–1) of saline, panitumumab, T-DXd, T-DXd no click (panitumumab plus T-DXd) or T-DXd click (panitumumab– TCO plus T-DXd–tetrazine). T-DXd click significantly decreased tumour growth compared with monotherapies and no-click controls. Group × day, P = 7.98 × 10⁻⁷; T-DXd no click × click, P = 0.0018 (n = 10−14 mice per group, biological replicates). Data are the mean ± s.e.m. c, Kaplan–Meier survival curves of groups in b show that T-DXd click significantly prolongs survival compared with all other groups. log-rank, P = 1.87 × 10⁻⁷; T-DXd no click × click, P = 1.20 × 10⁻⁴ (n = 10−14 mice per group, biological replicates). Ribbons represent 95% confidence intervals. d, HER2 and EGFR IHC imaging (right) was performed routinely across experiments. Images are of the highlighted area in the left image. MIAPaCa-2 pancreatic cancer xenografts are characterized by negative HER2 expression (IHC of 0) and high EGFR levels. PET–CT imaging (left) was performed routinely across experiments 24 h after administration of 89Zr-labelled trastuzumab (9.27 ± 2.42%ID ml–1 mean tumour uptake, n = 4 mice per experiment, biological replicates). e,f, Tumour volume (e) and survival (f) in xenograft-bearing mice following a single intravenous administration (5 mg kg–1) of saline, panitumumab, T-DXd, T-DXd no click (panitumumab plus T-DXd) or T-DXd click (panitumumab–TCO plus T-DXd–tetrazine). e, T-DXd click improved tumour control relative to monotherapies and no-click therapy. Group × day, P = 3.15 × 10⁻¹³; T-DXd no click × click, P < 1.10 × 10−323 (n = 8–10 mice per group, biological replicates). Data are the mean ± s.e.m. f, Kaplan–Meier survival analysis of the treatment groups in e. Mice receiving T-DXd click showed significantly extended survival compared with all other groups. log- rank, P = 2.28 × 10⁻⁸; T-DXd no click × click, P = 5.26 × 10⁻⁵ (n = 8–10 mice per group, biological replicates). Significance was determined using type III analysis and the emmeans package (v.1.10.7) with Dunnett’s correction for multiple comparisons. For survival, the log-rank test and Bonferroni correction for multiple testing were performed. Ribbons represent 95% confidence intervals. Scale bars, 125 µm (a,d).
图5:定点修饰、分布与安全性优化 · PDF 第 7 页
Fig. 5 | Site-specifically modified antibodies reduce batch variability and liver accumulation and improve biodistribution without compromising efficacy. a, Left, schematic of site-specific antibody click to obtain trastuzumab– ss-tetrazine and panitumumab–ss-TCO. Antibodies were enzymatically modified to add azide groups on Fc glycans, followed by conjugation to either Tz or TCO via azide (N3)-dibenzocyclooctyne (DBCO) reaction. Right, SDS–PAGE to confirm antibody click was repeated for all the experiments. b, Cryo-TEM images of site-specific antibody click (n = 3 of the same conjugate). Scale bars, 28 nm. c, Blot of multiple antibody–TCO conjugate (targeting EGFR, HER2, PD-L1, PSMA and VEGF) click reactions to trastuzumab–tetrazine. Results were repeated for each click conjugate. d, Left, PET–CT image of 64Cu-trastuzumab–ss-tetrazine at 24 h after injection in the bilateral A431 and NCIN87 tumour model. 64Cu-trastuzumab–ss-tetrazine was administered 24 h after panitumumab–ss-TCO. Right, liver uptake of antibody click prepared using site-specific methods was lower than for conjugates obtained through random conjugation (P = 0.0064, n = 4 mice per group). Data are the mean ± s.e.m.; significance was determined using the Welch two-sample t-test. e, Serum chemistry of aspartate aminotransferase (AST), alanine aminotransferase (ALT) and alkaline phosphatase (ALP) in mice treated with saline (n = 7 mice), no click (panitumumab plus T-DXd, n = 4 mice), random click (panitumumab–TCO plus T-DXd–tetrazine, n = 3 mice) or site-specific click (panitumumab–ss-TCO plus T-DXd–ss-tetrazine, n = 4 mice). Antibodies were administered at 20 mg kg–1. Data are the mean ± s.e.m.; significance was determined using two-way ANOVA. f,g, PET–CT (f) and biodistribution (g) at 120 h after 89Zr-trastuzumab–ss-tetrazine administration in HER2–EGFRhigh MiaPaCa-2 pancreatic xenografts in click (panitumumab–ss-TCO plus trastuzumab–ss-tetrazine), pre-click (panitumumab–ss-TCO reacted with trastuzumab–ss-tetrazine before injection) or control IgG (IgG–ss-TCO plus trastuzumab–ss-tetrazine) groups. Data are the mean ± s.d. (n = 4 mice per group). Significance was determined using an unpaired t-test. h, Tumour growth curves for the MIAPaCa-2 (pancreatic cancer) and admixed breast cancer models following a single intravenous dose (5 mg kg–1) of saline (n = 10 mice per group) or site-specific T-DXd click (panitumumab–ss-TCO plus T-DXd–ss-tetrazine). Group × day, P = 4.53 × 10⁻¹⁴ (MIAPaCa-2) and P = 1.0 × 10−323 (admixed breast cancer) (n = 10 mice per group). Data are the mean ± s.e.m.; significance was determined using type III analysis and the emmeans package (v.1.10.7) with Dunnett’s correction for multiple comparisons.
完整阅读记录与证据表
文献卡:Modular in vivo antibody–ADC click to reverse drug resistance in tumours
- Paper ID:p-0036-art-modular-vivo-antibody-adc-click-reverse。
- 接收/分析日期2026-10-22;晨会2026-10-26;Nature 657,252–261 (2026),在线2026-07-15;DOI10.1038/s41586-026-10789-w。
- Skill:article-read、morning-report、pdf、spreadsheets、web-publish。
- 主PDF26页已核读:正文/参考文献第1–10页、方法/声明第11–16页、5扩展图第17–21页、报告摘要第22–26页。末5页视觉读取;官方独立报告摘要与其逐页像素一致。
- 补充信息37页:27补图(图1跨两页)、4补表、两页算法均已读;源数据28页签全部读入16,152非空单元格,关键组别/分母/均值/终点计数定点核查,未重跑全套统计模型及影像分析。
- 审稿文件38页:第1–5、19–21、35–38页定点读取,第21页科学图已看;第6–18、22–34页未逐页阅读。审稿版本不替代最终出版资料。
- 原件与4官方附件完整归档;45 PNG(5主图、5扩展、28补图截图、4补表、2算法页、1审稿图),图注与检查见figures/README.md、captions.md、manifest.json。人工pending。
一句话结论
通过序贯给药将互补点击修饰的抗体与HER2 ADC共价连接,可在若干小鼠肿瘤模型中改善递送和治疗终点;图文/源表的部分缓解计数和摄取值仍不一致,临床疗效及机制贡献有待进一步验证。
研究问题与背景
作者研究低或异质性靶抗原、内吞受限导致的ADC递送不足。以帕尼单抗–HER2 ADC及帕妥珠单抗–HER2 ADC为主要组合,利用TCO/四嗪反应建立模块化体内连接。创新点是以有靶向能力的抗体/ADC作为两种反应组分,继而检验内吞、分布和疗效。
贡献与比较对象
比较包含单抗或ADC单药、未连接的抗体加ADC、可点击组合、IgG伙伴、预先连接及游离四嗪占位。裸抗体荧光/示踪实验与ADC动物治疗分别记;化学连接形成多价复合物,并非统一1∶1结构。HER2阴性为作者模型分类,仍可保留低水平曲妥珠单抗摄取。双抗对照仅商业scFv-Fc构型的成像/分布实验(补图12),没有证明普遍优于所有双抗或双特异ADC。
方法与验证
- 连接:凝胶、MALDI、SEC-HPLC和TEM;随机修饰与Fc糖链定点修饰。未重做谱图峰分配或DAR定量。
- 内吞:pHrodo、共聚焦与LAMP1。图1f/2c各5技术重复;图2e每组3孔,跨细胞系未作直接检验。图2e的CT26对照与表达人HER2的CT26-hHER2分别处理。
- 模型:NCIN87胃癌、A431表皮样癌、MIAPaCa-2胰腺癌、JIMT1与MDA-MB-231按4∶1混合的乳腺癌、BT474曲妥珠单抗耐药;多数在nu/nu小鼠,CT26-hHER2在BALB/c。
- PET量为%ID/mL;离体γ计数为%ID/g;平均与最大PET读出分别记。抗体分布未直接测游离细胞毒载荷浓度。
- 肿瘤体积:AR(1)相关结构混合模型、组别×时间、共同可观察窗口;末共同时间点相对click的Dunnett比较,另拟合click/no-click两组模型;不把整体交互检验换作两组疗效检验(主第15页)。
- 生存:log-rank、Bonferroni两两比较;方法亦述Cox HR。终点含体积>1,500 mm³、体重下降>20%、溃疡等动物人道终点。
- 随机/盲法:按基线肿瘤大小分层随机;报告摘要说明治疗测量等盲法,但耐药转用研究为单一治疗而未盲、体外实验未盲。报告严重C. bovis感染动物被排除,分组排除数未逐项给出。
核心证据
| 主张或结果 | 数字、条件与对照 | PDF/图表/源表 | 依据类型 | 核对状态 |
|---|---|---|---|---|
| 抗原空间分布 | 两份混合模型切片高表达掩膜DSC0.12、0.26;为组织区域重叠 | 主2图1a;补6图2;补36–37算法 | 原图/正文/方法 | 已核;非分子距离或人群估计 |
| 连接形成 | 随机约3–12、该定点体系约2–4基团/抗体;电泳高分子量及TEM复合物 | 主2–3、7–8;补7–9、24–27 | 图表/正文 | 已核;不将5种抗体连接均写成5种疗效验证 |
| NCIN87荧光 | click高于no click,P=.01032,5技术重复 | 主2图1f;源表Figure 1f C5:D9 | 图/源表 | 已核 |
| MIAPaCa-2荧光 | P=.00216,5技术重复 | 主4图2c;源表Figure 2c C5:D9 | 图/源表 | 已核 |
| 内吞对照 | MIAPaCa-2、MDA-MB-231均P<10⁻⁶;CT26 P>.9999,3孔/组 | 主4图2e;补14图10 | 原图/图注 | 已核;Figure 2e页签未列CT26,不能称源表完整重现该面板 |
| 双侧分布 | 正文A431单抗3.75±.64→click11.90±.82 %ID/g;NCIN87 28.90±3.84→31.63±3.29 | 主3/5图3d;源表Figure 3d B2:E58 | 正文/图/源表 | 有出入:源表single Ab A431均值9.25199、NCIN87 32.23384;click对应11.90637、31.62529。精确增幅待澄清 |
| 双侧轨迹 | 整体交互A431 P=.0138、NCIN87 .00976;图注click/no-click P=.0501、.1269;每组4–5只 | 主5图3e;源表Figure 3e A3:D143/G3:J143 | 原图/图注/源表 | 已核;不能用前两项替代两组显著性 |
| NCIN87单鼠终点 | 作者正文100%完全缓解;源表9/9负变化、仅4/9恰为−1 | 主5图3f;源表Figure 3f C6:C14 | 正文/图/源表 | 不一致;只据源表描述各瘤均下降,不自行认证CR率 |
| 免疫完整模型 | 正文CR7/14对2/14;源表click14个值中6负值、4个−1;no-click2个−1 | 主5;扩展图2f主18;源表Ext. Figure 2f C6:D19 | 正文/图/源表 | 不一致;−1计数为源表核对,不替作者重新定义CR |
| 混合乳腺癌 | 原始各组10/10/10/10/14只;click/no-click体积P=.0018,生存校正P=1.20×10⁻⁴ | 主6图4b/c;方法14;Figure 4b/c | 图/方法/源表 | 关键分组/人数已核,全部混合模型与Cox未复算 |
| 胰腺癌 | 原始各组8/10/10/10/10只;生存校正P=5.26×10⁻⁵;体积图注报P<1.10×10⁻³²³ | 主6图4e/f;Figure 4e/f | 图/方法/源表 | 生存方向与图一致;极端体积P值仅保留原报告 |
| 化学占位 | 游离Tz后部分个体疗效减弱,7对10只 | 补21图17 | 原图/图注 | 已核;未以此量化各反应部位占比 |
| 非靶向ADC对照 | IgG–DM1 click未改善轨迹,整体交互P=.761,6–10只/组 | 扩展图3d主19;补22图18;源表Ext. Figure 3d | 图/方法/源表 | 已核;载荷/构型并非全部完全匹配,不单凭该对照证明HER2绝对必要性 |
| NCIN87转用 | 正文/图注5/9响应;源表J6:J14仅4负值。初次T-DXd图有12只治疗+4对照,方法总n16;补图19 PET仅10只 | 主6/8/14、扩展4b主20、补23;Ext. Figure 4b | 正文/图/方法/源表 | 阈值、计数和分析对象未完全对应;不作确定响应率 |
| BT474转用 | 原有曲妥珠单抗耐药;10只T-DXd后6未应答,转click后5/6负变化且值−1 | 主8/14、扩展4d主20;Ext. Figure 4d J7:J12 | 正文/图/源表 | 已核;转用阶段无同期随机对照 |
| 定点肝分布 | 24h离体定点约6.98267、随机14.26557 %ID/g,4只/组;原文P=.0064 | 主7–8图5d;源表Figure 5d B3:C6 | 图/正文/源表 | 已核;约降一半 |
| 定点120h分布 | PET最大肿瘤24.93±2.75;IgG18.46±2.72、pre-click12.67±1.72 %ID/mL,4只/组;终点P=.00116、1.51×10⁻⁴ | 主8–9、扩展5b主21;Ext. Figure 5b E11:P11 | 正文/原图/源表 | 读出与分组已核;图注时间斜率对比与120h点比较分别记录 |
| 定点治疗 | MIAPaCa-2及混合乳腺癌各10只/组,仅盐水对照 | 主7–8图5h;Figure 5h | 图/方法/源表 | 已核;未作定点对随机的直接疗效非劣比较 |
| 小鼠安全 | 血生化15天,20 mg/kg;组分母7/4/3/4;no-click AST实际源表仅3值;病理7天两组各3只 | 主7–8/15;补18、33;Figure 5e | 图/方法/表/源表 | 已核;病理所见与作者归因分别保留 |
局限与待解问题
作者明确指出
循环内和肿瘤局部都可连接;受体转运、聚集及药代改变相对贡献未分开。药物间隔、基团/连接臂、构型和穿透性仍需优化;DXd肺毒性等需要进一步模型及剂量研究。仅为临床前证据,尚无本平台患者治疗数据(主第9页)。
AI推断与理由
公开源表与正文不一致使精确完全缓解率与部分摄取倍数尚不能统一;完整位置及数字见coverage.md。全部原文和图像原样保留,公开阅读稿不沿用100% CR等与源表不合的肯定概括。CT26-hHER2为工程化小鼠模型;人体选择还需同时评价靶点分布、内吞、药代与载荷敏感性。
前后转用的个体变化含选择、时间与既往给药影响;缺同期对照的结果适合提出后续假设。商业双抗成像对照与本平台不属于完全匹配的构型/疗效对照。短期病理对背景改变的归因来自原作者/病理医师,未独立确证长期毒性。以上为本次证据评价,不作为作者已经验证的结论。
待核对问题与后续阅读
优先澄清Figure 3d对照行、3f及扩展2f缓解定义、扩展4b的阈值/计数与个体映射、误差条SD/SEM、异常极小体积P值。影像原始扫描、全部分析代码与重复测量模型未重算;源表扫描/统计审查范围见coverage.md。
两篇优先追读原始研究:Gupta等《EGFR-directed antibodies promote HER2 ADC internalization and efficacy》(Cell Reports Medicine 2024,PubMed39437778)及Li等《A Biparatopic HER2-Targeting Antibody-Drug Conjugate Induces Tumor Regression in Primary Models Refractory to or Ineligible for HER2-Targeted Therapy》(Cancer Cell 2016,PII S1535610815004729)。仅核对题名/公开检索摘要片段;PubMed/PMC及期刊正文尝试分别遇验证页或403,未取得全文/附件,不把搜索摘要当独立机制复核。