研究问题与核心发现
同样被诊断为三阴性乳腺癌(TNBC)的患者,对化疗的应答存在明显差异。将整块组织混在一起测序时,一个“免疫活跃”的表达信号可能同时来自癌细胞、巨噬细胞和淋巴细胞。这篇研究先确定表达信号来自哪些细胞,再追问这些细胞在患者之间如何共同出现、在组织里如何排列,以及这些结构与化疗结局的关系。
研究区分了四个层级:archetype是患者层级的癌细胞内在分型;metaprogram是同一肿瘤中可并存的癌细胞表达程序;ecotype是跨患者共同出现的细胞状态组合;spatial niche是局部空间邻域。 最终得到四种archetype、13种癌细胞元程序、49种免疫和基质细胞状态、八种生态型及十种空间生态位。(PDF第2–9、13–15页)
研究设计与分析人群
样本来自ARTEMIS研究的108名治疗前患者。新辅助化疗主要包括多柔比星/环磷酰胺,随后采用紫杉醇为基础的治疗;50人获得病理完全缓解(pCR),39人有残余病灶(RD)。另19人因治疗中反应欠佳改用靶向方案,未纳入本文化疗应答比较。该研究的TNBC定义也允许ER或PR低表达(1%至<10%)患者。(PDF第2、11页;补表1)
| 数据层级 | 实际范围 | 在研究中的作用 |
|---|---|---|
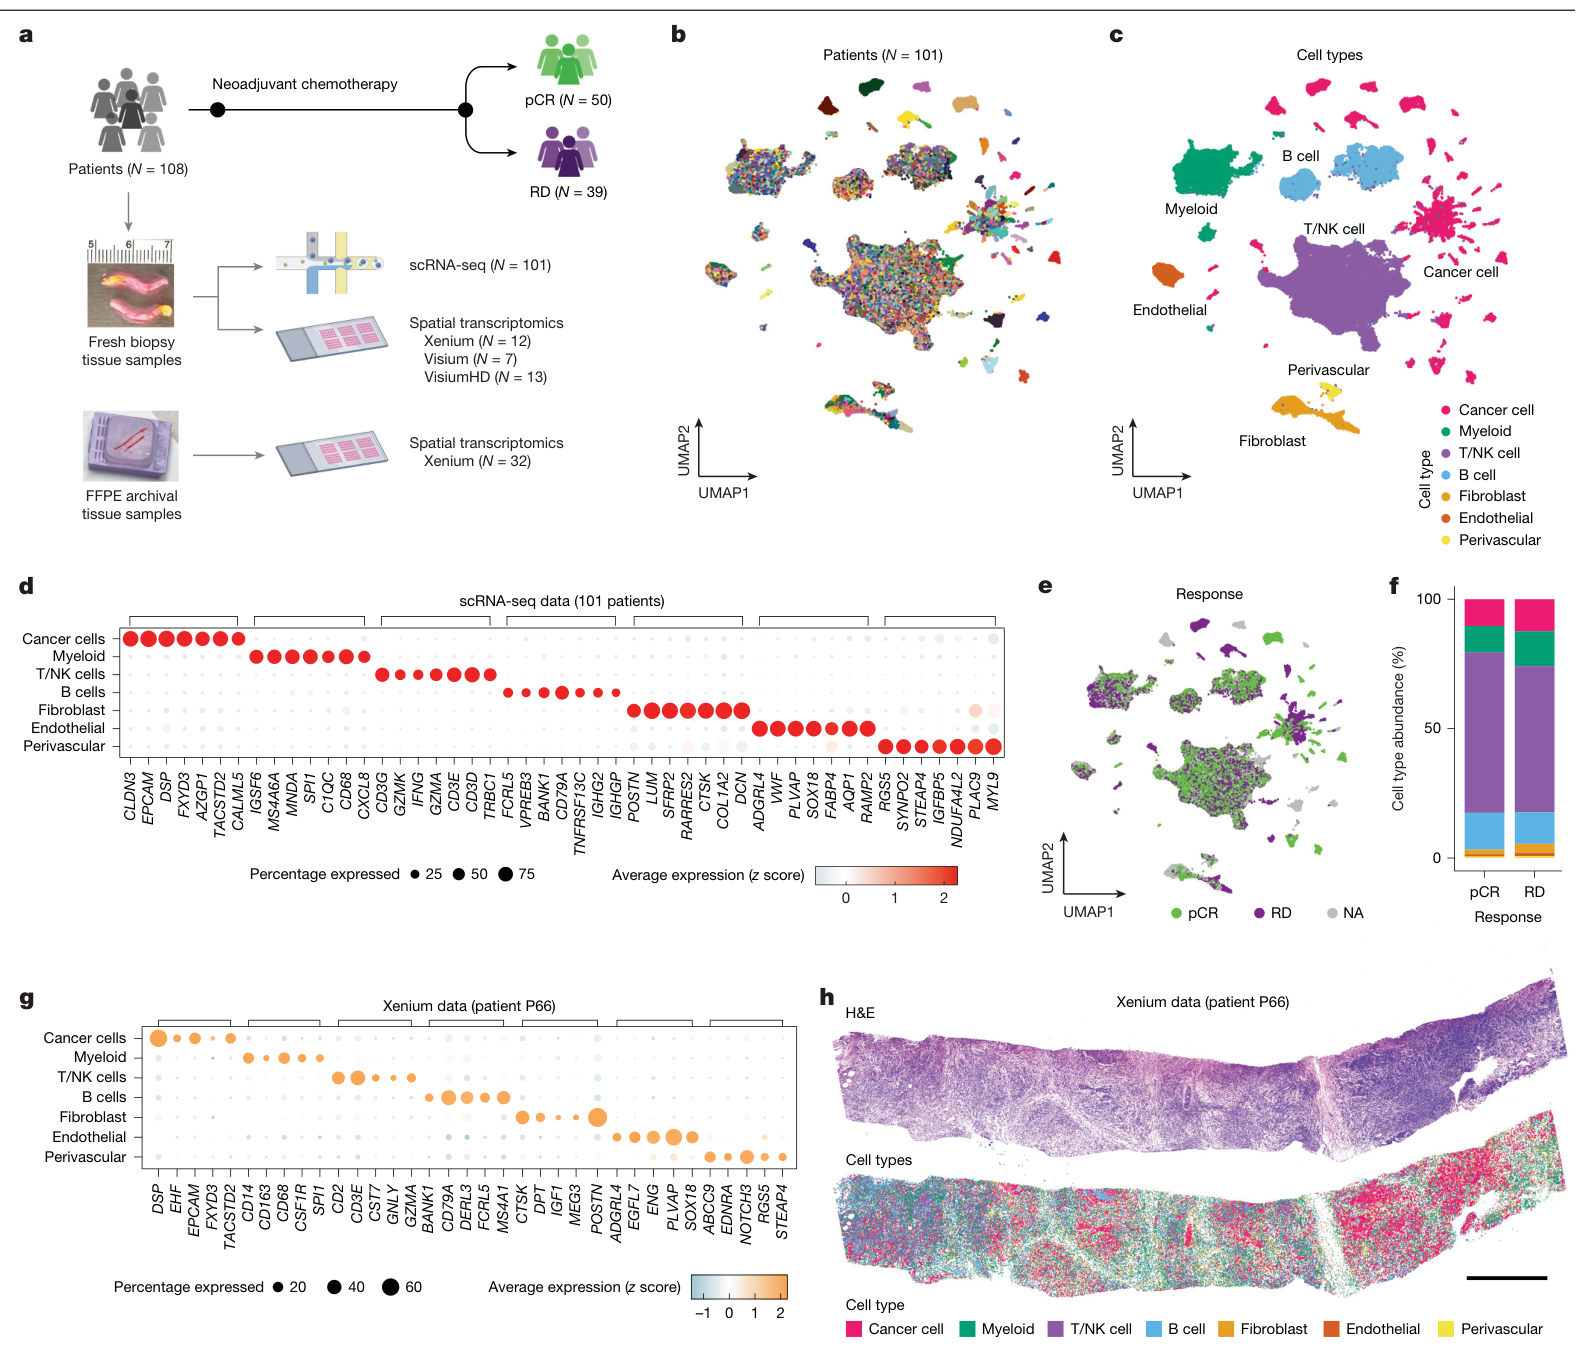
| 单细胞转录组 | 101人,质控后427,857个细胞 | 分辨癌细胞、免疫和基质细胞 |
| 癌细胞分析 | 97人,49,275个癌细胞 | 建立患者分型与癌细胞元程序 |
| 空间平台合计 | 补表1逐人记录为46人;其中Xenium 44人 | 定位癌细胞程序与局部细胞组合 |
| 两类数据重叠 | 单细胞与任一空间平台重叠39人 | 跨技术对应,而非将所有空间样本视为配对样本 |
| 正常乳腺参照 | Human Breast Cell Atlas中50名无乳腺疾病个体的数据 | 比较正常组织与TNBC的细胞状态构成 |
| 外部队列 | BrighTNess、I-SPY2、METABRIC、SCAN-B的相应数据 | 分型、应答风险评分及生存关联验证 |
补表2的质控后细胞数与癌细胞数合计分别为427,857和49,275,与主文一致。患者数、细胞数和空间邻域数是不同的分析单位。(PDF第2–3、14–16页;补表1–3)
四种患者分型来自癌细胞本身
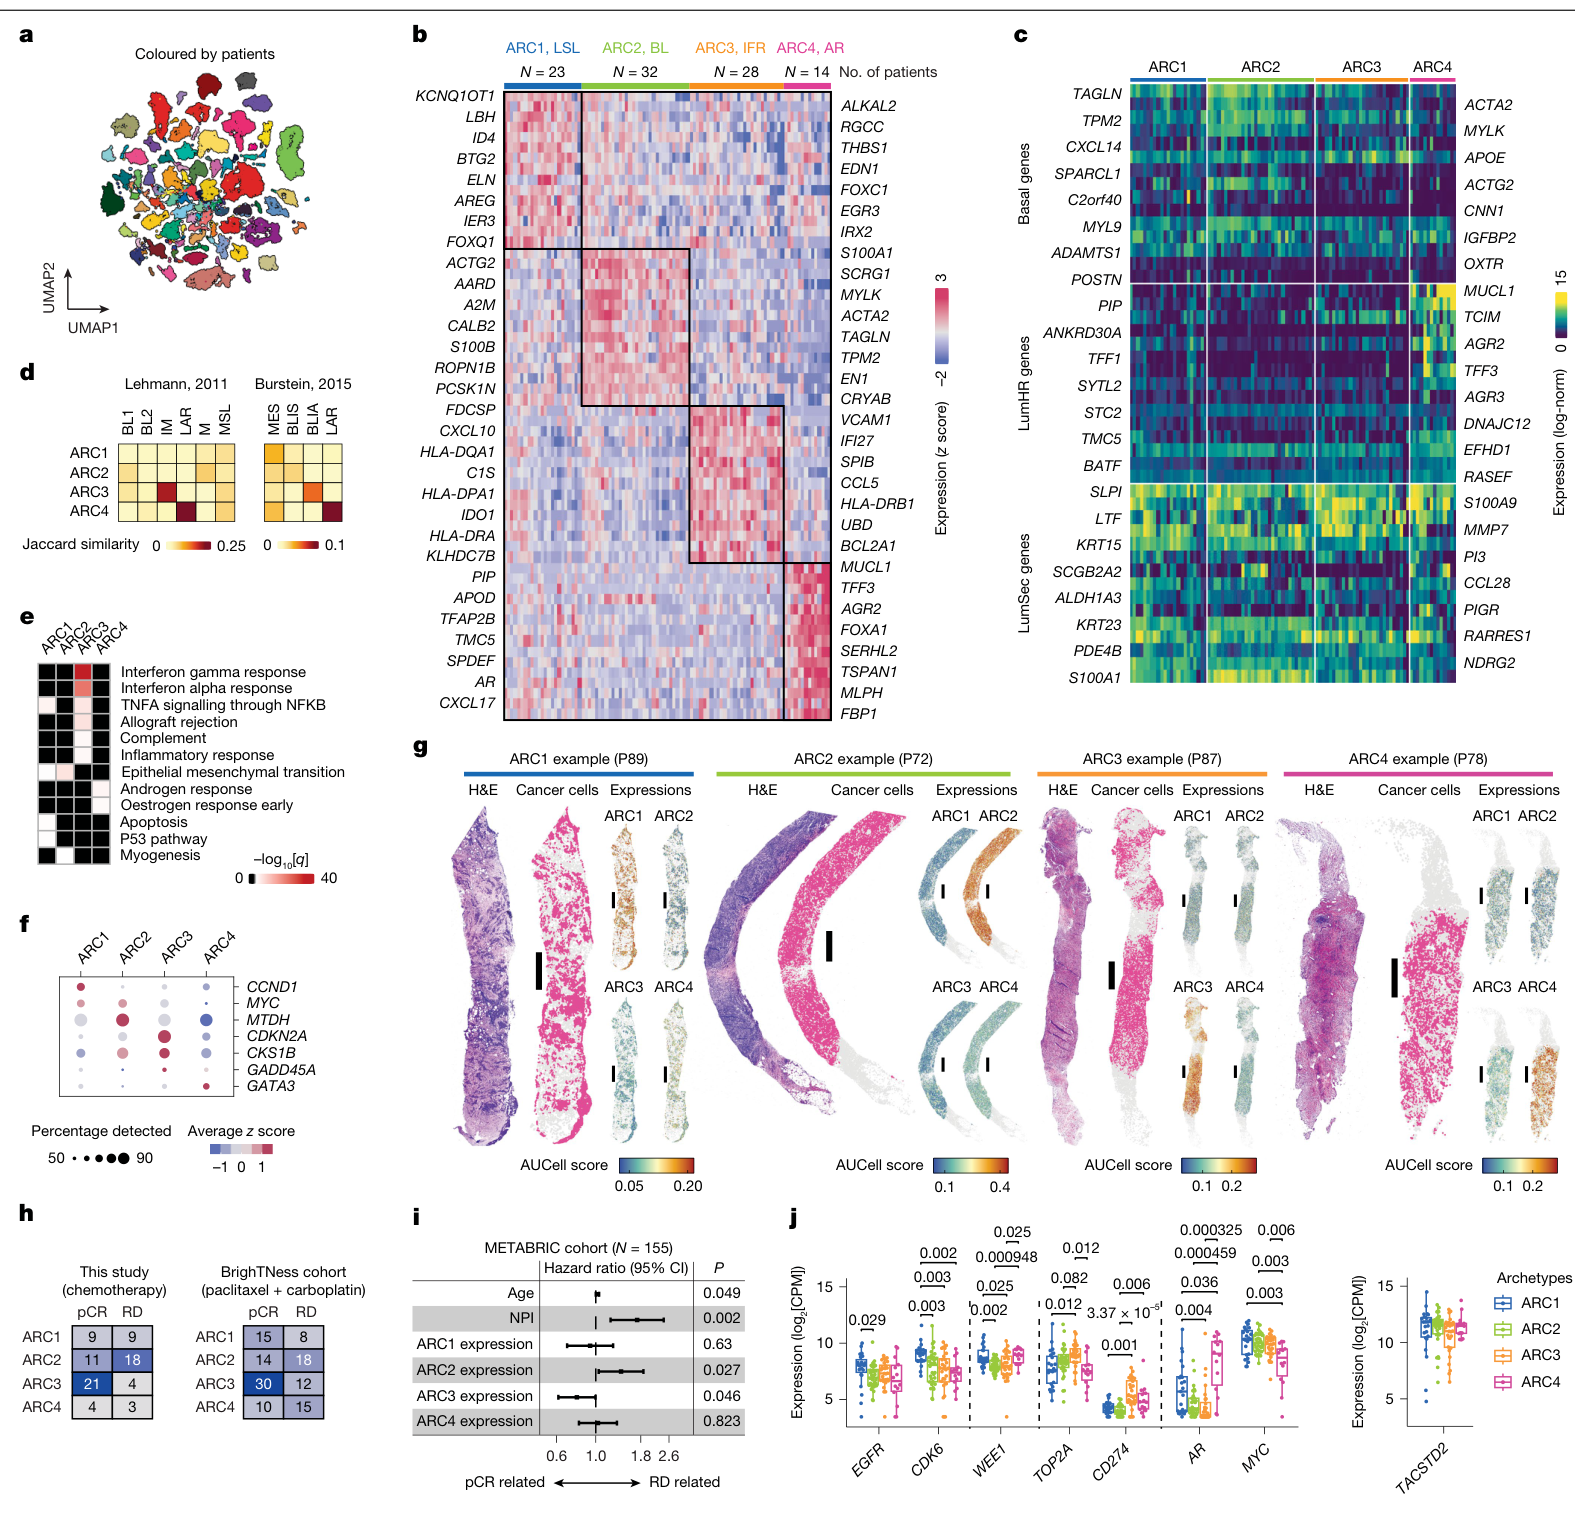
研究将每名患者的癌细胞聚合为pseudo-bulk表达谱,再通过非负矩阵分解建立四种分型,减少免疫或基质细胞混入对分型的影响。
| 分型 | 主要表达特征 | 本队列有化疗应答数据者的pCR / RD |
|---|---|---|
| ARC1 | 腔面分泌细胞样,伴应激及部分EMT相关信号 | 9 / 9 |
| ARC2 | 基底样,含TAGLN、ACTA2等程序 | 11 / 18 |
| ARC3 | 干扰素应答、HLA和炎症相关程序 | 21 / 4 |
| ARC4 | 雄激素受体相关程序 | 4 / 3 |
表中的79人是97名癌细胞可分析患者中具有应答数据的子集,与108人总队列的50/39应答分布使用不同分母。四种分型与应答的总体关联在本队列为P=0.0071,在BrighTNess为P=0.024;ARC3偏向pCR,ARC2偏向RD。METABRIC中的ARC2、ARC3表达签名分别与较差、较好的总生存相关。(图2h–i;PDF第3–4页;补表1)
分型保留了连续性:97人中77人由一种archetype主导,其余20人有两种或以上接近的信号。因此,患者标签和内部细胞程序需要同时看。(PDF第3页;扩展图2f)
干扰素、HLA-II与细胞周期提供不同信息
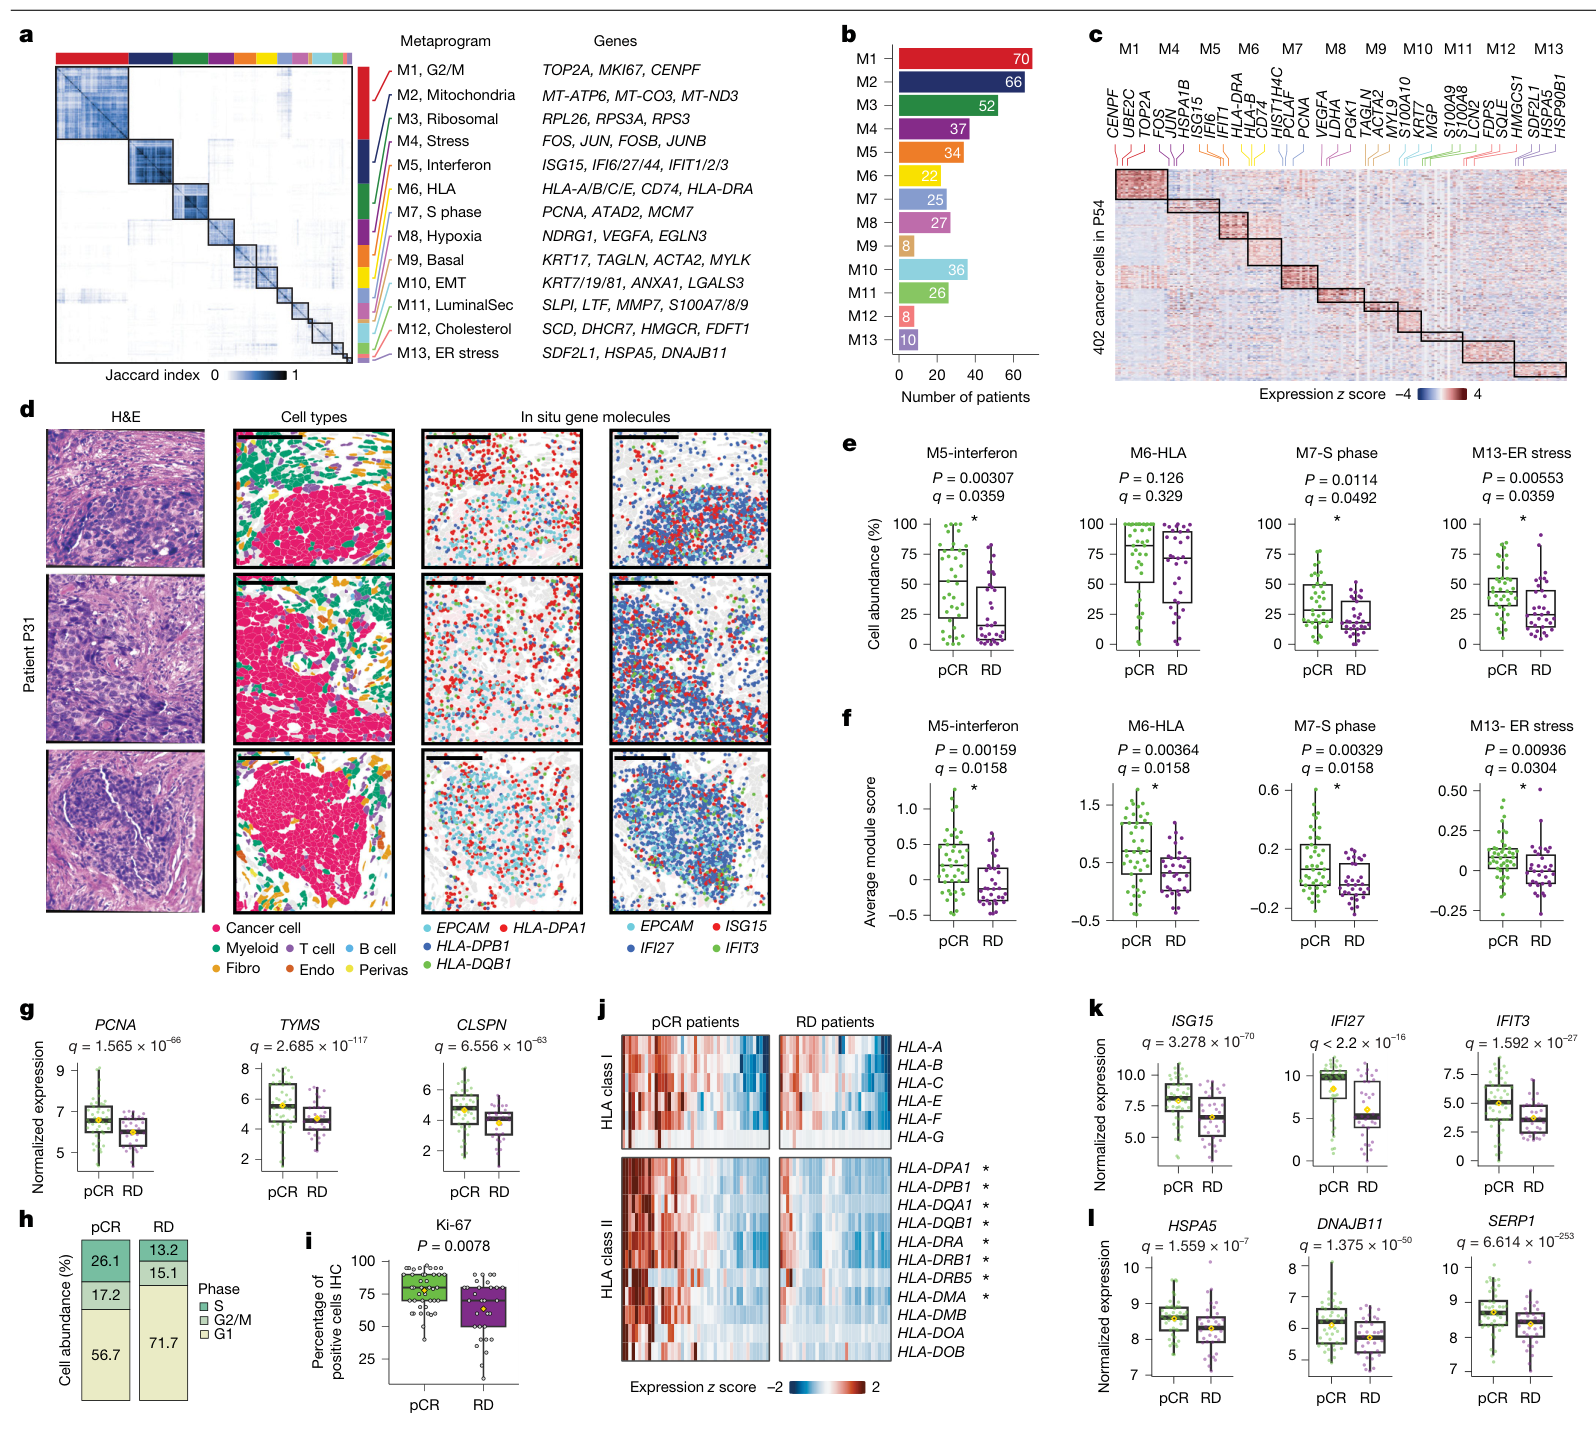
13种元程序中,M5干扰素、M7 S期和M13内质网应激在pCR患者中同时表现为更高的细胞比例和模块评分。M6 HLA程序的情况不同:其平均模块评分在pCR中较高(q=0.0158),细胞比例差异则未达显著(q=0.329)。两种读出分别对应表达强度和细胞比例。(图3e–f;PDF第3–5页)
进一步分析显示,HLA-II相关基因在pCR组癌细胞中表达更高,而HLA-I基因的表达较为接近;Xenium在原位确认了癌细胞中的HLA-II与干扰素相关表达。细胞周期推断显示pCR组S期和G2/M期比例更高,Ki-67染色也较高(P=0.0078)。这些结果将化疗应答关联到癌细胞的增殖及免疫相关表达状态。(图3d、g–l;扩展图3;PDF第5页)
巨噬细胞的具体状态比总量更有区分度
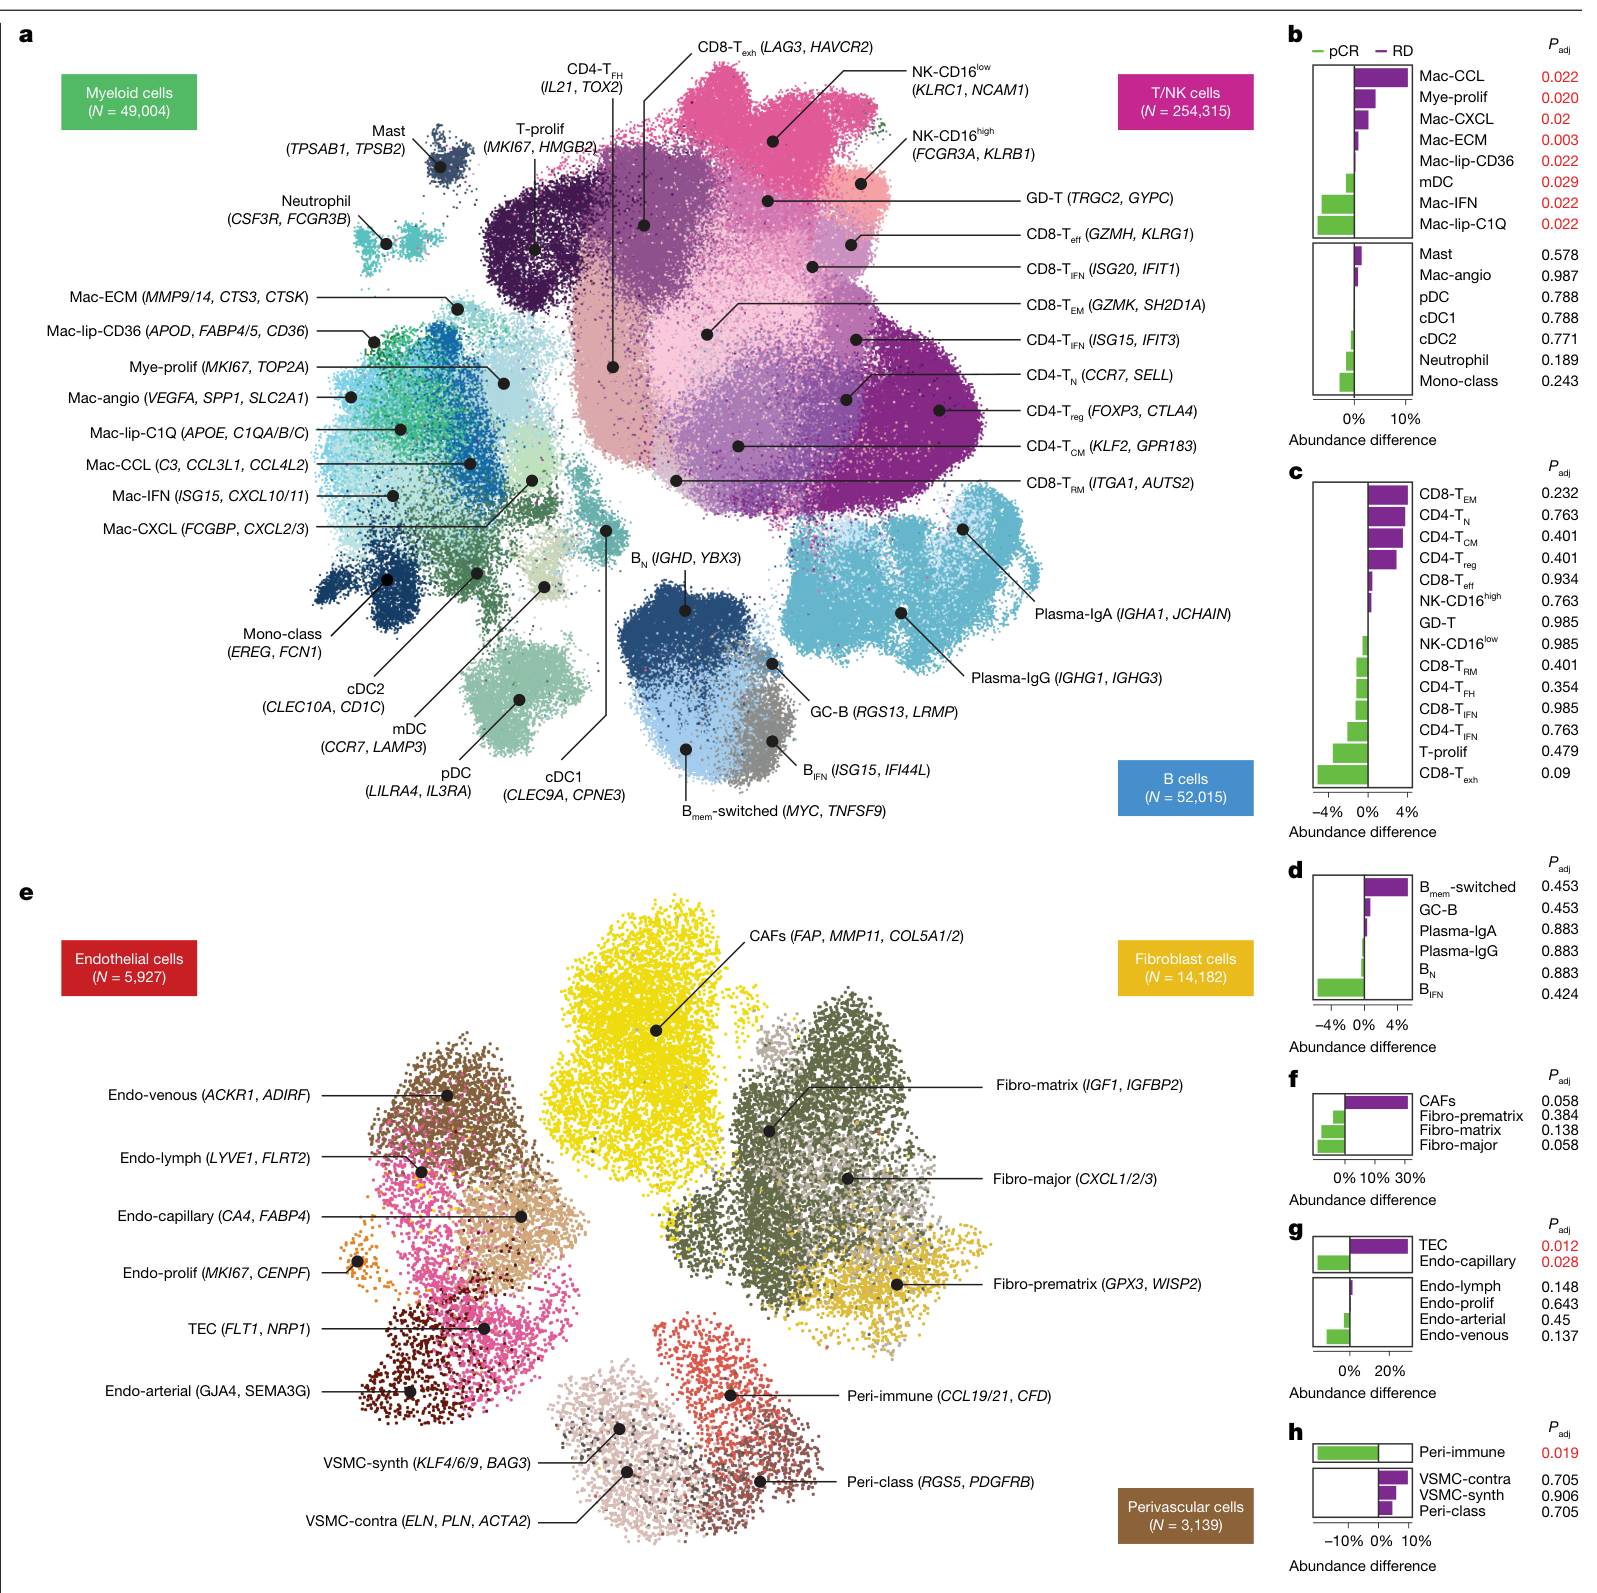
在主要细胞类型层面,pCR与RD的组成差异并不显著;继续细分后,髓系细胞呈现更清楚的应答相关差异。Mac-IFN和Mac-lip-C1Q在pCR中富集,Mac-CCL、Mac-CXCL、Mac-ECM及增殖髓系细胞在RD中富集。基质中,免疫信号相关周细胞偏向pCR,肿瘤内皮细胞偏向RD。(图1f、图4b、f–h;PDF第3、6–7页)
CD8耗竭样T细胞在pCR中较多、CD8效应记忆T细胞在RD中较多,但这些T/NK细胞状态的差异经多重比较校正后均未达显著;B细胞状态也没有显著差异。研究对巨噬细胞的强调来自本队列的状态分辨率与统计结果。(图4c–d;PDF第7页)
共现生态型与局部空间结构
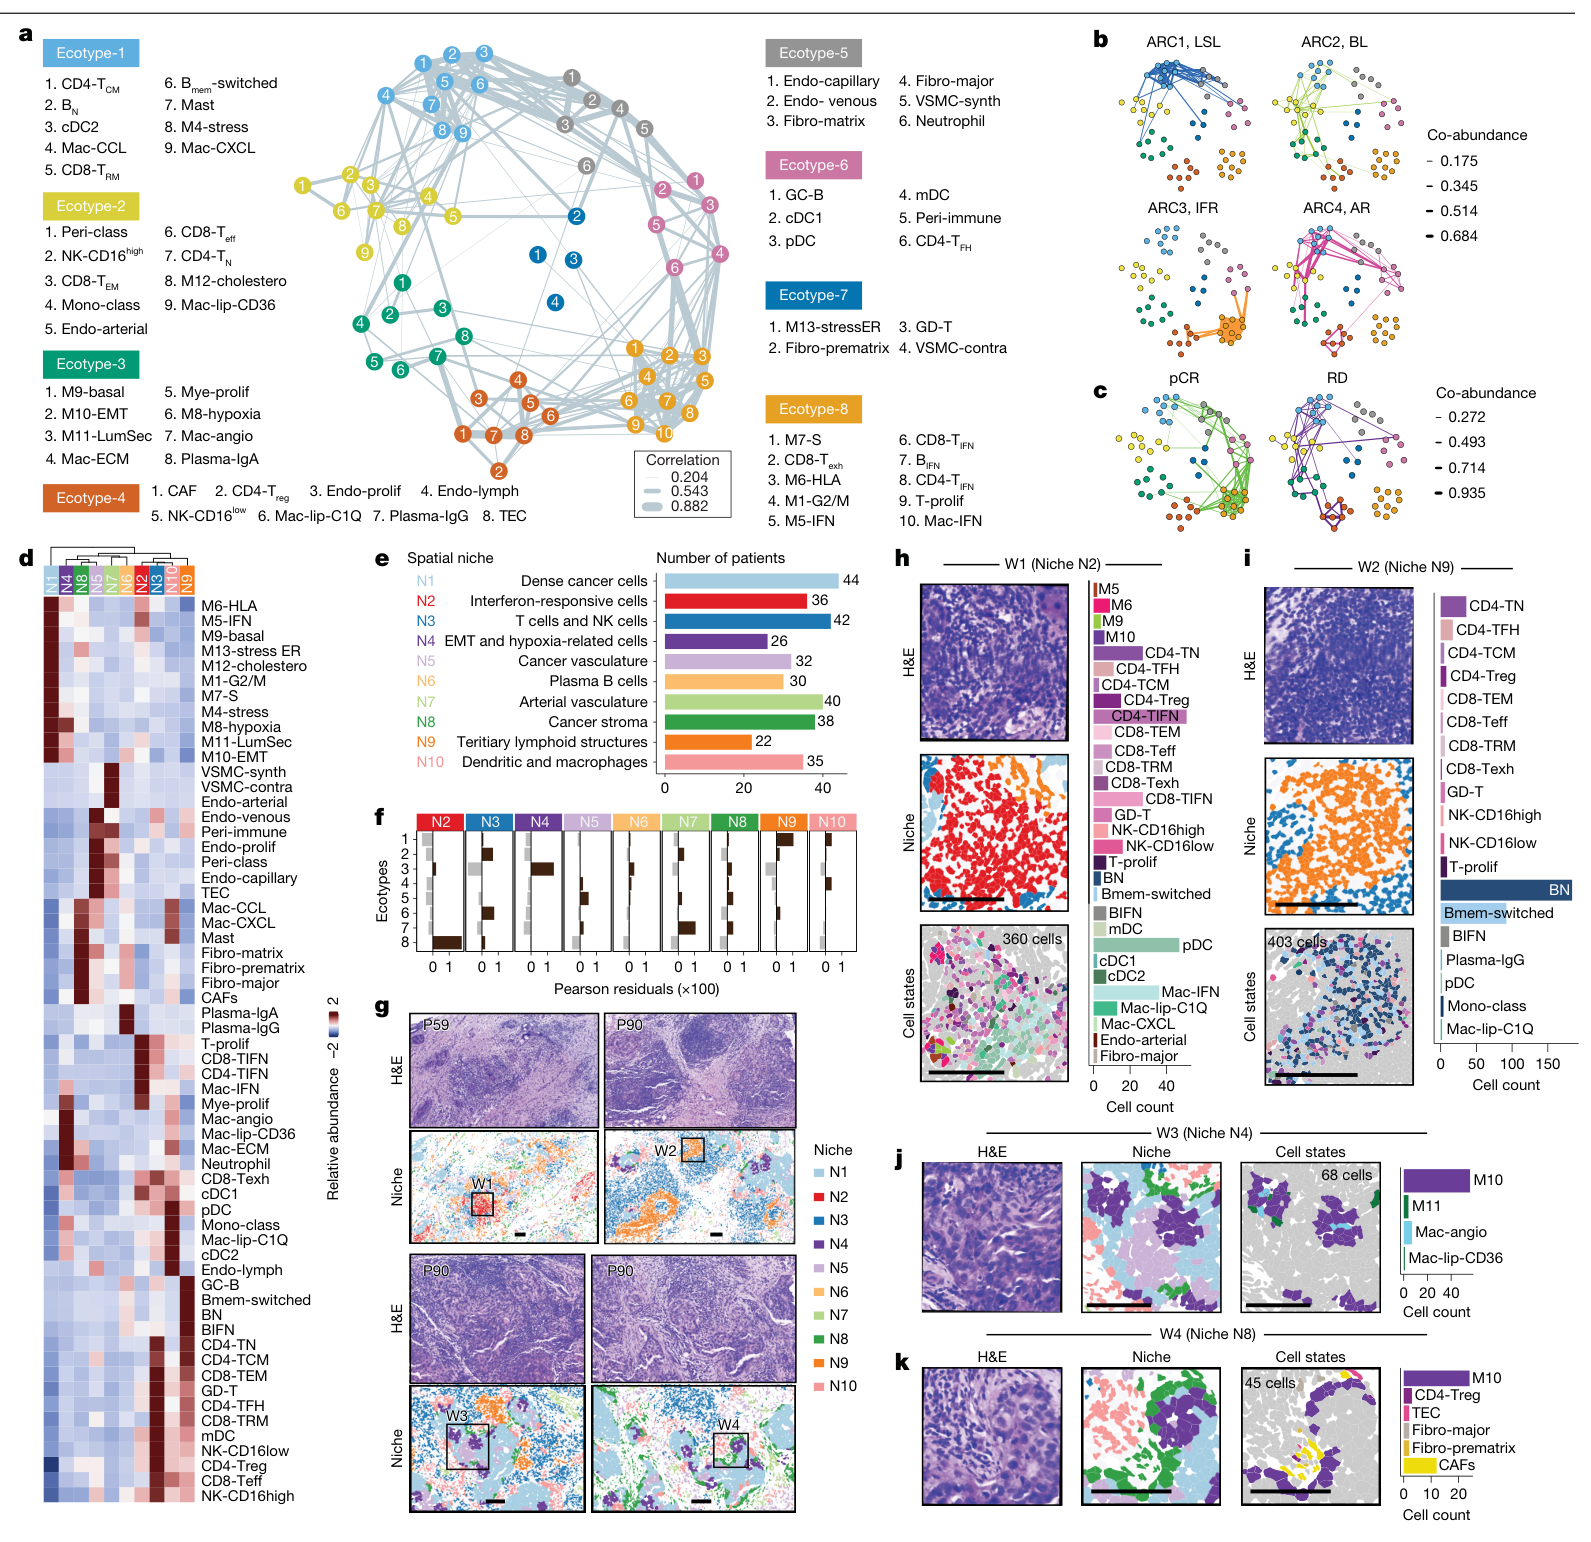
生态型先由患者之间的细胞比例相关网络定义,再用空间数据检查局部共定位。空间邻域分析以单细胞为中心、取30 μm半径内的细胞组成,最终识别十种可重复出现的邻域。(PDF第7、14–15页)
| 组合 | 主要构成与组织特征 | 应答相关方向 |
|---|---|---|
| Ecotype-3 / N4 | 缺氧、EMT相关癌细胞与促血管/基质重塑相关髓系状态;部分细胞在空间中共定位 | RD相关组合 |
| Ecotype-6 / N9 | 树突状细胞、滤泡辅助T细胞及生发中心B细胞,呈TLS样结构 | pCR相关组合 |
| Ecotype-8 / N2 | 干扰素相关癌细胞和多类免疫细胞,并伴HLA程序 | pCR相关组合 |
| N8癌基质邻域 | EMT相关癌细胞、CAF和肿瘤内皮细胞等,来自多个生态型 | 展示空间邻域可跨越共现网络分组 |
部分共现组合与局部邻域对应,另一些组合跨越不同组织区域。CellChat提供了候选配体–受体联系;这些联系属于计算推断,功能机制仍待干预实验检验。(图5、扩展图8–9;PDF第7–8页)
两类预测模型
细胞频率模型使用癌细胞元程序和微环境状态,按70%训练、30%测试划分,并在训练阶段进行交叉验证。扩展图10b标出的逻辑回归训练AUC为0.797、测试AUC为0.883。另一类模型从单细胞发现中选出13个基因,用整体pseudo-bulk表达预测RD风险;在I-SPY2和BrighTNess中,pCR与RD的风险评分分布有差异(分别P=0.0018和P=0.034)。这两类模型使用的输入与验证方式不同。(PDF第8–9、16页;扩展图10b、f;补表9)
局限与待解问题
治疗中改用靶向方案的19人未进入应答比较,所见关联受入组、活检质量和治疗路径选择影响。样本解离也可能偏向较小、较易存活的免疫细胞,基质细胞相对不足。研究主要分析治疗前组织;化疗期间生态结构怎样变化,以及这些特征在当前化疗联合免疫治疗中的表现,需要纵向和前瞻性验证。
共现、共定位和应答关联提供了候选解释链,尚缺少针对特定巨噬细胞或癌细胞程序的功能干预。统计推断的独立单位仍是患者;细胞数量主要增加状态分辨率。外部队列中的评分关联仍需独立的预测性能、校准和临床效用验证。
原文对模型性能另有“平均AUC=0.84”的表述,图10b与讨论则给出测试AUC=0.883;这里按图分别列出训练和测试值。正文也有“46名匹配空间样本”的写法,补表1逐人平台记录支持空间总计46人、与单细胞重叠39人,故研究设计按可核对的平台清单列示。(PDF第3、8–9页;补表1)
进一步的研究线索
本文把治疗前异质性拆成“患者内在分型—细胞状态—局部组织结构”三个相互关联的尺度。一个可追踪的问题是:应答更好的干扰素生态组合,究竟来自既有的免疫环境、癌细胞自身程序,还是两者持续反馈?这属于基于本研究的后续假设。验证需要配对纵向样本和有针对性的扰动,再观察相应细胞组合与治疗结局如何变化。
可继续追读的原始研究包括:2011年TNBC分型研究与2023年成人乳腺单细胞空间图谱。本次核对了书目信息,未独立精读两篇原文。
主图与表格 · 5 张
图1:队列设计与主要细胞类型 · PDF 第 2 页
Fig. 1: Study design and main cell types in TNBC. a , Experimental workflow for scRNA-seq and spatial transcriptomic profiling of patients with TNBC. b , c , Uniform manifold approximation and projection (UMAP) of the unintegrated scRNA-seq data from 427,857 cells coloured by the patients ( b ) and the main cell types ( c ). d , Dot plot showing the seven top DEGs in each cell type. e , UMAP of the unintegrated scRNA-seq data coloured by NAC response. NA, not applicable f , Bar plot showing the average cell-type percentages in patients with pCR and RD. g , h , Patient P66 Xenium data showing a dot plot of the five top DEGs in each cell type ( g ), and the haematoxylin and eosin (H&E) image with spatial locations of main cell types ( h ). Scale bar, 1,000 μm. Panel a created in BioRender; Yan, Y. https://biorender.com/zjf9vol (2026).
图2:患者层级的四种肿瘤内在分型 · PDF 第 4 页
Fig. 2: Patient-level archetypes of patients with TNBC identified from cancer cells. a , Unintegrated UMAP showing 49,275 single cancer cells that are coloured by patients ( N = 97). b , Relative expressions of top 15 marker genes across patients grouped by archetypes. BL, basal-like; IFR, interferon responsive; LSL, luminal secretory-like. c , Relative expressions of the known normal breast epithelial lineage genes from HBCA in the archetypes. d , Jaccard similarity of DEGs between archetypes and previous TNBC subtypes from bulk expression studies 7 , 9 . BLIA, basal-like immune-activated; BLIS, basal-like immune-suppressed; IM, immunomodulatory; LAR, luminal AR; M, mesenchymal; MES, mesenchymal; MSL, mesenchymal stem-like. e , Gene enrichment of the archetype signatures against the MSigDB cancer hallmark database. f , Relative expression of the known cancer genes that were differently expressed across archetypes. g , Xenium data of four representative patients for archetypes showing the H&E images, the locations of cancer cells (red dots) and the overall expression scores of archetype gene signatures in cancer cells. h , Contingency table showing the number of patients grouped by archetype and therapy response in this study (left) and the BrighTNess cohort (right). i , Multivariate Cox proportional-hazards model testing the associations between the archetype gene signature expressions and the overall survival in the METABRIC cohort. NPI, Nottingham prognostic index. j , Normalized RNA expression of clinically targetable genes across archetypes. Group-wise comparisons per gene were conducted by Wilcoxon rank-sum test and P values were adjusted for false discovery rate. Only comparisons showing adjusted P values <0.05 are labelled. CPM, counts per million. Box plots show the median (centre line), interquartile range (box limits) and 1.5× the interquartile range (whiskers). Scale bars 1,000 µm.
图3:肿瘤细胞元程序与化疗应答 · PDF 第 5 页
Fig. 3: Intra-tumoural metaprograms of cancer cells. a , Jaccard index between all ITH gene-expression programs that were grouped by metaprograms. b , Bar plot showing the number of patients in whom the metaprograms were detected. c , Relative expressions of the metaprogram marker genes across single cells in a patient example (P54). d , Xenium data in a patient example (P31) showing the H&E images, the locations of the main cell types and the in situ expressions of EPCAM with the marker genes of the M6-HLA and M5-interferon metaprograms. e , f , Box plots showing the average cellular abundance ( e ) and the average module score ( f ) of metaprograms in the comparison of pCR and RD. g , Box plot showing the normalized pseudo-bulk RNA expression of three representative genes of M7-S. h , Bar plot showing the average cell abundance of the computationally estimated cell cycling phases in patients with pCR and RD. i , Box plot comparing the percentage of cells with positive immunohistochemistry staining for Ki-67 (Wilcoxon test exact P value). j , Heatmap showing the relative gene expression of the major histocompatibility complex class I and class II genes across patients. k , Box plot showing the normalized pseudo-bulk RNA expression of three representative interferon-related genes of M5-interferon. l , Box plot showing the normalized pseudo-bulk RNA expression of three representative genes of M13-ER stress. In e , f , Wilcoxon rank-sum tests were conducted with P values adjusted by the Benjamini–Hochberg method. In g , j – l , the Wald test was conducted by DESeq2 with P values adjusted by the Benjamini–Hochberg method. Asterisks indicate adjusted P < 0.05. Box plots show the median (centre line), interquartile range (box limits) and 1.5× the interquartile range (whiskers). Scale bars, 100 μm.
图4:免疫和基质细胞状态 · PDF 第 6 页
Fig. 4: Immune and stromal cell states and their associations with NAC response. a , UMAP plot of the unintegrated scRNA-seq data showing 355,334 immune cells from 3 main cell types: myeloid cells, T/NK cells and B cells, with cell-state names and marker genes labelled. B mem -switched, switched-memory B cell; B N , naive B cell; GC-B, germinal centre B cell; mDC, mature dendritic cell; pDC, plasmacytoid dendritic cell. b – d , Cellular percentage difference in cell states of myeloid cells ( b ), T/NK cells ( c ) and B cells ( d ) in a comparison of patients with pCR and RD. e , UMAP plot of the unintegrated scRNA-seq data showing 23,248 stromal cells from 3 main cell types: fibroblast, endothelial cells and perivascular cells, with cell-state names and marker genes labelled. f – h , Cellular percentage difference in cell states of fibroblast cells ( f ), endothelial cells ( g ) and perivascular cells ( h ) in a comparison of patients with pCR and RD. In b – d and f – h , Wilcoxon rank-sum test was conducted with P values adjusted by the Benjamini–Hochberg method. Statistically significant values are coloured in red.
图5:生态型与空间生态位 · PDF 第 8 页
Fig. 5: Ecotypes and spatial niches of cancer metaprograms and TME cell states. a , Network graph showing the co-occurrences of cell identities (that is, cancer-cell metaprograms and immune and stromal cell states) denoted by nodes. Edge width denotes Spearman correlation coefficient (SCC) of cellular percentages of two connected nodes among patients. b , c , Relative co-occurrence of cell identities across archetypes ( b ) and response groups ( c ). Edge width denotes the geometric mean of the averaged z -score cellular percentages of the two connected nodes. Only edges with non-zero widths are shown. d , Heatmap showing the relative abundance of cell identities across the ten spatial niches N1 to N10. The hierarchical clustering tree of niches (columns) was built on the basis of the CellTrek’s spatial colocalization result. e , Bar plot showing the number of patients in which the spatial niches were detected. f , Bar plot showing the Pearson residuals of the chi-squared test between the number of cells assigned to ecotypes and niches. g , Xenium data in two patient examples (P56, P90) showing H&E images, spatial niches and the locations of four expanded windows (W1–W4). h – k , Xenium data of the expanded windows W1–W4 showing H&E images, spatial niches and cell identities together with the bar plot of cell counts within the spatial niche examples for the niche N2 ( h ), N9 ( i ), N4 ( j ) and N8 ( k ). Scale bars, 100 μm.
完整阅读记录与证据表
文献卡:Ecotypes of triple-negative breast cancer in response to chemotherapy
- Paper ID:p-0037-art-ecotypes-triple-negative-breast-cancer
- 分析日期:2026-10-26;晨会:2026-10-27。
- Skill:article-read、morning-report、pdf、spreadsheets、web-publish。
- 读取范围:36页主PDF的正文、方法、5主图、10扩展图及图注;末3页报告规范说明视觉核对。官方补表ZIP及报告规范PDF已归档;9份XLSX全部读入,逐人平台/应答及关键细胞数独立清点,基因长表按范围核查。具体见coverage.md。
- 人工核对:pending;processing_status=analyzed表示上述科研解读完成,不表示重跑单细胞管线。
- 图表:18 PNG(5主图、10扩展图、3页扫描报告);网页5主图。完整清单、跨页图注及长表例外见figures/README.md。
一句话结论
治疗前TNBC的癌细胞内在程序、髓系细胞状态及空间生态结构与化疗应答相关;研究将患者层级分型与肿瘤内细胞状态分开解析,为候选标志物及后续功能研究提供了结构化线索。
研究问题与背景
整块组织转录组的“免疫”“基底样”等签名可能混合不同细胞来源。本研究以癌细胞本身建立archetype,以细胞状态建立共现生态型,再用空间转录组检查局部组织结构,分析治疗前异质性与新辅助化疗应答的关联。
贡献与比较对象
对照包括pCR与RD、正常乳腺HBCA参照、不同患者内在分型以及外部临床队列。这里的主要贡献是细胞来源与空间组织分辨率;没有进行生态型靶向干预或新药随机比较。
方法与验证
ARTEMIS中108名患者提供治疗前活检;101人scRNA,46人至少一种空间平台,44人Xenium,单细胞与空间重叠39人(补表1重算)。应答已知89人,其中pCR50、RD39;19名中期反应欠佳后改用靶向方案者未纳入NAC应答比较。癌细胞可分析97人,图2h应答子集79人。ER/PR低表达患者可按本研究定义纳入TNBC。
CopyKAT结合表达谱识别非整倍体癌细胞;癌细胞pseudo-bulk经NMF建立archetype,各患者癌细胞中的重复表达程序合并为metaprogram。免疫/基质状态由分群及标记基因注释,共现网络基于患者间细胞频率的Spearman相关;空间邻域采用30 μm半径局部组成。CellChat预测配体–受体联系,功能未干预。频率差异主要按图注的Wilcoxon秩和检验及BH校正解释;方法第14页泛述中有signed-rank用语,与独立组图注的rank-sum表述不同,保留原文口径。
核心证据
| 主张或结果 | 数字、单位、条件 | PDF页序/图表 | 依据类型 | 核对情况 |
|---|---|---|---|---|
| 主数据规模 | 101人、427,857细胞;97人有49,275癌细胞 | 主PDF2–4;补表2第4–104行 | 正文/原表/重算 | 两项细胞总数独立求和一致 |
| 空间样本口径 | Visium7、VisiumHD13、Xenium44;三平台并集46,和scRNA交集39 | 主PDF2–3;补表1 D4:Q111中的对应平台列 | 正文/原表/重算 | 逐人布尔平台记录清点;正文“46 matched”出入保留 |
| 应答人群 | 108人中pCR50、RD39、NA19;改靶向治疗者不参与NAC比较 | 主PDF2、11;补表1 B4:C111 | 正文/原表 | NA与真实RD分别记录 |
| 四种archetype | ARC1/2/3/4人数23/32/28/14;有应答者pCR/RD=9/9、11/18、21/4、4/3 | 主PDF3–4,图2b/h;补表1 | 图表/原表 | 79人应答子集独立计数一致 |
| 分型与应答 | 总体χ²,本队列P=.0071;BrighTNess P=.024 | 主PDF3;图2h、扩展2k | 正文/图表 | 未改写为单分型随机治疗获益 |
| 分型连续性 | 77/97由一型主导;20/97混合 | 主PDF3;扩展2f | 正文/图表 | 配合连续表达解释 |
| M5/M7/M13 | pCR组细胞比例及模块评分均较高,BH q<.05 | 主PDF3–5;图3e–f | 正文/图表 | 子图与两种读出分别对应 |
| M6 HLA | 比例P=.126、q=.329;模块评分P=.00364、q=.0158 | 主PDF5,图3e–f | 原图 | 未将表达增强写成细胞比例显著增加 |
| HLA与细胞周期 | HLA-II在pCR较高;Ki-67 P=.0078 | 主PDF5,图3d、g–l | 正文/原图 | HLA-I与HLA-II区分 |
| 髓系及基质状态 | Mac-IFN/C1Q偏pCR;CCL/CXCL/ECM、髓系增殖偏RD;Peri-immune偏pCR、TEC偏RD | 主PDF6–7,图4 | 正文/原图 | 分具体状态,不概括为巨噬细胞总量决定应答 |
| T/NK与B细胞 | T/NK差异校正后q>.05;B状态q>.05 | 主PDF7,图4c–d | 正文/原图 | 阴性统计结果保留 |
| 生态与空间 | 8 ecotype、10 niche;N2/8、N9/6、N4/3局部对应;N8跨多个ecotype | 主PDF7–8,图5;扩展8–9 | 正文/原图 | 共现与空间共定位区分 |
| 细胞频率模型 | 70/30训练测试;扩展图10b Logreg训练AUC .797、测试.883 | 主PDF16、32–33 | 方法/原图 | 正文第8页另写平均.84,未统一成单一性能数值 |
| 13基因模型 | 13基因+截距;I-SPY2 P=.0018、BrighTNess P=.034;外部风险分数与应答相关 | 主PDF9、16、32–33;补表9 A3:C17 | 正文/原图/原表 | 不与细胞频率AUC混用;未重训模型 |
局限与待解问题
作者明确指出
活检、消化和微滴平台使基质细胞相对不足;当前以治疗前样本为主,应继续研究纵向演化和化疗免疫联合背景。模型临床转化需要前瞻性验证。
AI推断与理由
- 改用靶向方案的19人未进入应答比较,反应分析存在治疗路径选择;需要确认独立队列中是否仍稳定。
- 共现网络、局部空间邻域及配体–受体推断构成相关证据链;特定细胞组合的必要性或可干预性需扰动实验。
- 模型特征筛选、训练/测试与外部bulk应用分别记录,未从显著风险分数差异推算未报告的外部AUC、校准或净获益。
- LumSec样表达与潜在细胞起源的联系为作者的生物学推断,本文没有谱系追踪;靶点表达同样不能代替药物疗效实验。
- 原文内空间配对人数与AUC口径出入见sources/checks.md;保留统计读出的层级,不用风格精简抹去差别。
待核对问题与后续阅读
- 患者级的临床样本数及细胞数已经复算;单细胞原始读段、CopyKAT/NMF/空间邻域和生存模型未重跑。
- 补表5及8为较长的基因结果表,保留原始文件,检查结构、分型/细胞状态及引用基因,没有逐项验证所有差异分析。
- 原文参考文献中的研究只作转述定位,不计为本次已精读的原文。继续追读可围绕HBCA正常参照和既往TNBC bulk分型进行。