研究问题
硬脑膜转移位于颅骨与脑表面之间,毗邻骨、血管和脑膜淋巴管。本文研究破骨细胞是否通过改变这一局部结构,影响抗肿瘤免疫。
研究对象是硬脑膜转移(DM)。脑实质转移(BM)和软脑膜转移(LM)用于影像或动物模型对照,三者的解剖位置和微环境需要分别理解。
研究设计
| 层次 | 对象与方法 | 解决的问题 |
|---|---|---|
| 临床影像 | 脑膜瘤14例、BM 20例、LM 15例、DM 14例;转移病例原发于乳腺或肺 | DM是否具有邻近颅骨改变 |
| 动物模型 | 4T1乳腺癌及LLC肺癌衍生的DM模型;与非肿瘤、LM等比较 | 颅骨、脑膜淋巴管和免疫微环境的联系 |
| 引流检测 | 脑池注入示踪物,1小时后检测颈深淋巴结;结合活体双光子成像 | 区分管道形态与实际引流功能 |
| 因果干预 | 唑来膦酸、CD8⁺ T细胞耗竭、颈深淋巴结输入淋巴管结扎、ANG2回补及Angpt2敲低 | 检验破骨细胞、淋巴引流、T细胞与ANG2的作用环节 |
颅骨改变伴随局部淋巴功能受损
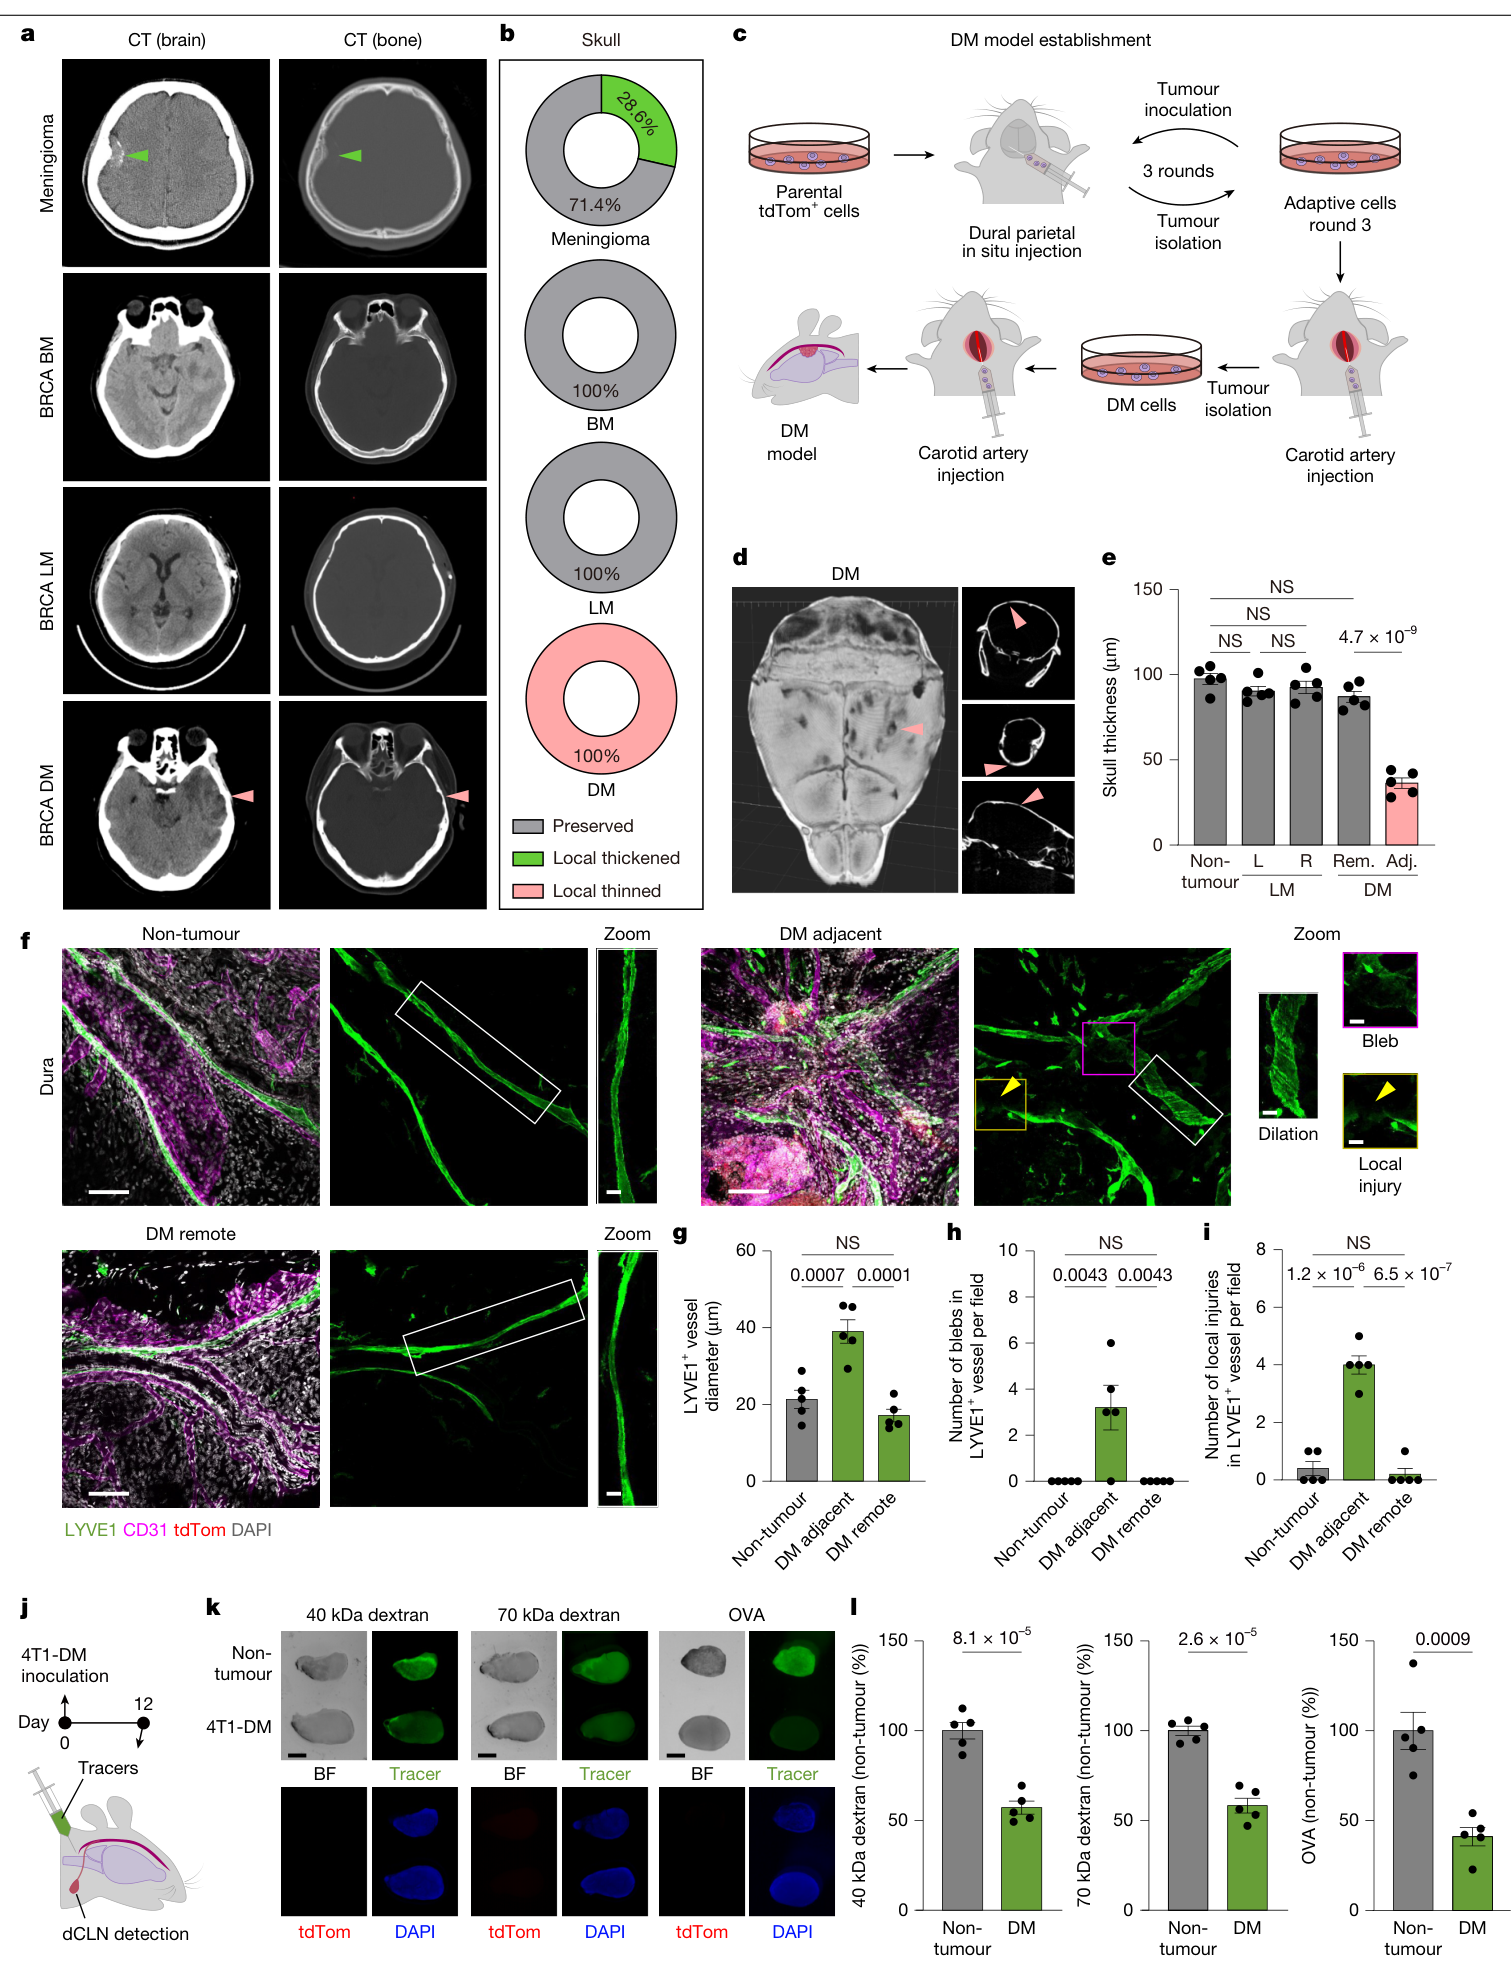
这组临床影像资料中,14例DM均有病灶邻近颅骨变薄或侵蚀;BM和LM病例没有相同的骨溶解模式,脑膜瘤中部分病例表现为骨质增生。这是该病例集合内的影像关联。(图1a、b;扩展图1;补表1)
作者通过局部适应与血行筛选获得DM倾向的肿瘤细胞。4T1-DM小鼠病灶附近出现颅骨变薄,而远端区域及LM对照未出现同样变化。(图1c–e)
脑膜淋巴管的异常主要表现为管腔扩张、局部膨出和局部损伤;基线LYVE1⁺管道面积未见显著差别。活体成像复现了这些形态异常。更直接的功能证据来自示踪实验:脑池注入40或70 kDa葡聚糖、荧光标记OVA后,DM小鼠颈深淋巴结中的信号减少,提示引流受损。(图1f–l;扩展图2,主要定量每组5只小鼠)
T细胞数量增加,同时出现耗竭相关表型
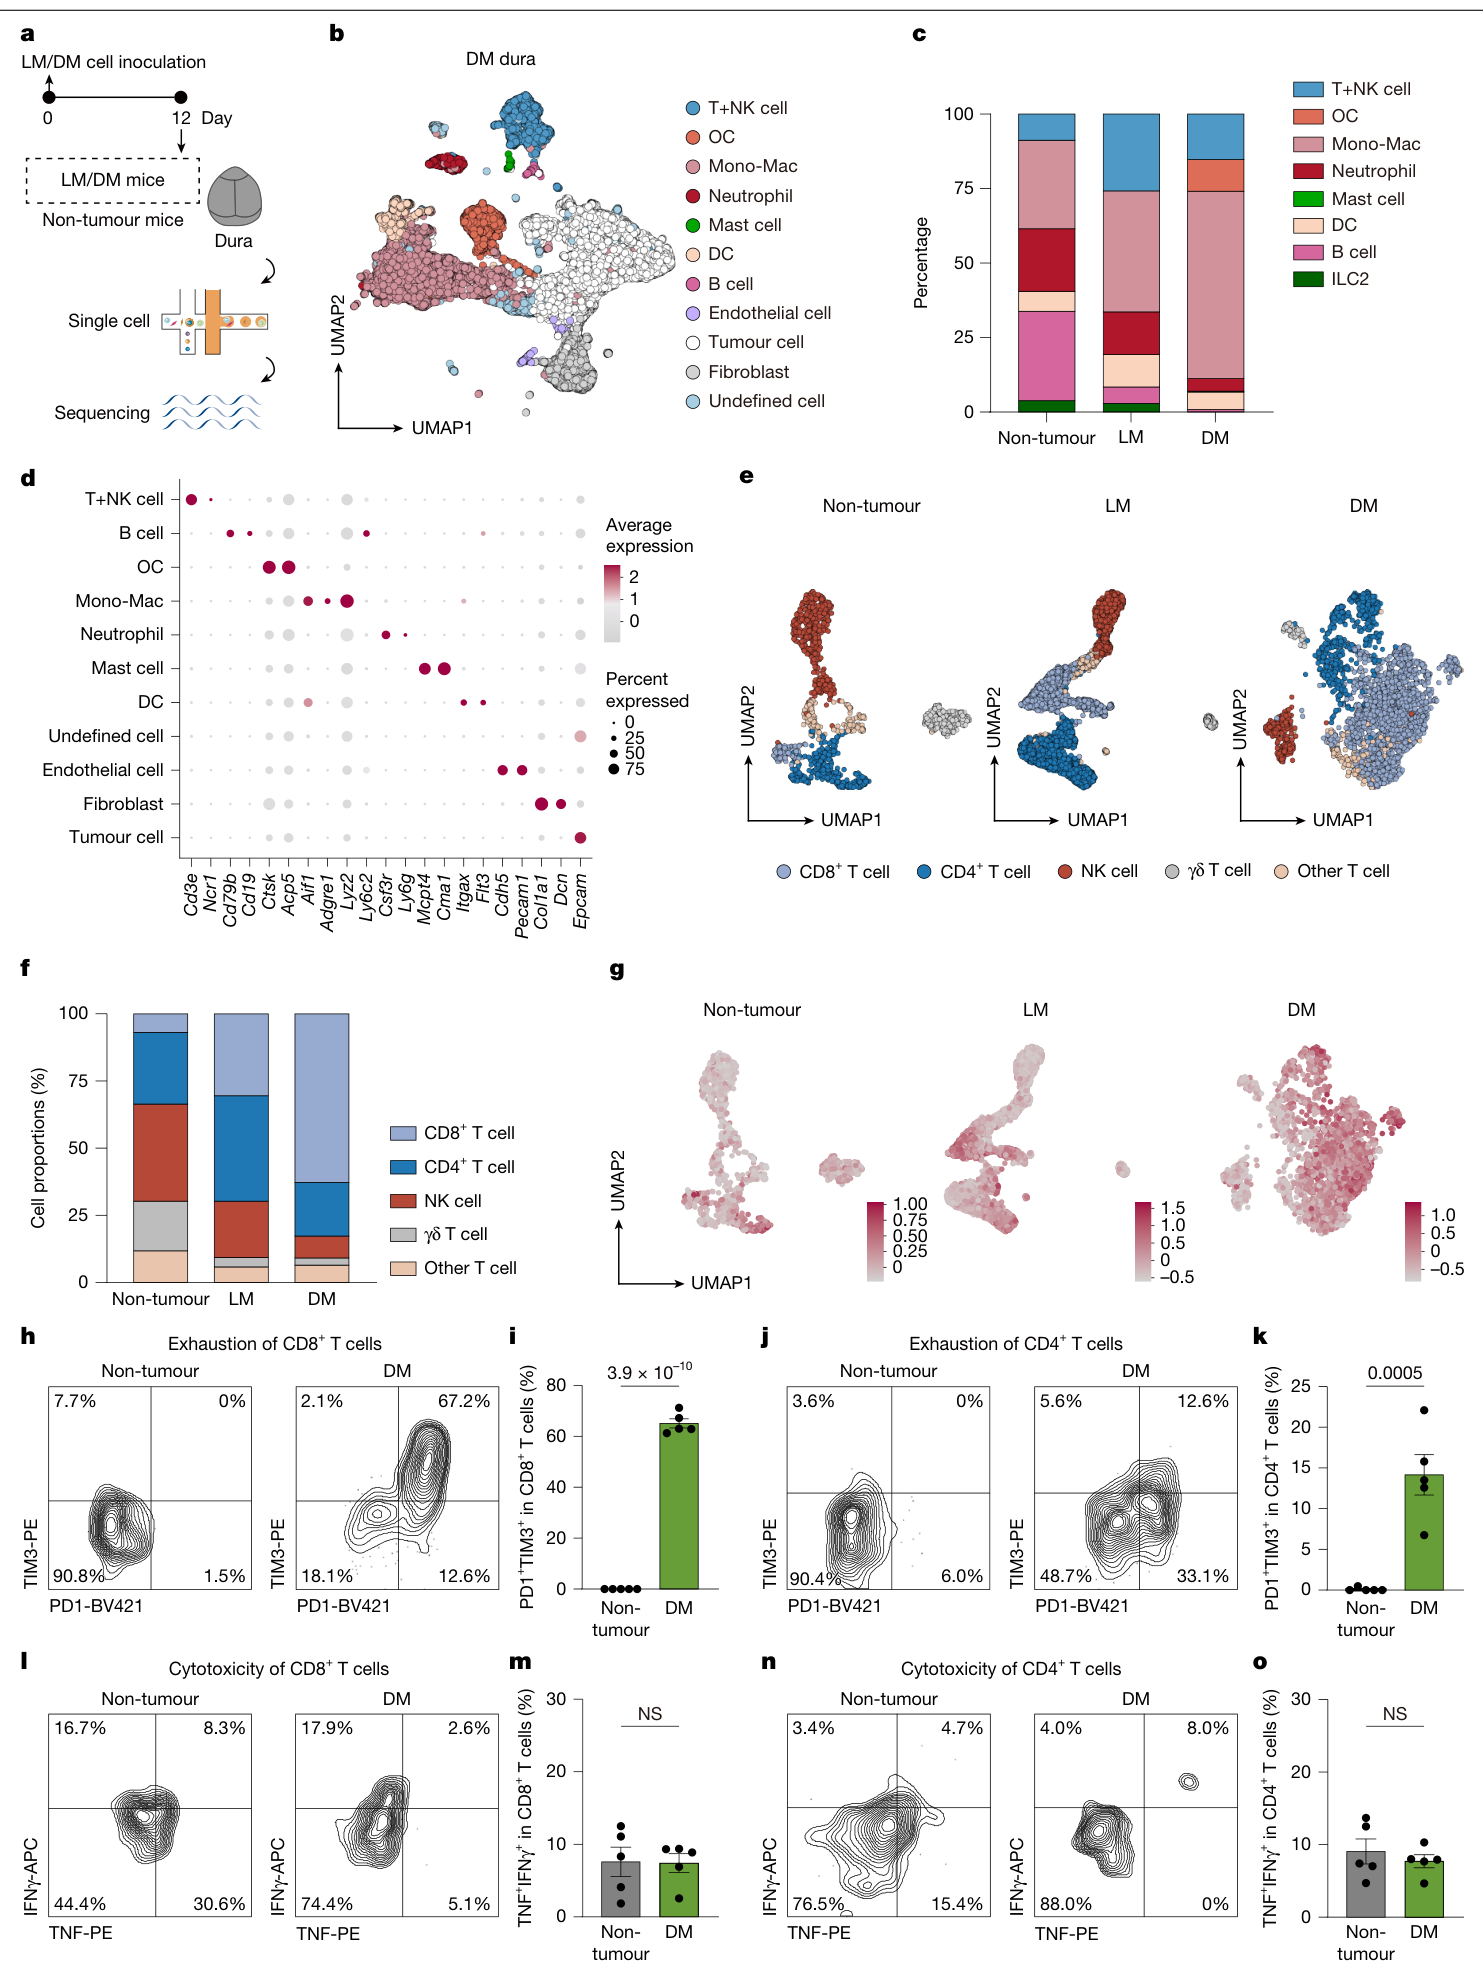
单细胞分析比较非肿瘤、LM与DM硬脑膜。每组有3份独立混合样本,每份由6只小鼠的硬脑膜组成。DM微环境中出现破骨细胞群,并有明显的髓系及T细胞重塑。(图2a–d)
DM组CD8⁺ T细胞约占T+NK细胞的62.8%,高于LM的30.6%和非肿瘤组的7.0%;这里的分母是T+NK细胞。流式检测及耗竭相关基因评分显示PD1、TIM3等信号增加。(图2e–k)
与此同时,离体刺激后能共同产生IFNγ和TNF的CD8⁺ T细胞比例,DM组与非肿瘤对照相比未显著提高。作者据此将数量扩张、检查点上调与效应功能未同步增强联系起来,描述为耗竭相关状态。(图2l–o;扩展图5、6)
破骨细胞干预的效应依赖CD8⁺ T细胞与淋巴引流
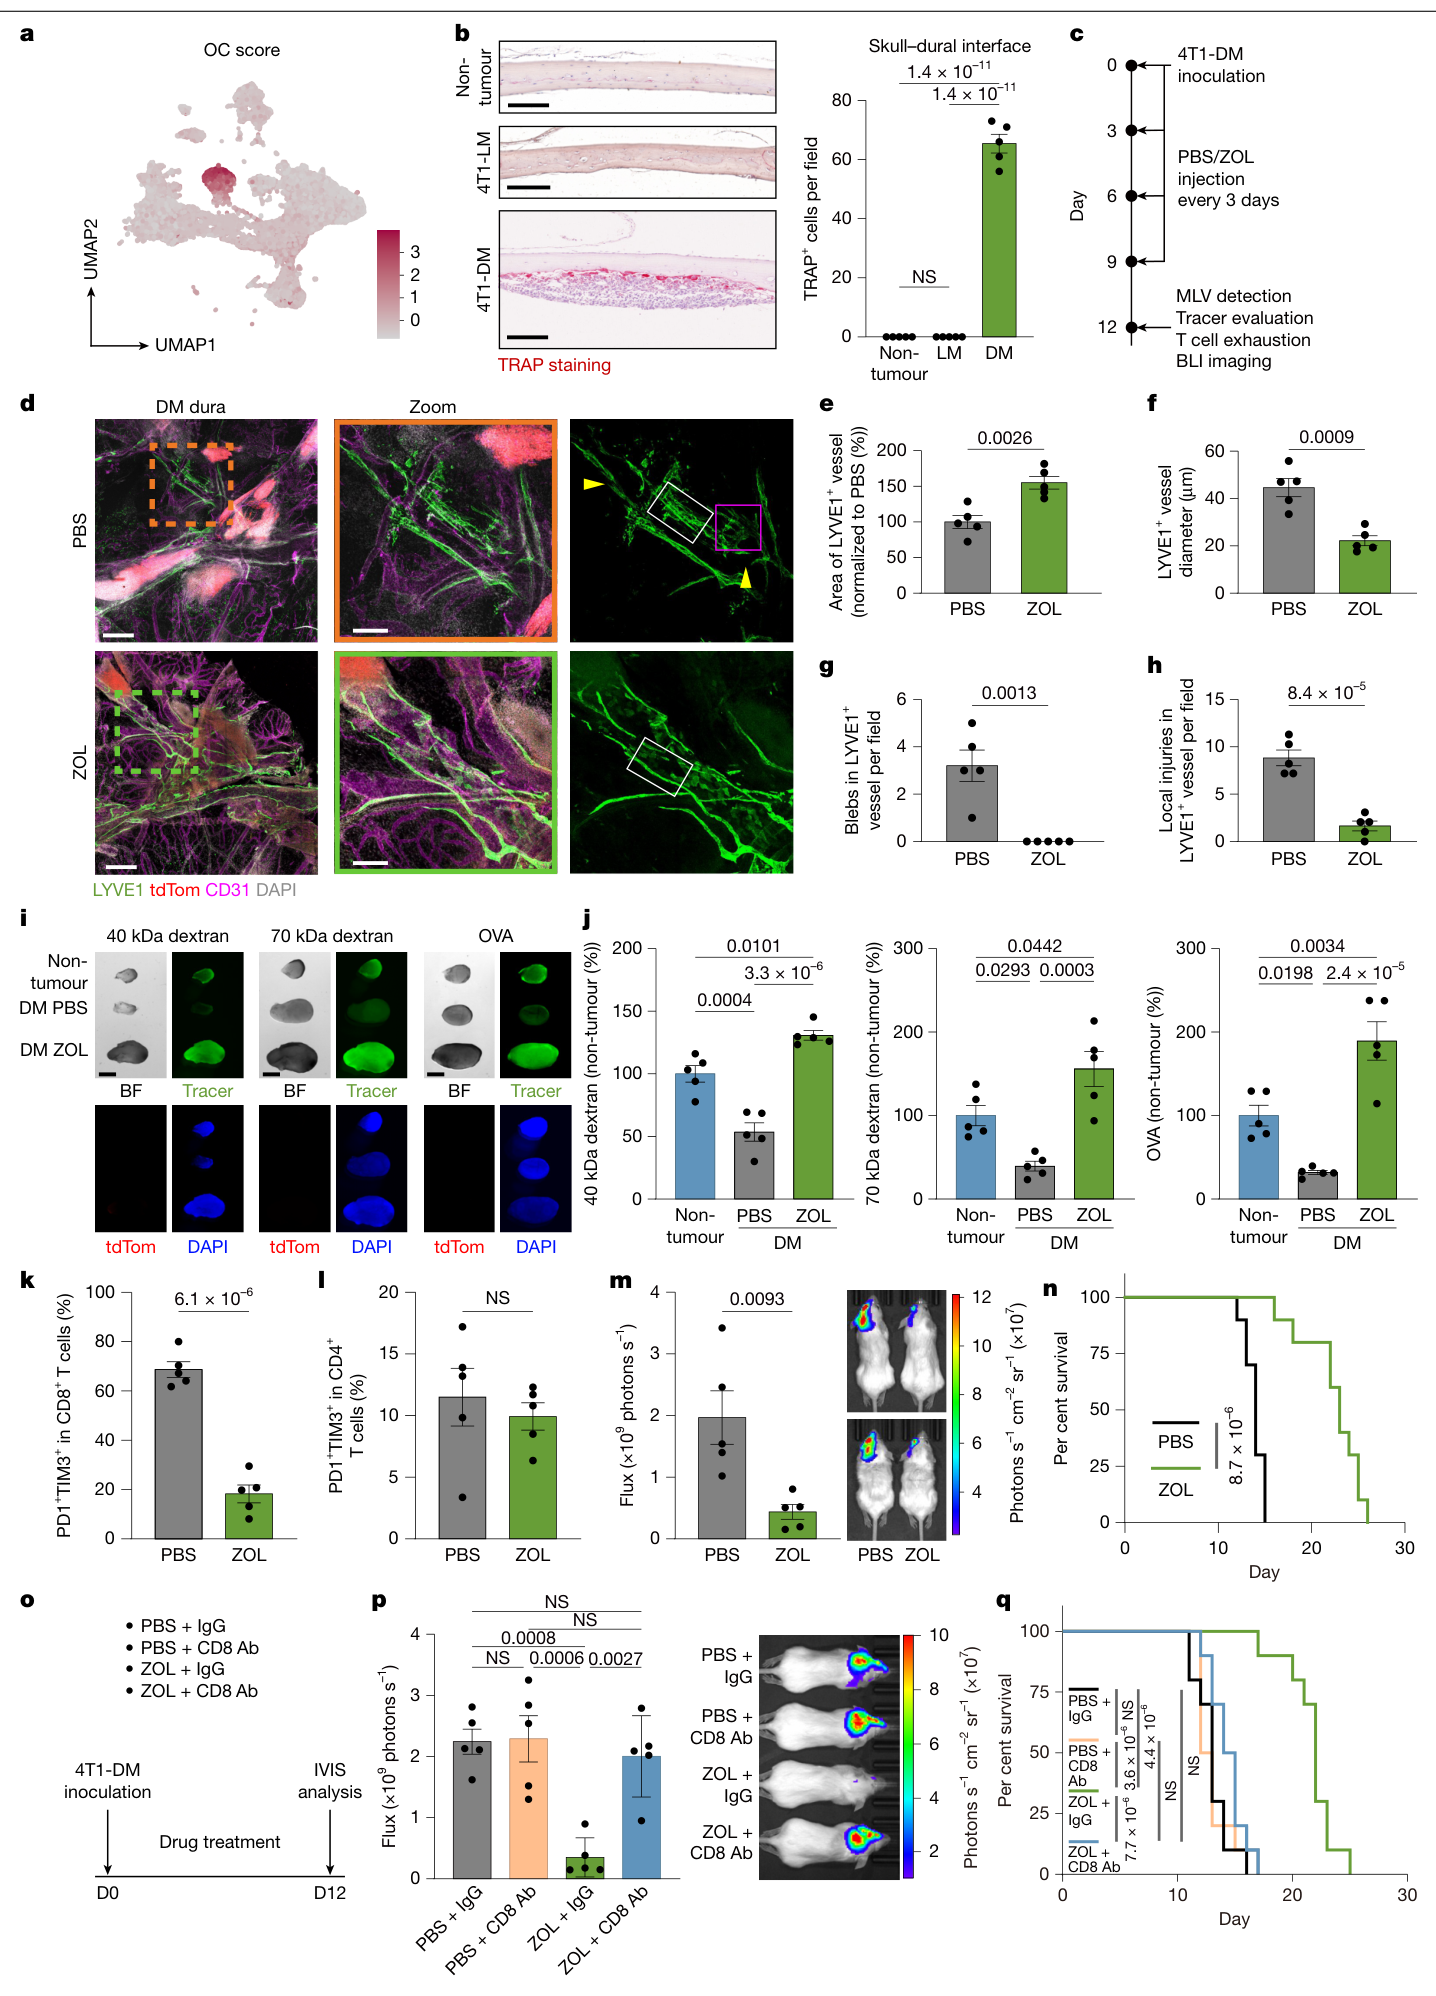
唑来膦酸(ZOL)减少病灶中的TRAP⁺细胞及骨吸收相关改变,改善脑膜淋巴管形态,并提高示踪物到达颈深淋巴结的信号。硬脑膜CD8⁺ T细胞中PD1⁺TIM3⁺比例降低,肿瘤负荷下降,生存延长。(图3;扩展图7、8)
这组治疗从肿瘤接种当天开始,ZOL剂量为100 μg/kg、每3天给药,主要结构与免疫检测在第12天进行。图3的多数定量每组5只小鼠,生存比较每组10只,来自两次实验。(PDF第6–7、15页)
作者进一步做了两项必要性检验:
- 耗竭CD8⁺ T细胞后,ZOL的肿瘤控制和生存优势消失。(图3o–q)
- 结扎颈深淋巴结的输入淋巴管后,ZOL的肿瘤控制优势消失;结扎单独处理未显著改变该实验的肿瘤进展。(扩展图8g、h)
这两组结果支持:ZOL在该模型中的效应涉及恢复淋巴引流和CD8⁺ T细胞介导的抗肿瘤反应。
界面破骨细胞与瘤内TRAP⁺细胞的动态联系
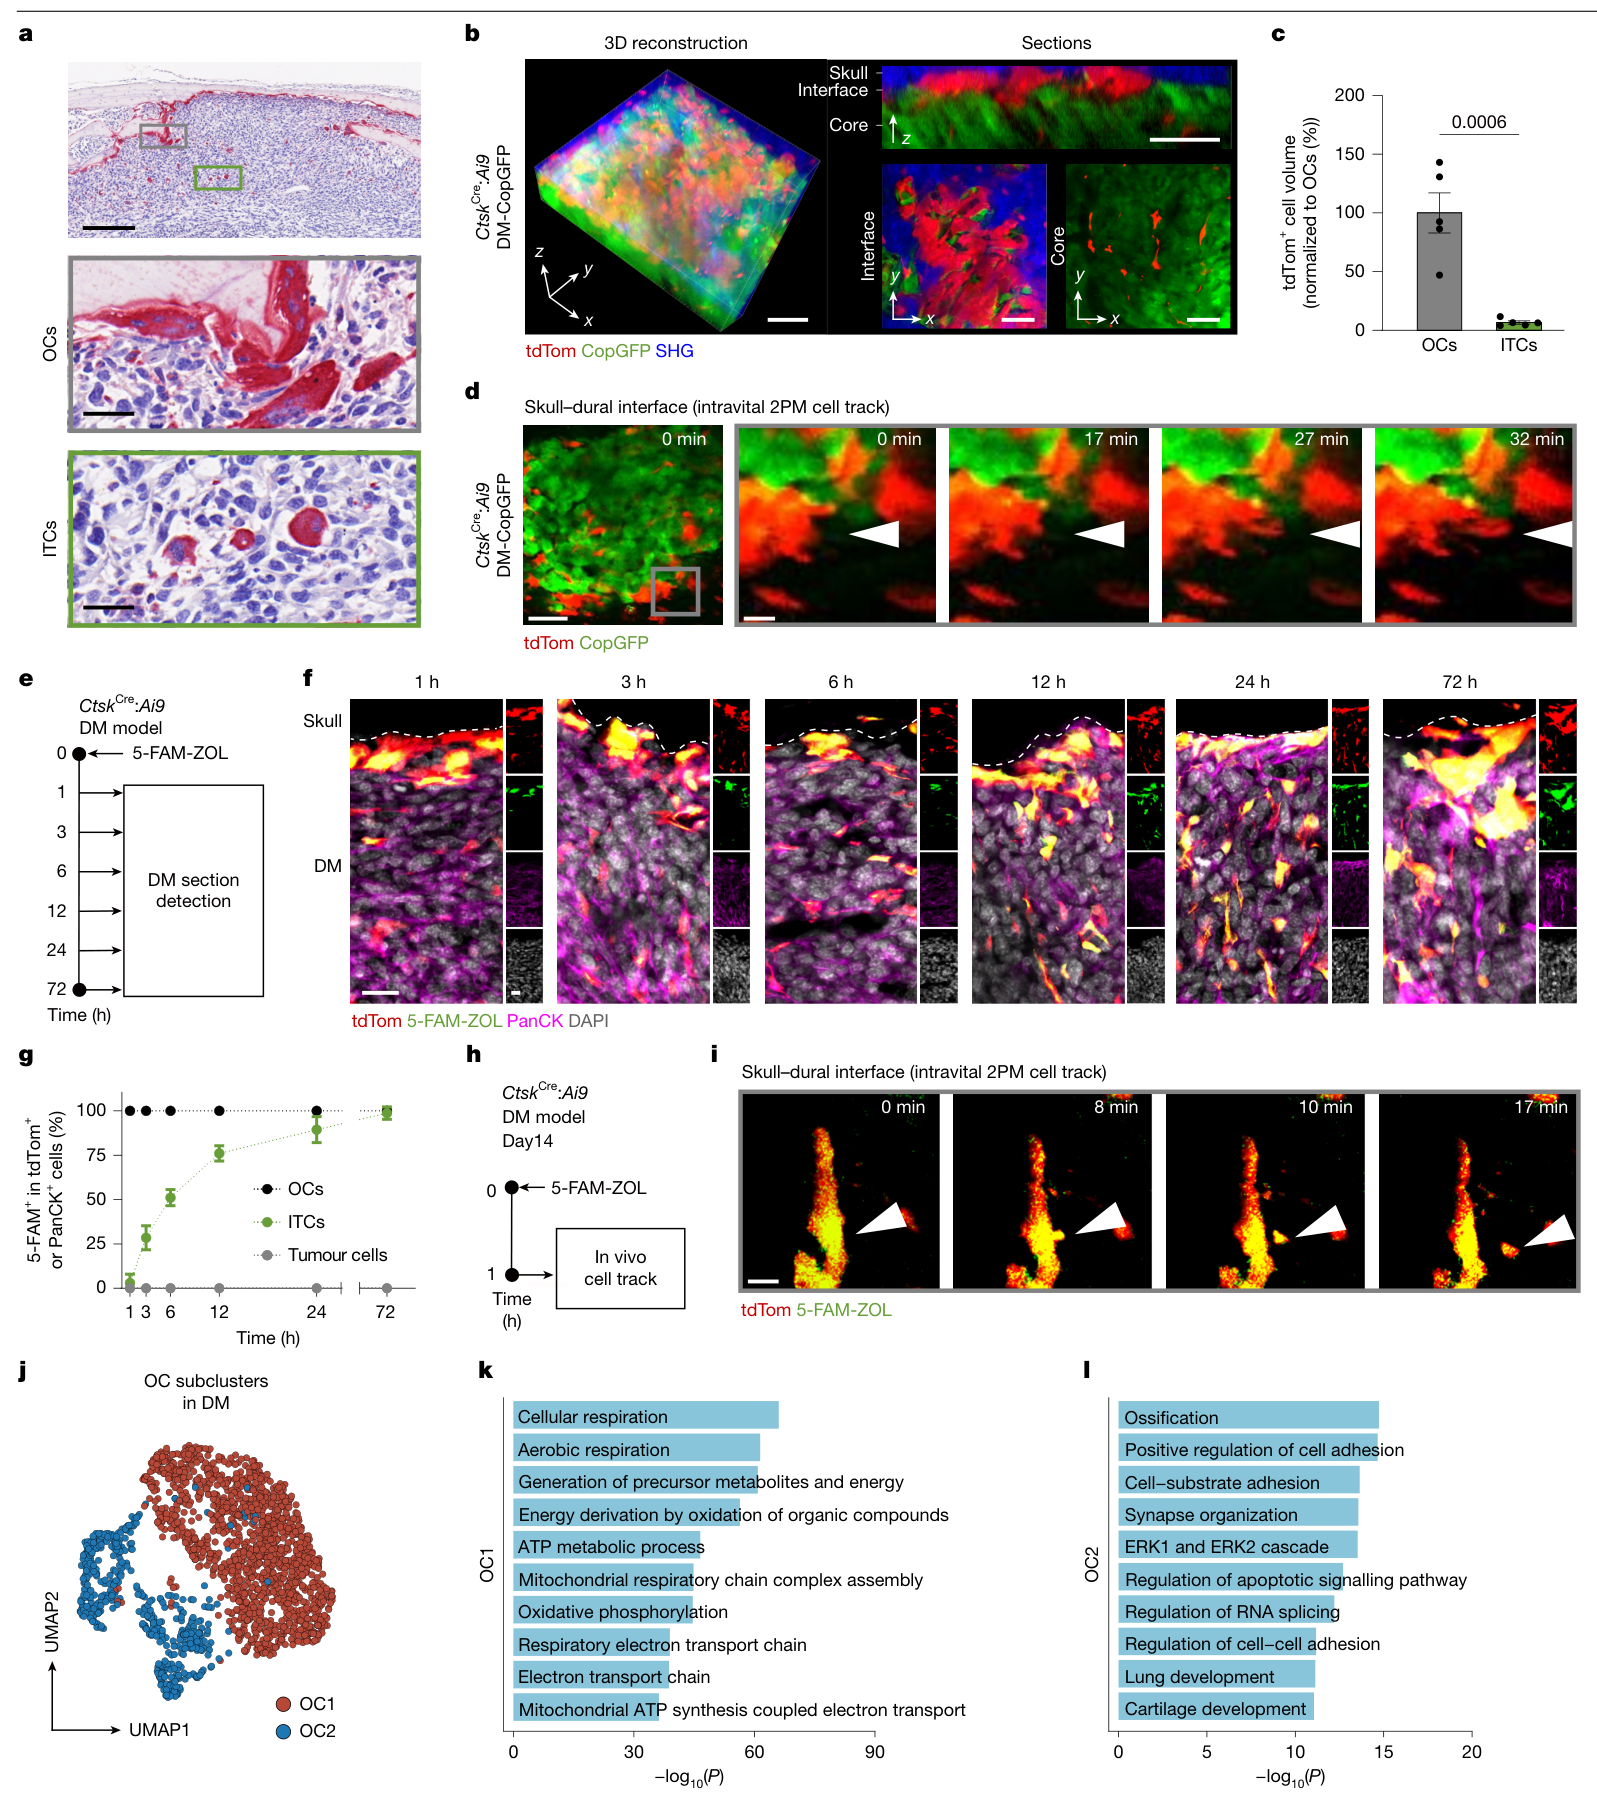
组织中可见两类形态:颅骨—肿瘤界面的较大多核破骨细胞,以及肿瘤内部较小的TRAP⁺细胞(ITC)。作者结合CtskCre谱系标记、活体双光子成像和骨表面摄取的5-FAM-ZOL示踪,观察到界面细胞分离出较小细胞的过程;随后标记逐渐出现在ITC中。(图4a–i;补充视频1)
这些结果支持至少部分ITC与界面破骨细胞存在来源联系。单细胞分析另外划分了OC1、OC2两种转录状态,分别富集不同代谢、RNA处理或凋亡相关过程;形态上的OC/ITC与转录上的OC1/OC2尚未建立一一对应关系。(图4j–l;扩展图9;PDF第9页讨论)
ANG2参与淋巴功能受损
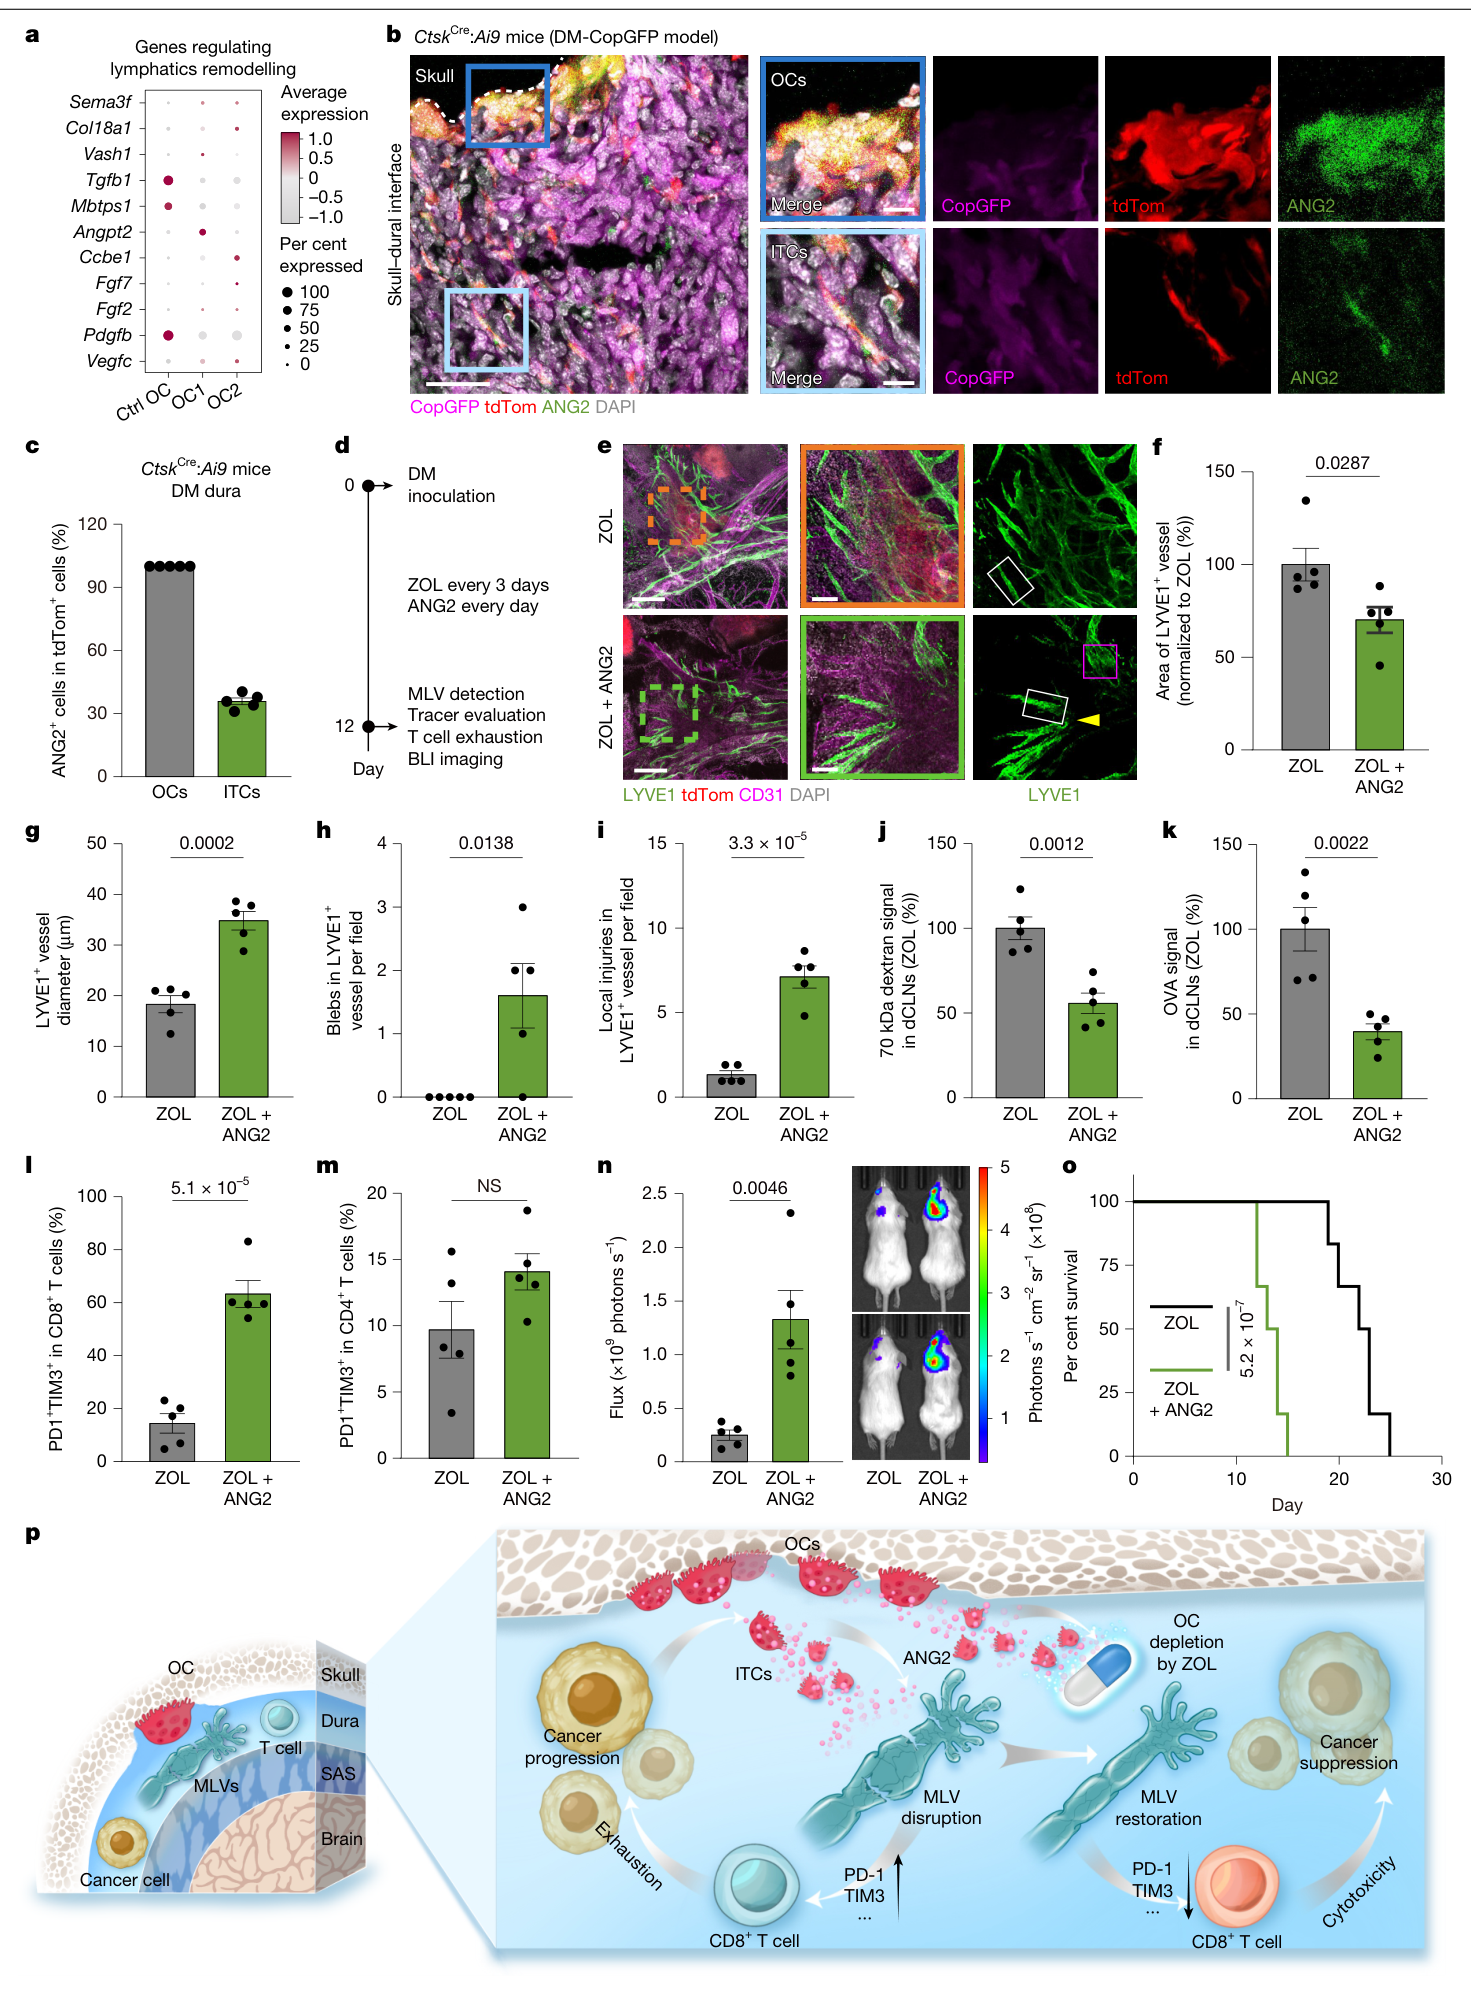
作者从淋巴重塑候选基因中关注Angpt2和Pdgfb。在ZOL处理背景下补充PDGF-BB,未显著改变引流或肿瘤进展;补充ANG2则削弱ZOL带来的结构和引流改善,增加CD8⁺ T细胞PD1⁺TIM3⁺比例,并加快肿瘤生长、缩短生存。(图5;扩展图10、11、13)
ANG2在DM相关破骨细胞中表达较高,蛋白染色在全部所观察的界面OC及约35.9%的ITC中呈阳性。进一步使用Ctsk启动子驱动的两条Angpt2 shRNA,在谱系报告模型中检验敲低效果;4T1-DM中的引流和治疗终点也得到改善。(图5b、c;扩展图12,PDF第35–36页)
这一结果使ANG2超越了表达相关候选,获得回补与基因敲低的功能支持。淋巴内皮细胞RNA-seq还提示,ANG2回补后核苷酸代谢相关通路下调;这是转录层面的机制线索,代谢通量及其对管道功能的因果作用仍待验证。(扩展图13;补表6、7)
局限与待解问题
- 临床部分是63例的影像比较,未直接建立患者中的破骨细胞—ANG2—淋巴功能因果链;14例DM的骨改变也需要更大、独立病例集评估。
- 模型经过细胞适应和血行筛选,主要干预在接种当天或早期开始。自然转移全过程、晚期已形成病灶及其他原发癌种的治疗效果仍待检验。
- ZOL和Ctsk驱动的干预各有作用范围限制。作者用标记物和示踪提高了细胞身份判定的可靠性,仍需要更严格的时空特异遗传模型;ITC的其他来源及其独立功能尚未明确。
- ANG2也可能作用于脑膜血管,少数其他细胞亦可表达Angpt2。本文尚未完整定位淋巴内皮受体、下游信号,以及免疫改善中各条路径的相对贡献。
- 耗竭相关标志物、细胞因子和必要性实验共同支持免疫参与;抗原特异性启动、细胞迁移与耗竭程序之间的连续过程仍缺少直接追踪。免疫检查点抑制剂联合治疗及患者疗效需要另行研究。
- 单细胞样本存在混样,需保留样本层级;多数实验样本量较小,报告规范说明中的盲法主要限于图像统计。
新线索
本文把颅骨侧的破骨细胞活动与脑膜淋巴引流、局部免疫状态联系起来。由此可提出一个待验证方向:影像上的骨侵蚀是否能提示某种局部免疫微环境,并帮助寻找需要恢复引流的病灶。建立这一联系仍需患者组织、淋巴功能与免疫表型的配对证据。
相关原始研究:VEGF-C-driven lymphatic drainage enables immunosurveillance of brain tumours,Nature,2020。该研究承接脑膜引流与肿瘤免疫问题;本次核实题名及摘要,未独立全文精读。
主图与表格 · 5 张
图1:颅骨改变与淋巴引流 · PDF 第 2 页
Fig. 1 | Distinct skull erosion and impaired MLVs in DM. a, Cranium CT from patients with meningioma (n = 14 patients), breast cancer BM (BRCA BM, n = 10 patients), breast cancer LM (BRCA LM, n = 7 patients) and breast cancer DM (BRCA DM, n = 8 patients). Skull thickening and thinning are indicated by green and pink arrowheads, respectively. b, Ratios of local thickened, preserved or local thinned skull in areas related to those in a and Extended Data Fig. 1d. c, Screening strategy for DM. d, 3D reconstruction and two-dimensional (2D) sections of CT scans showing cranium from 4T1-DM mice. Pink arrowheads indicate the same site of skull bone thinning in both 3D and 2D images. e, Statistics of skull thickness related to images in d and Extended Data Fig. 1g; n = 5 mice per group. L, left; R, right; Rem., remote to lesion; Adj., adjacent to lesion. f, Dura from non-tumour and 4T1-DM mice. Stained for LYVE1, CD31 and 4′,6-diamidino-2-phenylindole (DAPI). tdTom, tdTomato+ tumour cells. Dilations, blebs and local injuries were marked with white, magenta and yellow rectangles or arrowheads, respectively, and the boxed areas are shown magnified on the right of the images (Zoom). g–i, Statistics of diameters (g), blebs (h) and local injuries (i); n = 5 mice per group. j, Experimental design of MLV drainage evaluation. k, Whole-mount images of dCLNs from j. Blue, DAPI; BF, bright field; green, tracers; Red, tdTomato+ tumour cells; n = 5 mice per group. OVA, OVA-AF488. l, Statistics from k. Data were normalized to non-tumour controls; n = 5 mice per group. Data represent means ± s.e.m. Statistics were performed using one-way analysis of variance (ANOVA) with Tukey’s multiple comparison test (e,g,h,i) or two-sided unpaired t-test (l). NS, not significant. Scale bars, 100 μm (f, large images), 25 μm (f, inset) and 2 mm (k).
图2:硬脑膜转移的T细胞状态 · PDF 第 4 页
Fig. 2 | scRNA-seq analysis reveals T cell exhaustion in DM. a, Experimental set-up of scRNA-seq of dura maters from non-tumour, 4T1-LM and 4T1-DM mice; n = 3 samples per group (each sample contains mixture of dura maters from six mice). b, Uniform manifold approximation and projection (UMAP) visualization of colour-coded clusters based on manually annotated cell types and cells aggregated from samples in 4T1-DM mice. c, Proportions of immune cell populations of dura maters from scRNA-seq data of non-tumour (Extended Data Fig. 3a), 4T1-LM (Extended Data Fig. 3c) or 4T1-DM mice (from b). d, Dot plot depicting the expression of marker genes across all clusters from scRNA- seq data of DM cells in b. e, UMAP of re-clustered T+NK cells from dura maters of non-tumour (Extended Data Fig. 3a), 4T1-LM (Extended Data Fig. 3c) and 4T1-DM (from b) mice. f, Proportions of T+NK cell subsets from e. g, UMAP of exhaustion score (based on Pdcd1, Ctla4, Tigit, Lag3 and Havcr2) in T cells of non-tumour, 4T1-LM and 4T1-DM mice. h,j, Flow cytometry of CD8+ (h) and CD4+ (j) T cells in non-tumour dura and dura maters from 4T1-DM mice, showing the PD1- and TIM3-expressing cells. PE, phycoerythrin; BV421, brilliant violet (BV) 421. i,k, Statistics of data from h (i) and j (k); n = 5 mice per group, from three independent experiments. l,n, Flow cytometry of CD8+ (l) and CD4+ (n) T cells in non-tumour dura and dura maters from 4T1-DM mice, showing TNF- and IFNγ- expressing cells. m,o, Statistics of data from l (m) and n (o); n = 5 mice per group, from three independent experiments. Data represent means ± s.e.m. Two-sided unpaired t-test (i,k,m,o).
图3:破骨细胞干预及必要性检验 · PDF 第 6 页
Fig. 3 | Targeting OCs rescues MLV drainage and decreases dural T cell exhaustion. a, OC score (Ctsk, Acp5, Nfatc1, Mmp9 and Atp6v0d2) of Fig. 2b. b, TRAP staining of coronal head sections. Statistics of TRAP+ cells per field; n = 5 mice per group. c, Experimental set-up of d–n. d, Dura from c. The boxed areas in the left column are shown enlarged in the central and right columns. Dilations, blebs and local injuries are marked with white, magenta and yellow rectangles or arrowheads, respectively. e, Statistics of LYVE1+ area from d; n = 5 mice per group. f–h, Statistics of diameter (f), bleb (g) and local injuries (h) from d; n = 5 mice per group. i, The dCLNs from mice in c. Stained as in Fig. 1k. j, Statistics of tracer signals from i. Data were normalized to non-tumour mice; n = 5 mice per group. k,l, Statistics of PD1+TIM3+ in dural CD8+ (k) and CD4+ (l) T cells of c; n = 5 mice per group, from three independent experiments. Related to Extended Data Fig. 8f. m, Left, tumour growth from mice in c; right, BLI images; n = 5 mice per group, from three independent experiments. sr, steradian. n, Survival of mice in c; n = 10 mice per group, from two independent experiments. o, Experimental set-up of p and q. Ab, antibody; IVIS, in vivo imaging system. p, Left, tumour growth in o; right, BLI image, n = 5 mice per group, from three independent experiments. q, Survival of mice in o; n = 10 per group, from two independent experiments. Data represent means ± s.e.m. Two-sided unpaired t-test (e–h,k–m), one-way ANOVA with Tukey’s multiple comparison test (b,j,p) and log-rank test (n,q). Scale bars, 100 μm (b), 500 μm (d, left column), 200 μm (d, middle column) and 2 mm (i).
图4:破骨细胞与ITC动态示踪 · PDF 第 8 页
Fig. 4 | Dynamic tracing reveals two distinctive and inter-related subsets of OCs in DM. a, TRAP staining (red) of coronal head section in 4T1-DM model, from three independent experiments. Top, DM section; middle and bottom, expansion of areas boxed in grey and green in top panel, showing OCs and ITCs, respectively. b, Images showing 3D reconstruction and 2D sections of skull– dural interface from LLC-DM-CopGFP CtskCre:Ai9 mice. SHG, second harmonic generation. c, Statistics of cell volume of tdTomato+ OCs and ITCs from b; n = 5 mice per group. d, Intravital two-photon microscopy (2PM) images (left, baseline; right panels, time-lapse series) of tumour lesion showing tdTomato+ OCs in the LLC-DM-CopGFP model of CtskCre:Ai9 mice. e, Experimental set-up related to f and g. CtskCre:Ai9 mice were injected intravenously with 5-FAM- ZOL at 1, 3, 6, 12, 24 and 72 h before being euthanized. DM sections were obtained on day 12 after LLC-DM inoculation for immunofluorescence staining. f, Skull–dural interface from e. Dashed line, skull edge. g, Curve chart showing the variation of proportion of 5-FAM-ZOL+ cells in tdTomato+ OCs/ITCs or PanCK+ tumour cells from f. n = 5 mice. h, Experimental set-up for i. i, Intravital time-lapse 2-photon microscopy images (left, baseline; right panels, time- lapse series) of tumour lesion showing tdTomato+ OCs in the LLC-DM model of CtskCre:Ai9 mice. Experiments were performed 1 h following 5-FAM-ZOL injection. j, UMAP of colour-coded re-clustered OCs extracted from Fig. 2b. k,l, GO biological processes enriched from up-regulated genes in OC subsets, cut-off = log2 fold change > 1. Data represent means ± s.e.m. Two-sided unpaired t-test (c) and two-sided hypergeometric distribution with Benjamini–Hochberg- adjusted P (k,l). Scale bars, 200 μm (a, top panel), 25 μm (a, lower panels), 50 μm (b,d (left panel)), 10 μm (d (enlarged right panels),i), 20 μm (f).
图5:ANG2与淋巴功能 · PDF 第 10 页
Fig. 5 | ANG2 triggers OC-related MLV impairments and T cell exhaustion. a, Normalized expression of genes related to lymphatic remodelling in control OCs (GSE147174) and two OC subsets in DM. Ctrl, control. b, Immunofluorescent images from the LLC-DM-CopGFP model of CtskCre:Ai9 mice. Dashed line, skull edge. c, Proportions of ANG2+ cells in tdTomato+ OCs or ITCs from b; n = 5 mice per group. d, Experimental set-up for e–o. 4T1-DM mice were treated with ZOL, or ZOL+ANG2 since tumour inoculation. e, Dura from d. The boxed areas in the left column are shown enlarged in the central and right columns. Dilations, blebs and local injuries are labelled with white, magenta and yellow rectangles or arrowheads, respectively. f, Statistics of LYVE1+ region area from e; n = 5 per group. g–i, Statistics of diameter (g), bleb (h) and local injuries (i) from e; n = 5 mice per group. j,k, Statistics of normalized 70 kDa dextran (j) and OVA (k) signals; n = 5 mice per group. Related to Extended Data Fig. 11g–i. l,m, Statistics of PD1+TIM3+ of dural CD8+ (l) and CD4+ (m) T cells from d; n = 5 mice per group, from three independent experiments. Related to Extended Data Fig. 13h,i. n, Left, tumour growth in d; right, BLI images; n = 5 mice per group, from three independent experiments. o, Survival of mice in d; n = 12 mice per group, from two independent experiments. p, Schematic diagram. SAS, subarachnoid space. Data represent means ± s.e.m. Two-sided unpaired t-test (f–n) and log-rank test (o). Scale bars, 40 μm (b, left panel), 10 μm (b, magnified images in right panels), 400 μm (e, left panels) and 100 μm (e, magnified images in right panels).
完整阅读记录与证据表
文献卡:Osteoclasts intercept meningeal lymphatic paths for dural metastasis
- Paper ID:p-0041-art-osteoclasts-intercept-meningeal
- 分析、接收及晨会日期:2026-11-03;Skill:article-read、morning-report、pdf、spreadsheets、web-publish。
- 来源:桌面113晨会.pdf,45页;Nature 658, 1025–1035 (2026),在线2026-09-30。
- DOI:10.1038/s41586-026-11082-6;人工核对:pending。
- 阅读边界:coverage.md。图集:figures/README.md。
一句话结论
在硬脑膜转移小鼠中,破骨细胞相关ANG2参与脑膜淋巴引流受损;药理和基因干预、CD8耗竭及淋巴通路结扎支持破骨细胞—淋巴—免疫联系,人体证据目前为影像关联。
研究问题与背景
硬脑膜处于颅骨与中枢神经系统边界,具有脑膜淋巴引流及局部免疫结构。本文询问肿瘤相关破骨细胞是否除骨吸收之外,还通过淋巴功能影响局部抗肿瘤反应。DM、BM与LM分开定义,主要实验使用DM;未把结果改写为所有脑转移或CRC研究。
贡献与比较对象
- 临床颅骨影像与动物局部病理相互支持,但属于不同证据层级。
- LYVE1面积、结构形态和到颈深淋巴结的功能示踪分别检测,提供“量不变、形态和功能改变”的具体观察。
- 药物效果经CD8耗竭与引流结扎检验,再以ANG2回补及Ctsk驱动敲低增加机制支持。
- 界面多核OC与较小ITC动态示踪提供细胞来源线索;单细胞OC1/OC2与形态分组的对应尚未建立。
方法与验证
临床MRI/CT数据来自华山医院。补表1逐条列63例:脑膜瘤14、BM 20、LM 15、DM 14,转移源包括乳腺和肺。DM倾向细胞经三轮局部适应及血行筛选获得,4T1-DM用于BALB/c,LLC-DM用于C57BL/6相关实验。(PDF第3、12页)
单细胞比较每组3份混合样本、每份含6只小鼠硬脑膜;流式常为每组5只。ZOL从接种当天开始,每3天给药;Angpt2敲低在接种后第3天干预。结构、示踪、免疫检测多在第12天,生存另设队列。本文未重跑单细胞/转录组,仅定点核查公开数据表与源数据。
核心证据
| 主张或结果 | 数字、单位、条件 | PDF页序/图表 | 依据与核对 |
|---|---|---|---|
| DM与邻近颅骨侵蚀相关 | 临床63例中DM 14例,乳腺8/肺6;DM骨变薄100%;脑膜瘤14例中28.6%骨增厚 | 2–3、17–18;图1a、b、扩展图1;补表1;Source Data Fig1b | 原图、患者条目与源表独立核对;不作诊断敏感性/特异性估计 |
| 局部结构异常伴引流降低 | 40/70 kDa葡聚糖或OVA脑池示踪,1 h后颈深淋巴结信号;多数每组5只;基线LYVE1面积差异不显著 | 2–3、19–20;图1f–l、扩展图2 | 原图与图注,源数据Fig1和ED2关键栏 |
| 单细胞实验有混样层级 | 非肿瘤/LM/DM各3份样本,每份混合6只;不是每组3只鼠,也不是每组18个独立测序重复 | 4–5;图2a;扩展图4a | 正文、图注及源表 |
| CD8比例与效应能力分开 | CD8占T+NK:DM 62.8%、LM 30.6%、非肿瘤7.0%;PD1/TIM3上升;双细胞因子产生比例未显著上升 | 4–5;图2f–o;Source Data Fig2 | 原图、源表62.77/30.57/6.99%;未写成占全部细胞比例或细胞因子归零 |
| ZOL改善淋巴与肿瘤结局 | 100 μg/kg每3 d,从接种当天;第12 d检测;图3结构/免疫和肿瘤定量每组5只,生存每组10只 | 6–7、15;图3c–n | 原图/图注、Methods及Source Data Fig3;未报告人为估读的中位生存 |
| CD8参与ZOL疗效 | CD8耗竭后,ZOL肿瘤控制和生存优势消失 | 6–7;图3o–q | 原图/图注及Source Data Fig3;必要性实验,未据此声称排除全部其他路径 |
| 引流通路参与ZOL疗效 | 结扎dCLN输入淋巴管后ZOL肿瘤优势消失;每组6只;结扎单独与PBS+sham无显著差别 | 27–28;扩展图8g、h | 原图/图注及源表;该实验为肿瘤负荷,不附加未测生存结论 |
| 界面OC和ITC有动态来源联系 | 5-FAM-ZOL示踪1/3/6/12/24/72 h;活体较小细胞分离;体积与示踪定量n=5只 | 8–9;图4a–i、视频1 | 原图、全部13视频帧和源表;保留其他ITC来源未定 |
| OC1/OC2是转录分组 | GO比较OC1/OC2及公共对照GSE147174 | 8–9、29–30;图4j–l、扩展图9s–u;补表3–5 | 原图、图注及长表定点核查;未等同OC/ITC形态 |
| ANG2回补可削弱ZOL作用 | ANG2每日10 μg/kg,接种当天开始;结构/引流/免疫与肿瘤多每组5只,生存每组12只 | 7–11、15;图5、扩展图11、13 | 原图/图注、Source Data Fig5;PDGF-BB同背景未显著改变所测结果 |
| OC相关ANG2获得遗传干预支持 | Ctsk启动子驱动2条Angpt2 shRNA;LLC报告模型检验敲低,4T1-DM评估引流/肿瘤/生存;生存每组10只 | 35–36;扩展图12 | 原图、图注、源表;不写成诱导型OC特异条件敲除 |
| LEC核苷酸通路是线索 | CD45−CD31+PDPN+ LEC;每份混6只;ZOL+ANG2相对ZOL,核苷酸相关转录通路下调 | 37–38;扩展图13;补表6、7 | 原图/图注和GO长表;未转述为已证实的代谢通量机制 |
局限与待解问题
作者明确指出
- 不同颅内肿瘤的脑膜淋巴改变有情境差异,需要比较DM、LM和BM。(第9页)
- OC/ITC与OC1/OC2之间关系未确定,ITC是否还有其他来源也需示踪;建议更严格的诱导、组织特异遗传模型。(第9页)
- OC和ITC对ANG2功能贡献及与正常OC的系统性比较仍有待开展。(第9页)
AI推断与理由
- 临床仅影像关联,尚缺患者中同一病灶的骨、OC/ANG2、淋巴和免疫配对证据。
- ZOL从接种当天、基因干预从第3天开始,对晚期病灶的治疗外推仍需实验。
- Ctsk表达和ZOL药理作用均有细胞范围限制;敲低、回补和示踪形成互补证据,仍不足以量化每条路径的独立贡献。
- ANG2也能改变脑膜血管,审稿回复承认少数内皮细胞Angpt2表达;不采用“仅OC表达”这一绝对表述。受体与代谢下游未被逐项因果拆分。
- 样本混合及有限n值限制效应估计,免疫检查点药物联合及人体疗效未在本文中检验。
待核对问题与后续阅读
- 正文将Angpt2来源描述得较集中,但审稿回复及扩展图10m提示少数内皮表达;本稿统一用“OC相关/OC来源参与”,保留其他来源。
- 扩展图12包含LLC的敲低效果验证与4T1的功能终点,未合并为同一模型内的全部检测。
- 大型基因/GO清单及17源数据工作簿保留原文件,实际核查位置与边界见coverage;未独立重做统计检验或组学。
- Nature 2020《VEGF-C-driven lymphatic drainage enables immunosurveillance of brain tumours》(10.1038/s41586-019-1912-x):本次核实书目及摘要,未独立全文精读。