研究问题
ADC疗效既取决于肿瘤是否表达靶点,也取决于药物能否接触靶点、进入细胞并释放载荷。本文从受体小鼠的性别差异出发,研究雌激素、肿瘤细胞与中性粒细胞如何共同影响这一步药物递送。
主要对象是CLDN18.2阳性胰腺导管腺癌(PDAC);胃癌、结直肠癌及其他抗体治疗用于特定模型或临床关联的延伸检验。
| 研究层次 | 方法 | 主要问题 |
|---|---|---|
| 药效差异 | 同一患者来源PDX的雌雄配对、激素干预 | 宿主环境是否影响ADC作用 |
| 机制与功能 | 中性粒细胞及NET干预、药物示踪、肿瘤信号敲除与回补 | NET如何形成、怎样影响药物接触靶点 |
| 人体关联 | 治疗前组织NET与各队列疗效比较 | 模型线索是否有临床相关性 |
雌雄配对PDX发现宿主相关差异
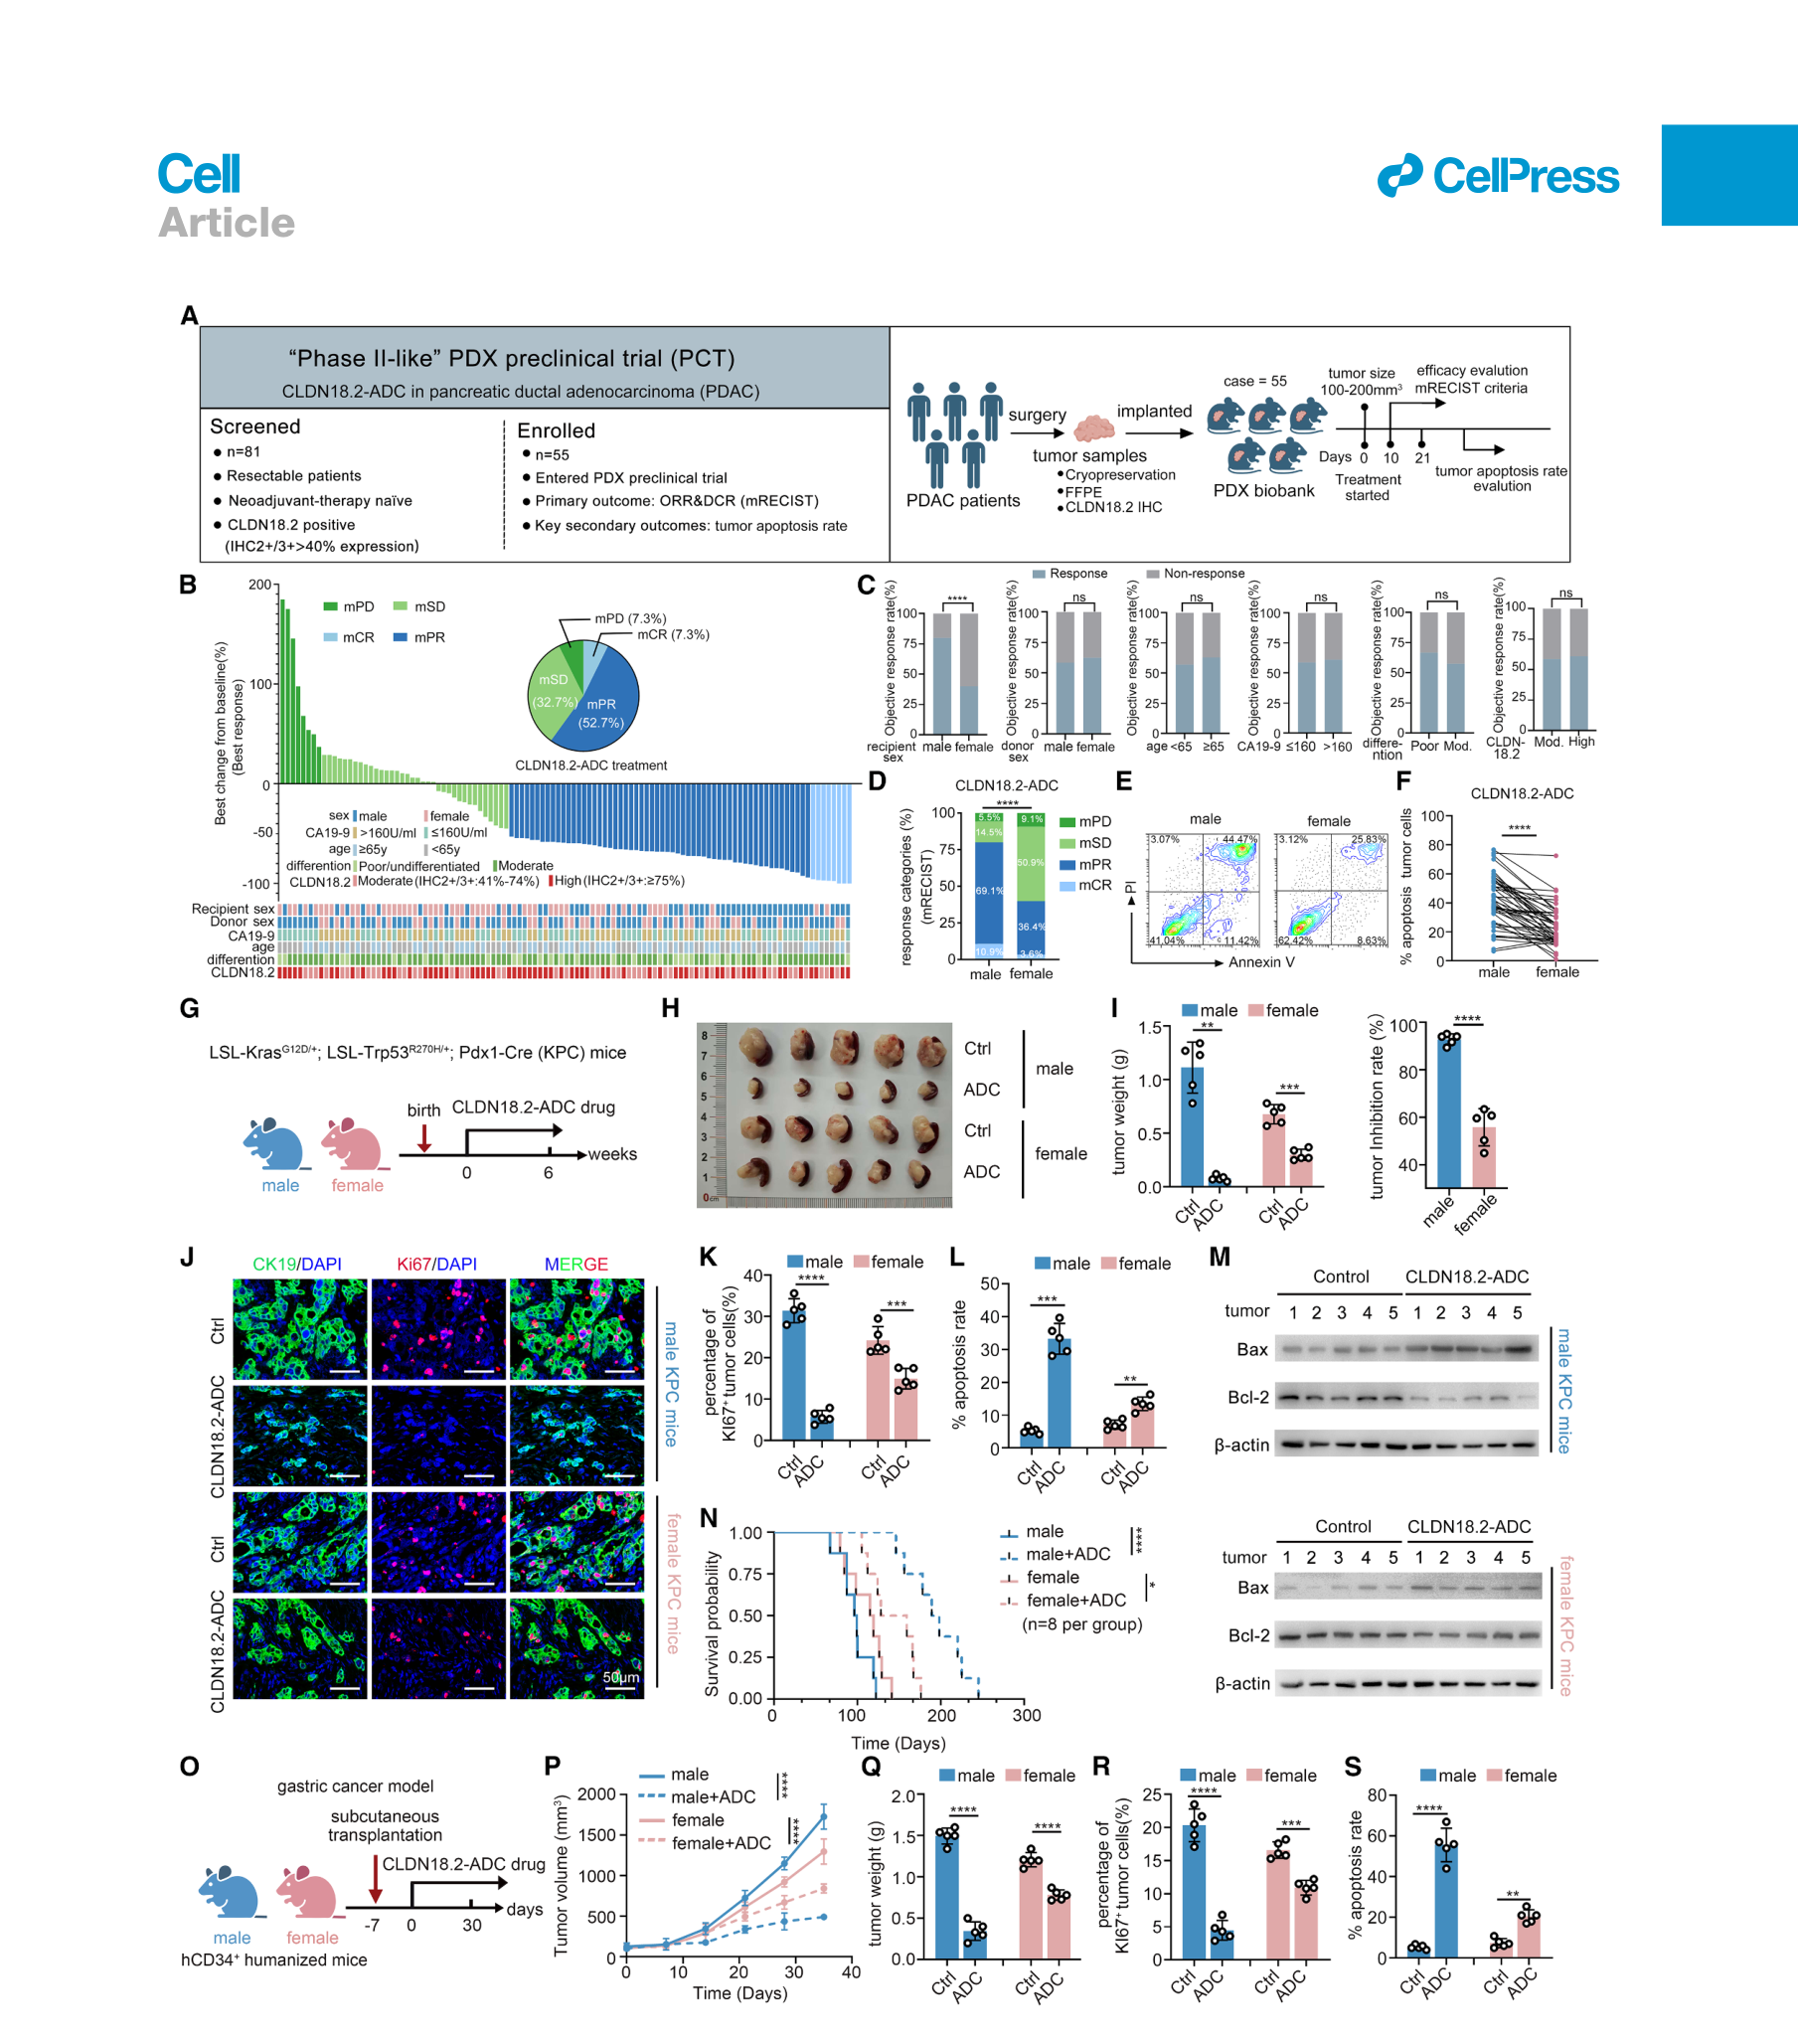
作者筛查81份手术来源PDAC,纳入成功建模的55个CLDN18.2阳性PDX。每个患者来源肿瘤分别进入1只雄性和1只雌性hCD34⁺人源化小鼠,共55对、110只小鼠。这是被作者称为“phase II-like”的临床前PDX研究。入选要求为超过40%的肿瘤细胞呈CLDN18.2 IHC 2+/3+。(图1a;补表S1;PDF第27、29页)
按照研究的改良小鼠疗效标准,雄性受体44/55出现模型完全或部分缓解,雌性受体22/55,对应80%与40%;配对exact McNemar检验P<0.0001。以PDX病例为聚类单位的GEE分析中,调整肿瘤供者性别和CLDN18.2表达后,雌性相对雄性的缓解优势比为0.166(95% CI 0.09–0.32)。供者性别与疗效的关联未达显著。(图1b–f;补表S2、S3)
疗效分类依据21天观察窗内的体积变化与累积平均变化,属于模型终点。跨供者性别的类器官移植、自发性KPC肿瘤及胃癌模型中,也观察到受体性别相关的药效差异。(图1g–s;补图S1)
雌激素与中性粒细胞参与耐药
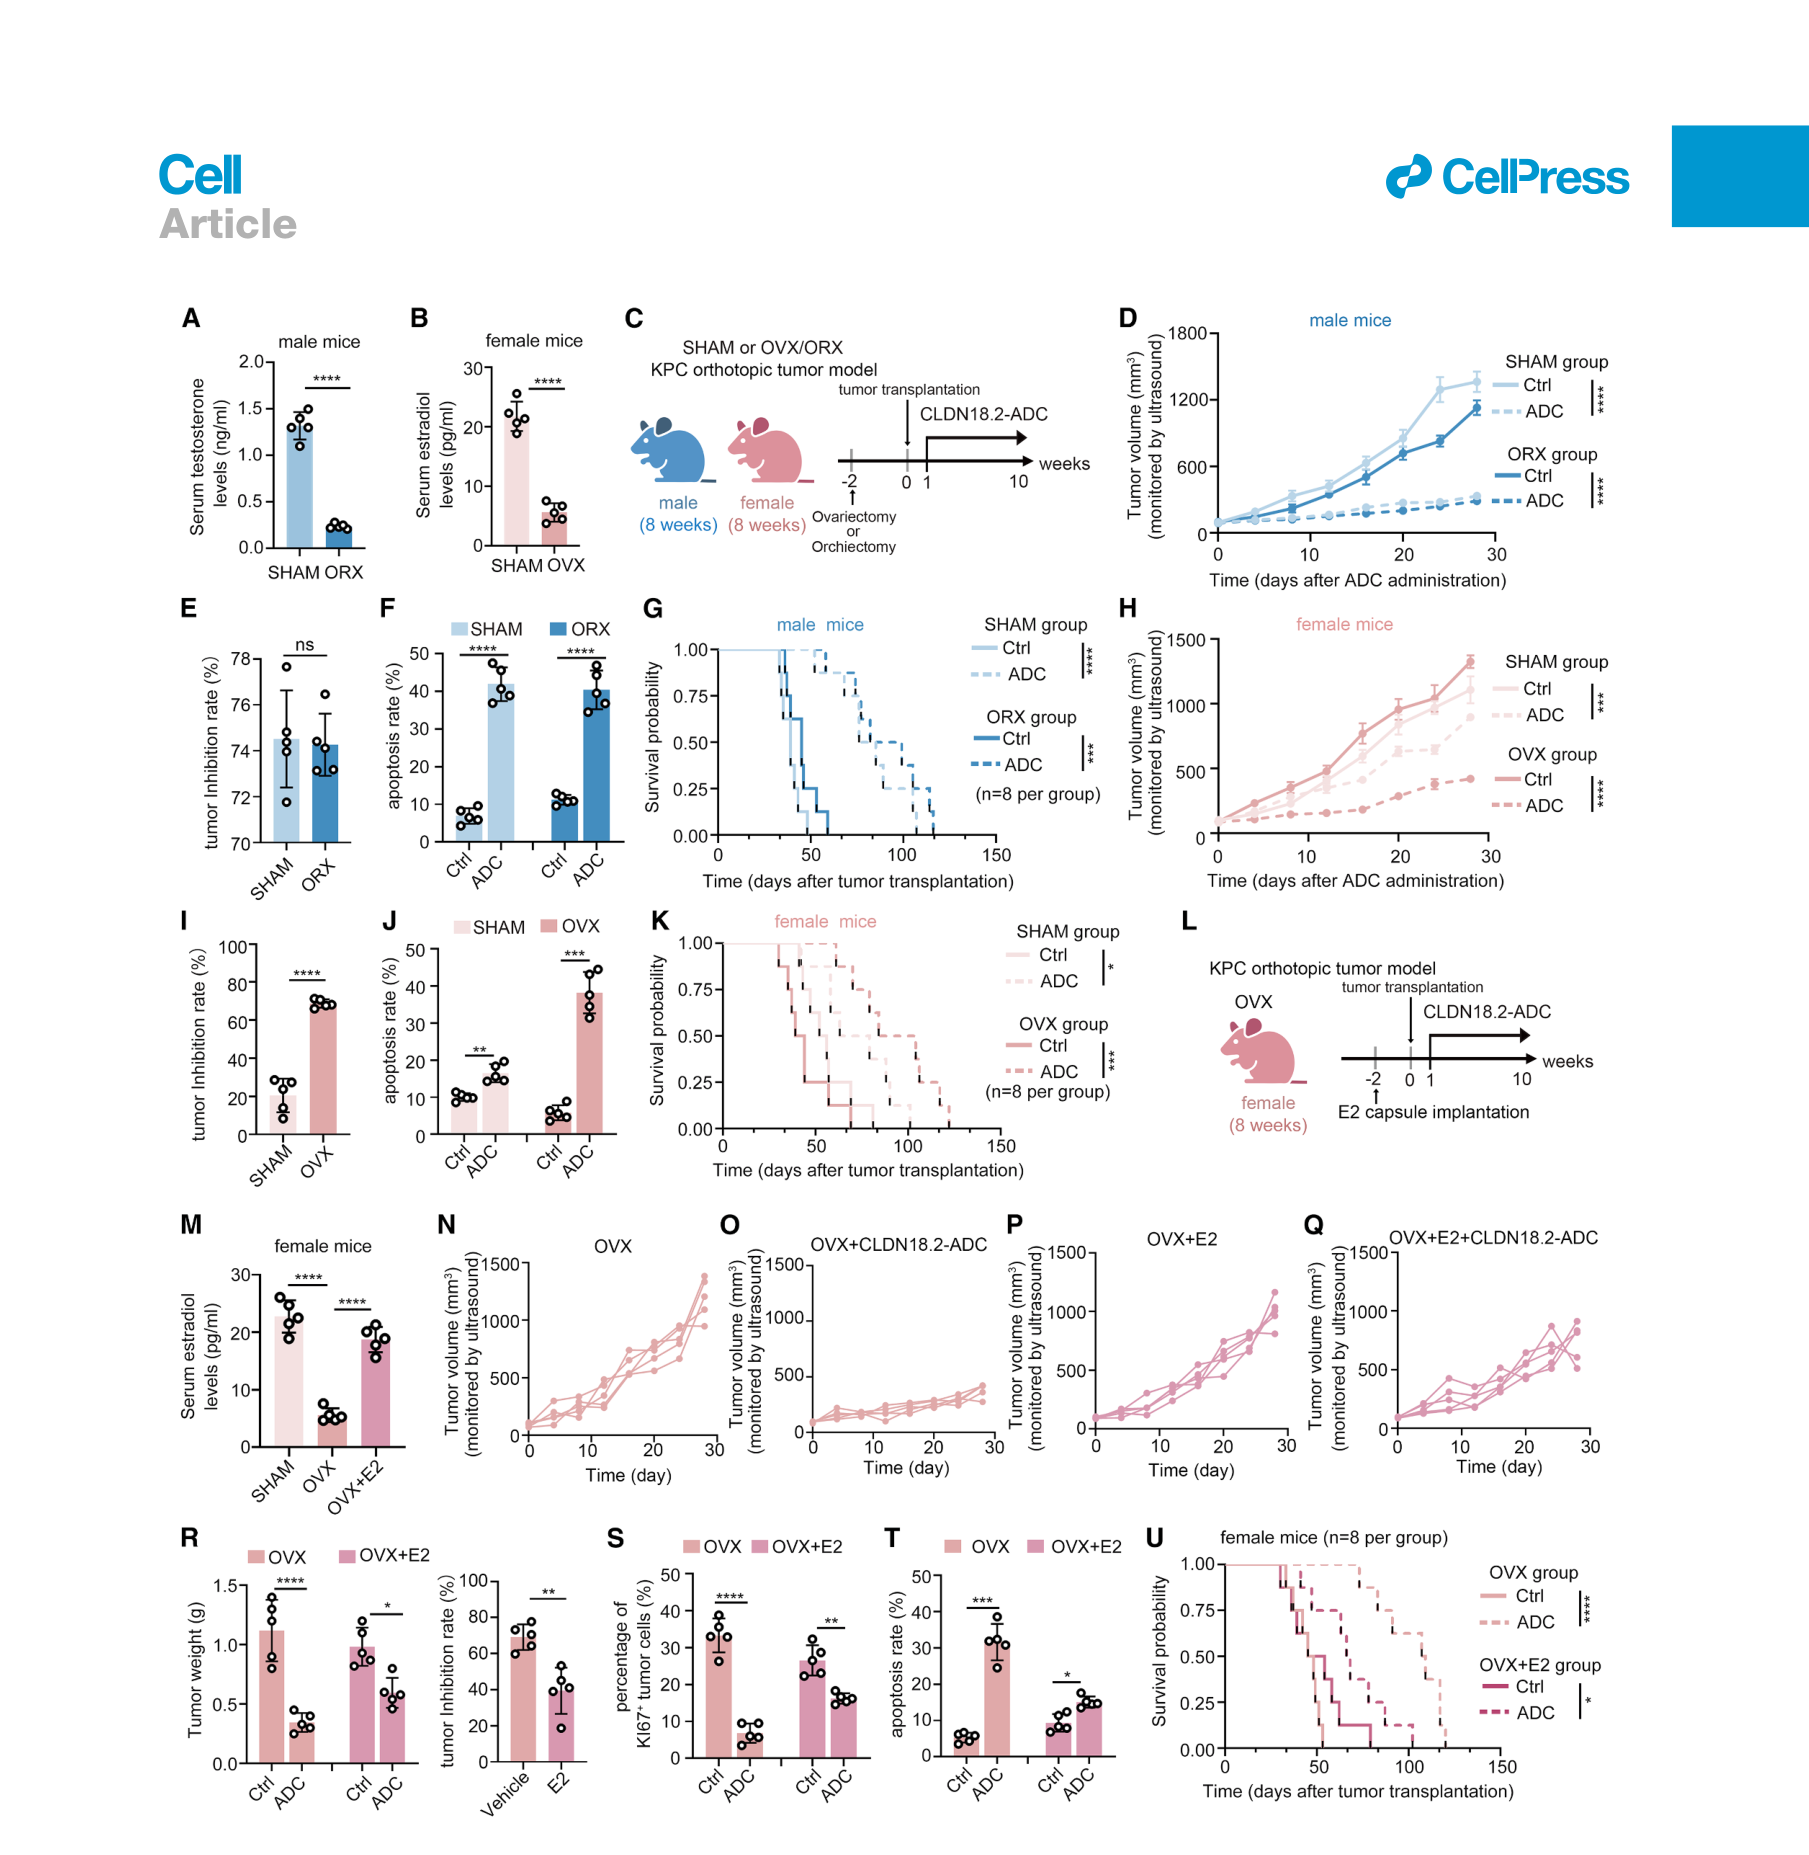
雄性小鼠去势后,CLDN18.2-ADC的主要药效终点变化不显著;雌性小鼠卵巢切除后,ADC的肿瘤控制及生存效应增强,补回雌二醇(E2)则削弱这一增强。上述结果支持雌激素参与该模型的药效差异。(图2,多数组织或肿瘤定量每组5只,生存每组8只)
在所测条件下,E2没有显著改变CLDN18.2表达、ADC内化,或孤立肿瘤类器官对ADC的敏感性。加入微环境后,差异更加明显。(补图S2a–i)
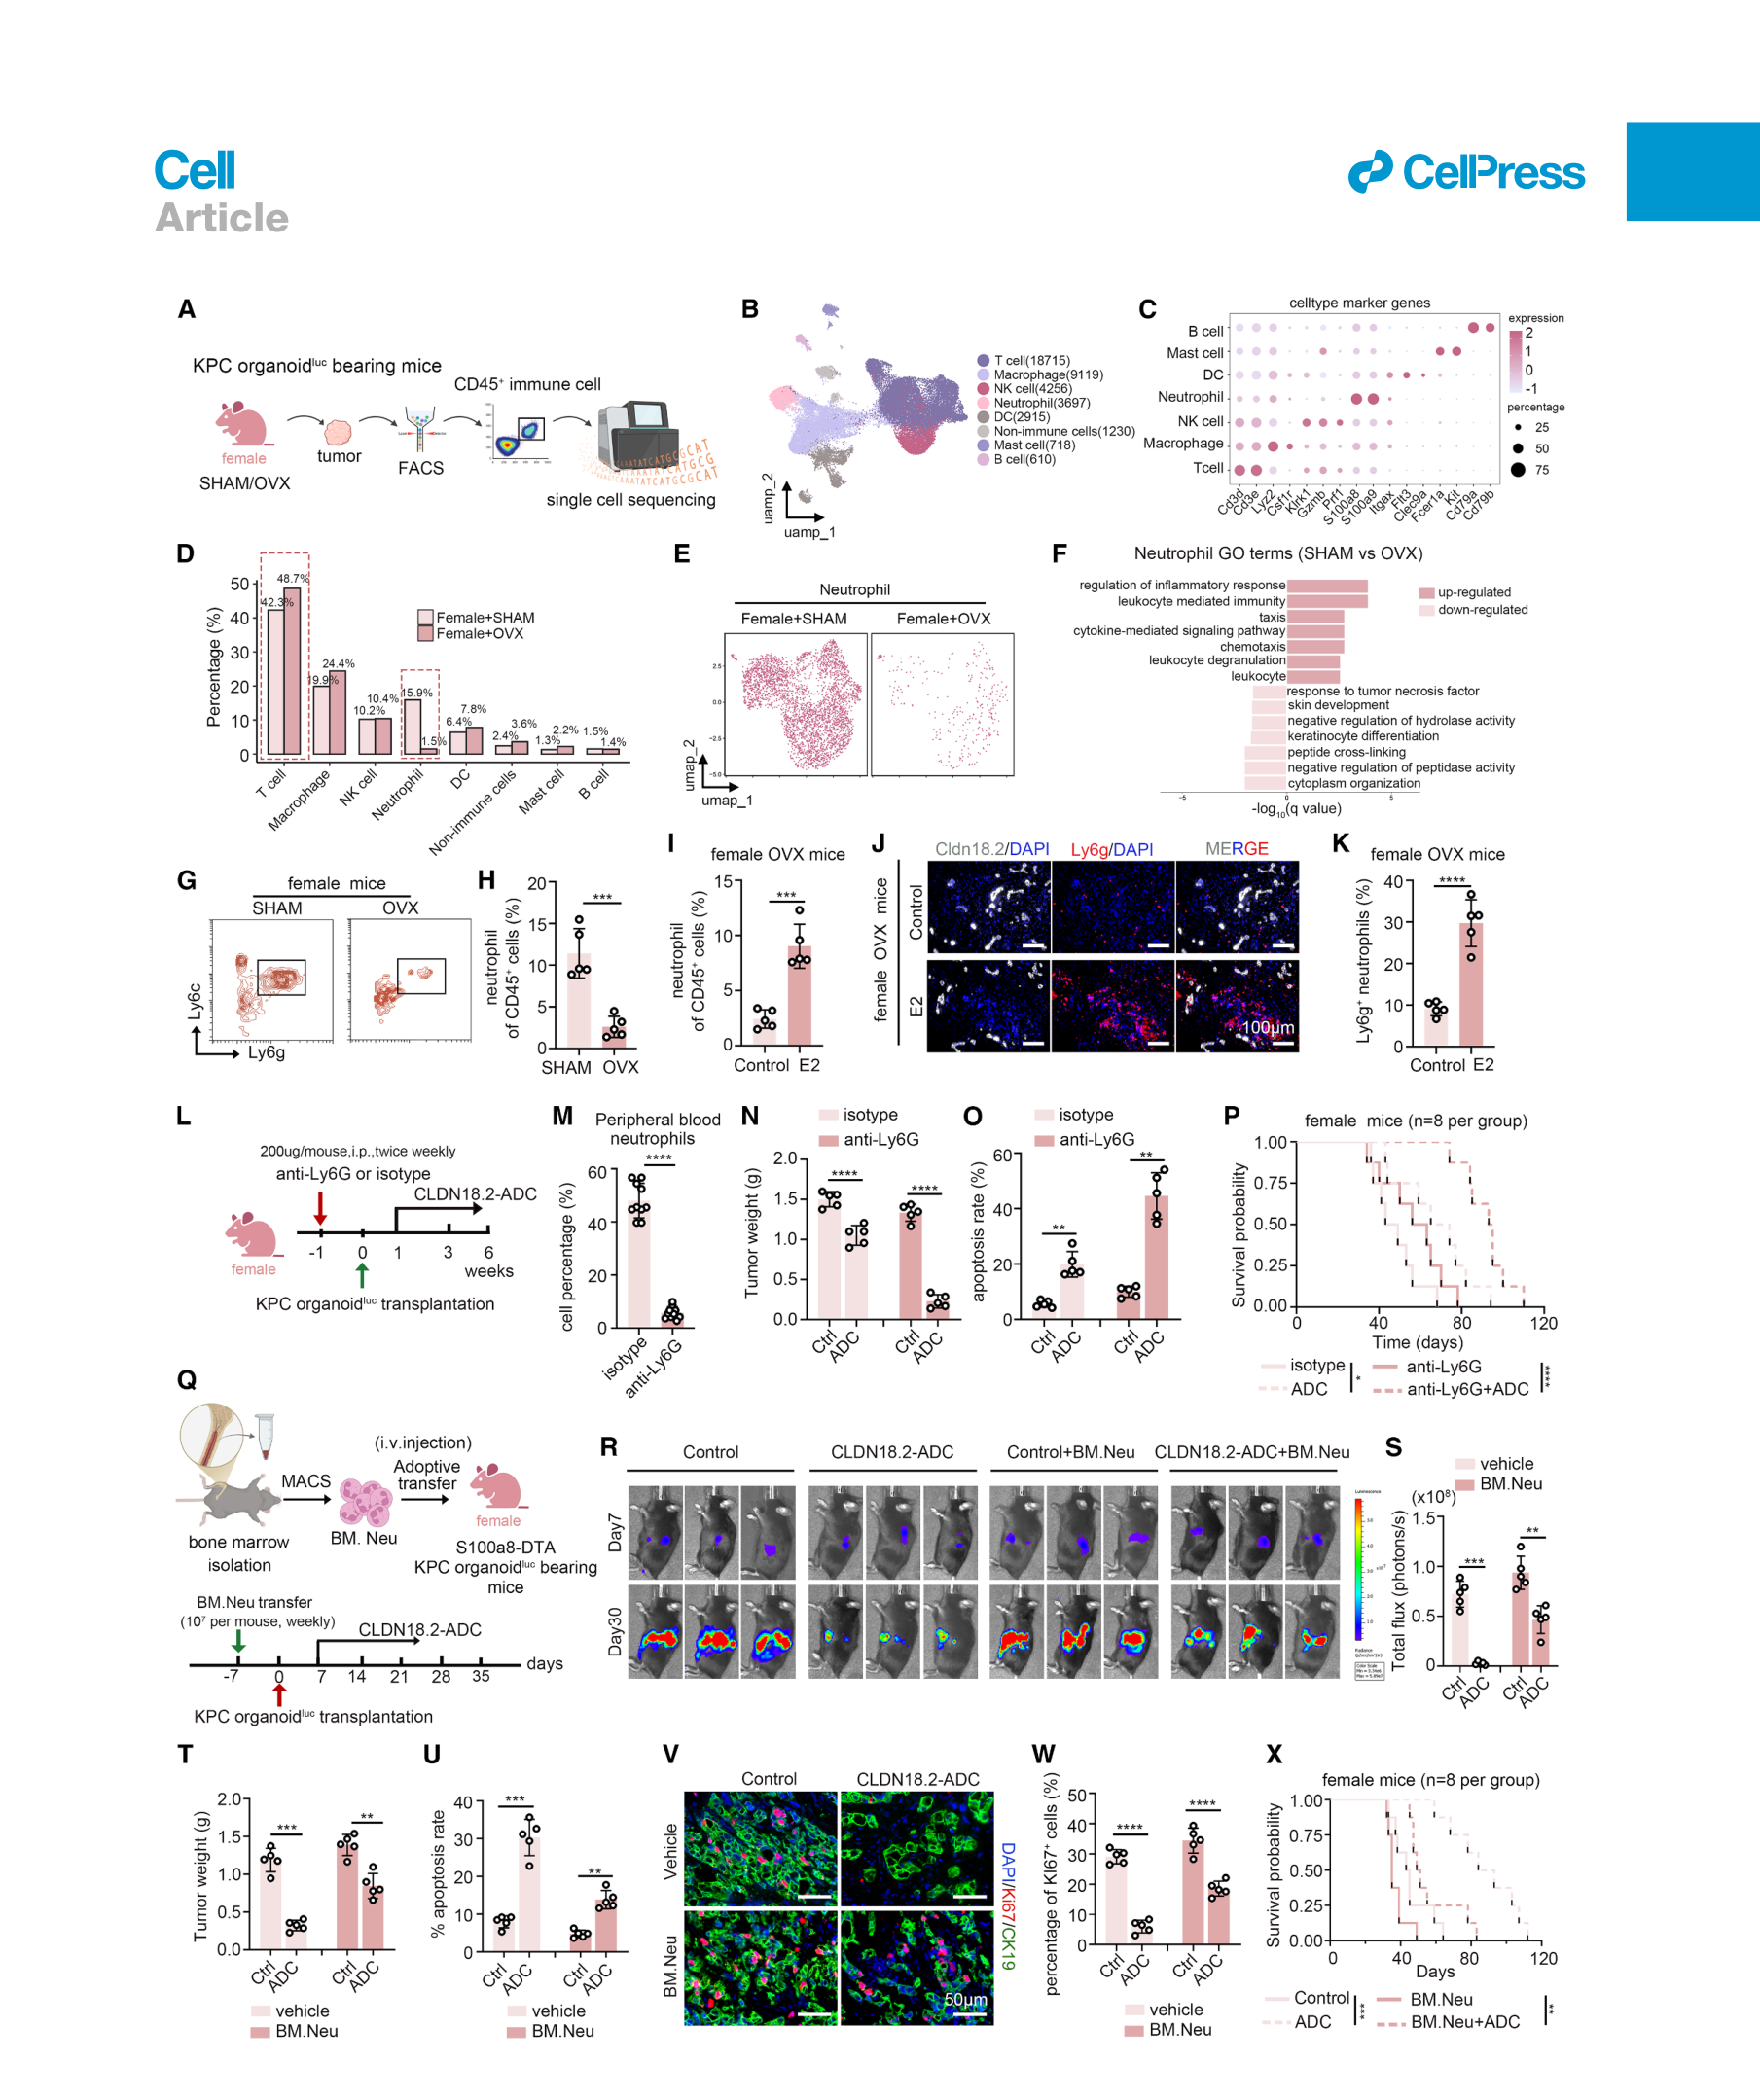
单细胞分析比较SHAM与卵巢切除雌鼠的肿瘤CD45⁺细胞,每组3只小鼠,共41,260个细胞;流式和组织染色支持雌激素与肿瘤内中性粒细胞增多有关。清除中性粒细胞可增强雌鼠中的ADC药效;向中性粒细胞缺失的雌鼠补入骨髓来源中性粒细胞,则削弱药效。相同补入实验在雄鼠中未产生显著的耐药效应,提示细胞所处环境也参与决定其作用。(图3;补图S2n–q)
NET降低ADC对肿瘤靶点的接触
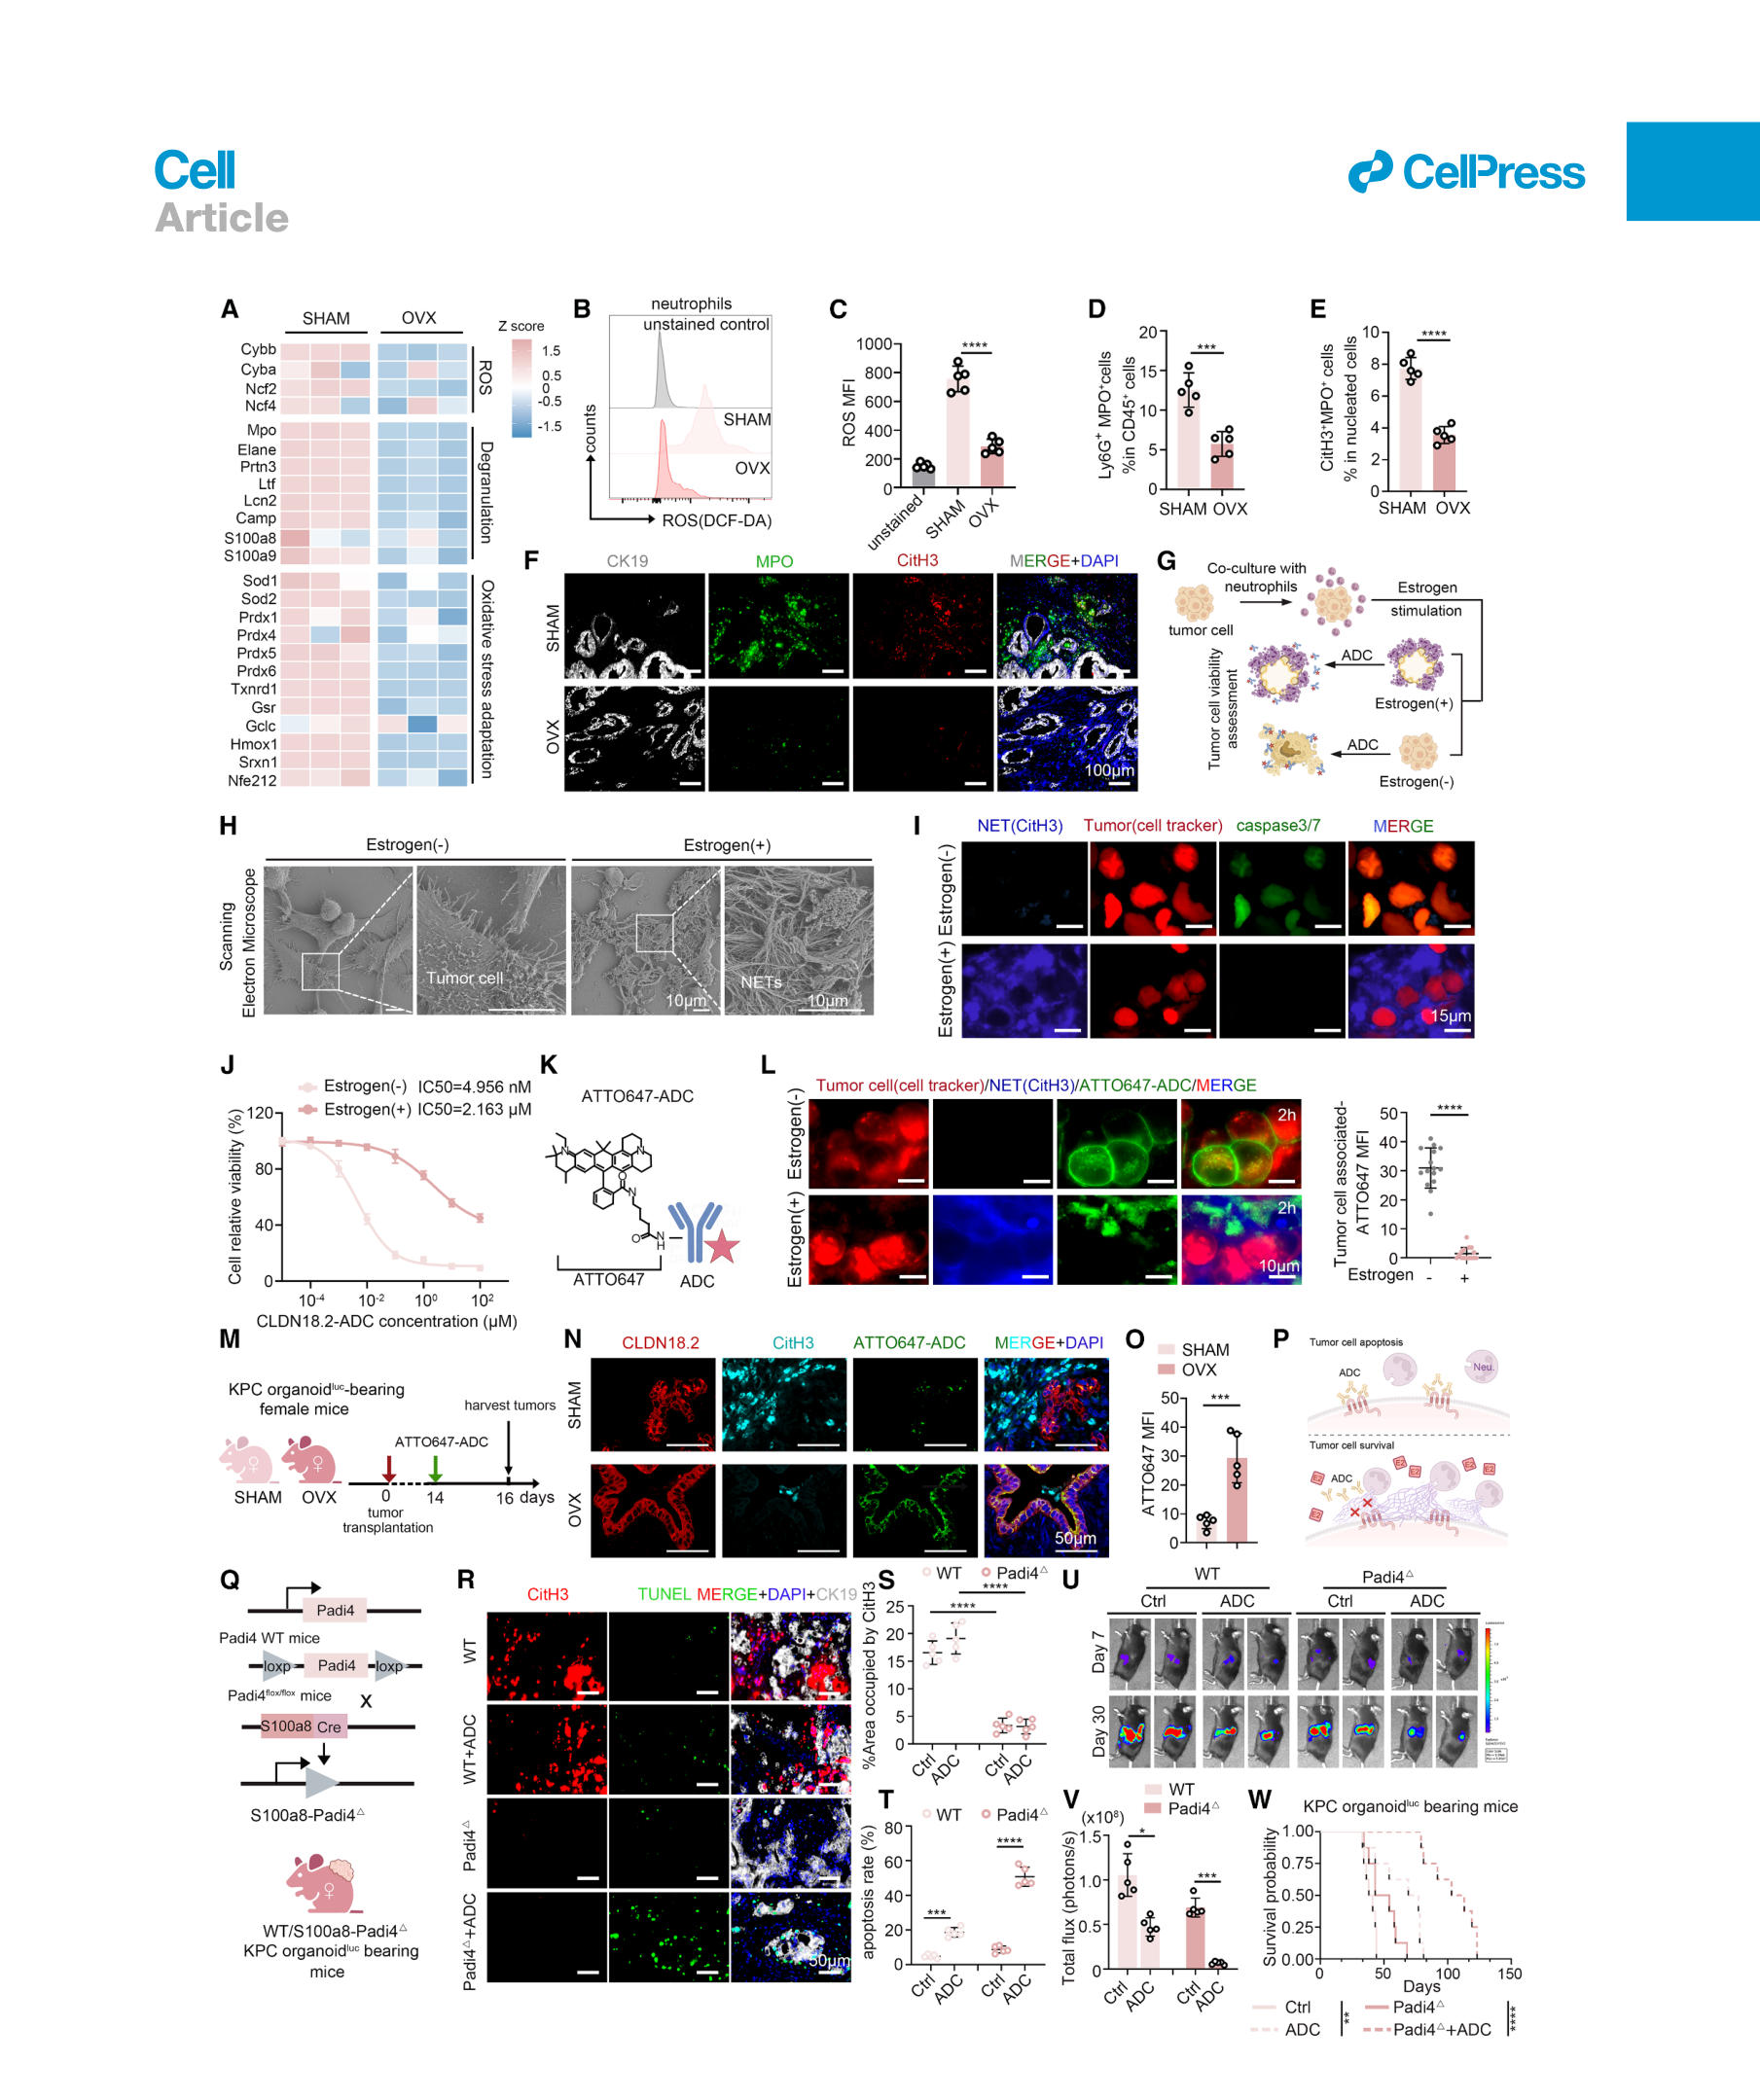
雌激素较高的模型中,中性粒细胞出现较高的ROS及NET相关信号。扫描电镜显示细胞外网状结构覆盖肿瘤细胞;荧光ADC示踪和免疫金电镜进一步显示,ADC更多滞留于细胞外或NET相关区域,肿瘤细胞相关药物信号和杀伤下降。(图4a–o;补图S3)
作者把这一现象称为功能性抗原遮蔽:肿瘤仍表达抗原,但抗体接近抗原的机会减少。中性粒细胞谱系Padi4缺失及DNase I降解NET,均可改善模型中的ADC作用;DNase I的改善效应在T细胞缺陷小鼠中也可观察到。(图4q–w;补图S5)
这里既有药物定位,也有遗传和降解干预的功能支持。NET各组分与抗体的精确结合方式主要来自分子对接预测,电荷相互作用对体内滞留的具体贡献仍待直接测量。(补图S3n–q)
肿瘤STING的输出偏向NF-κB
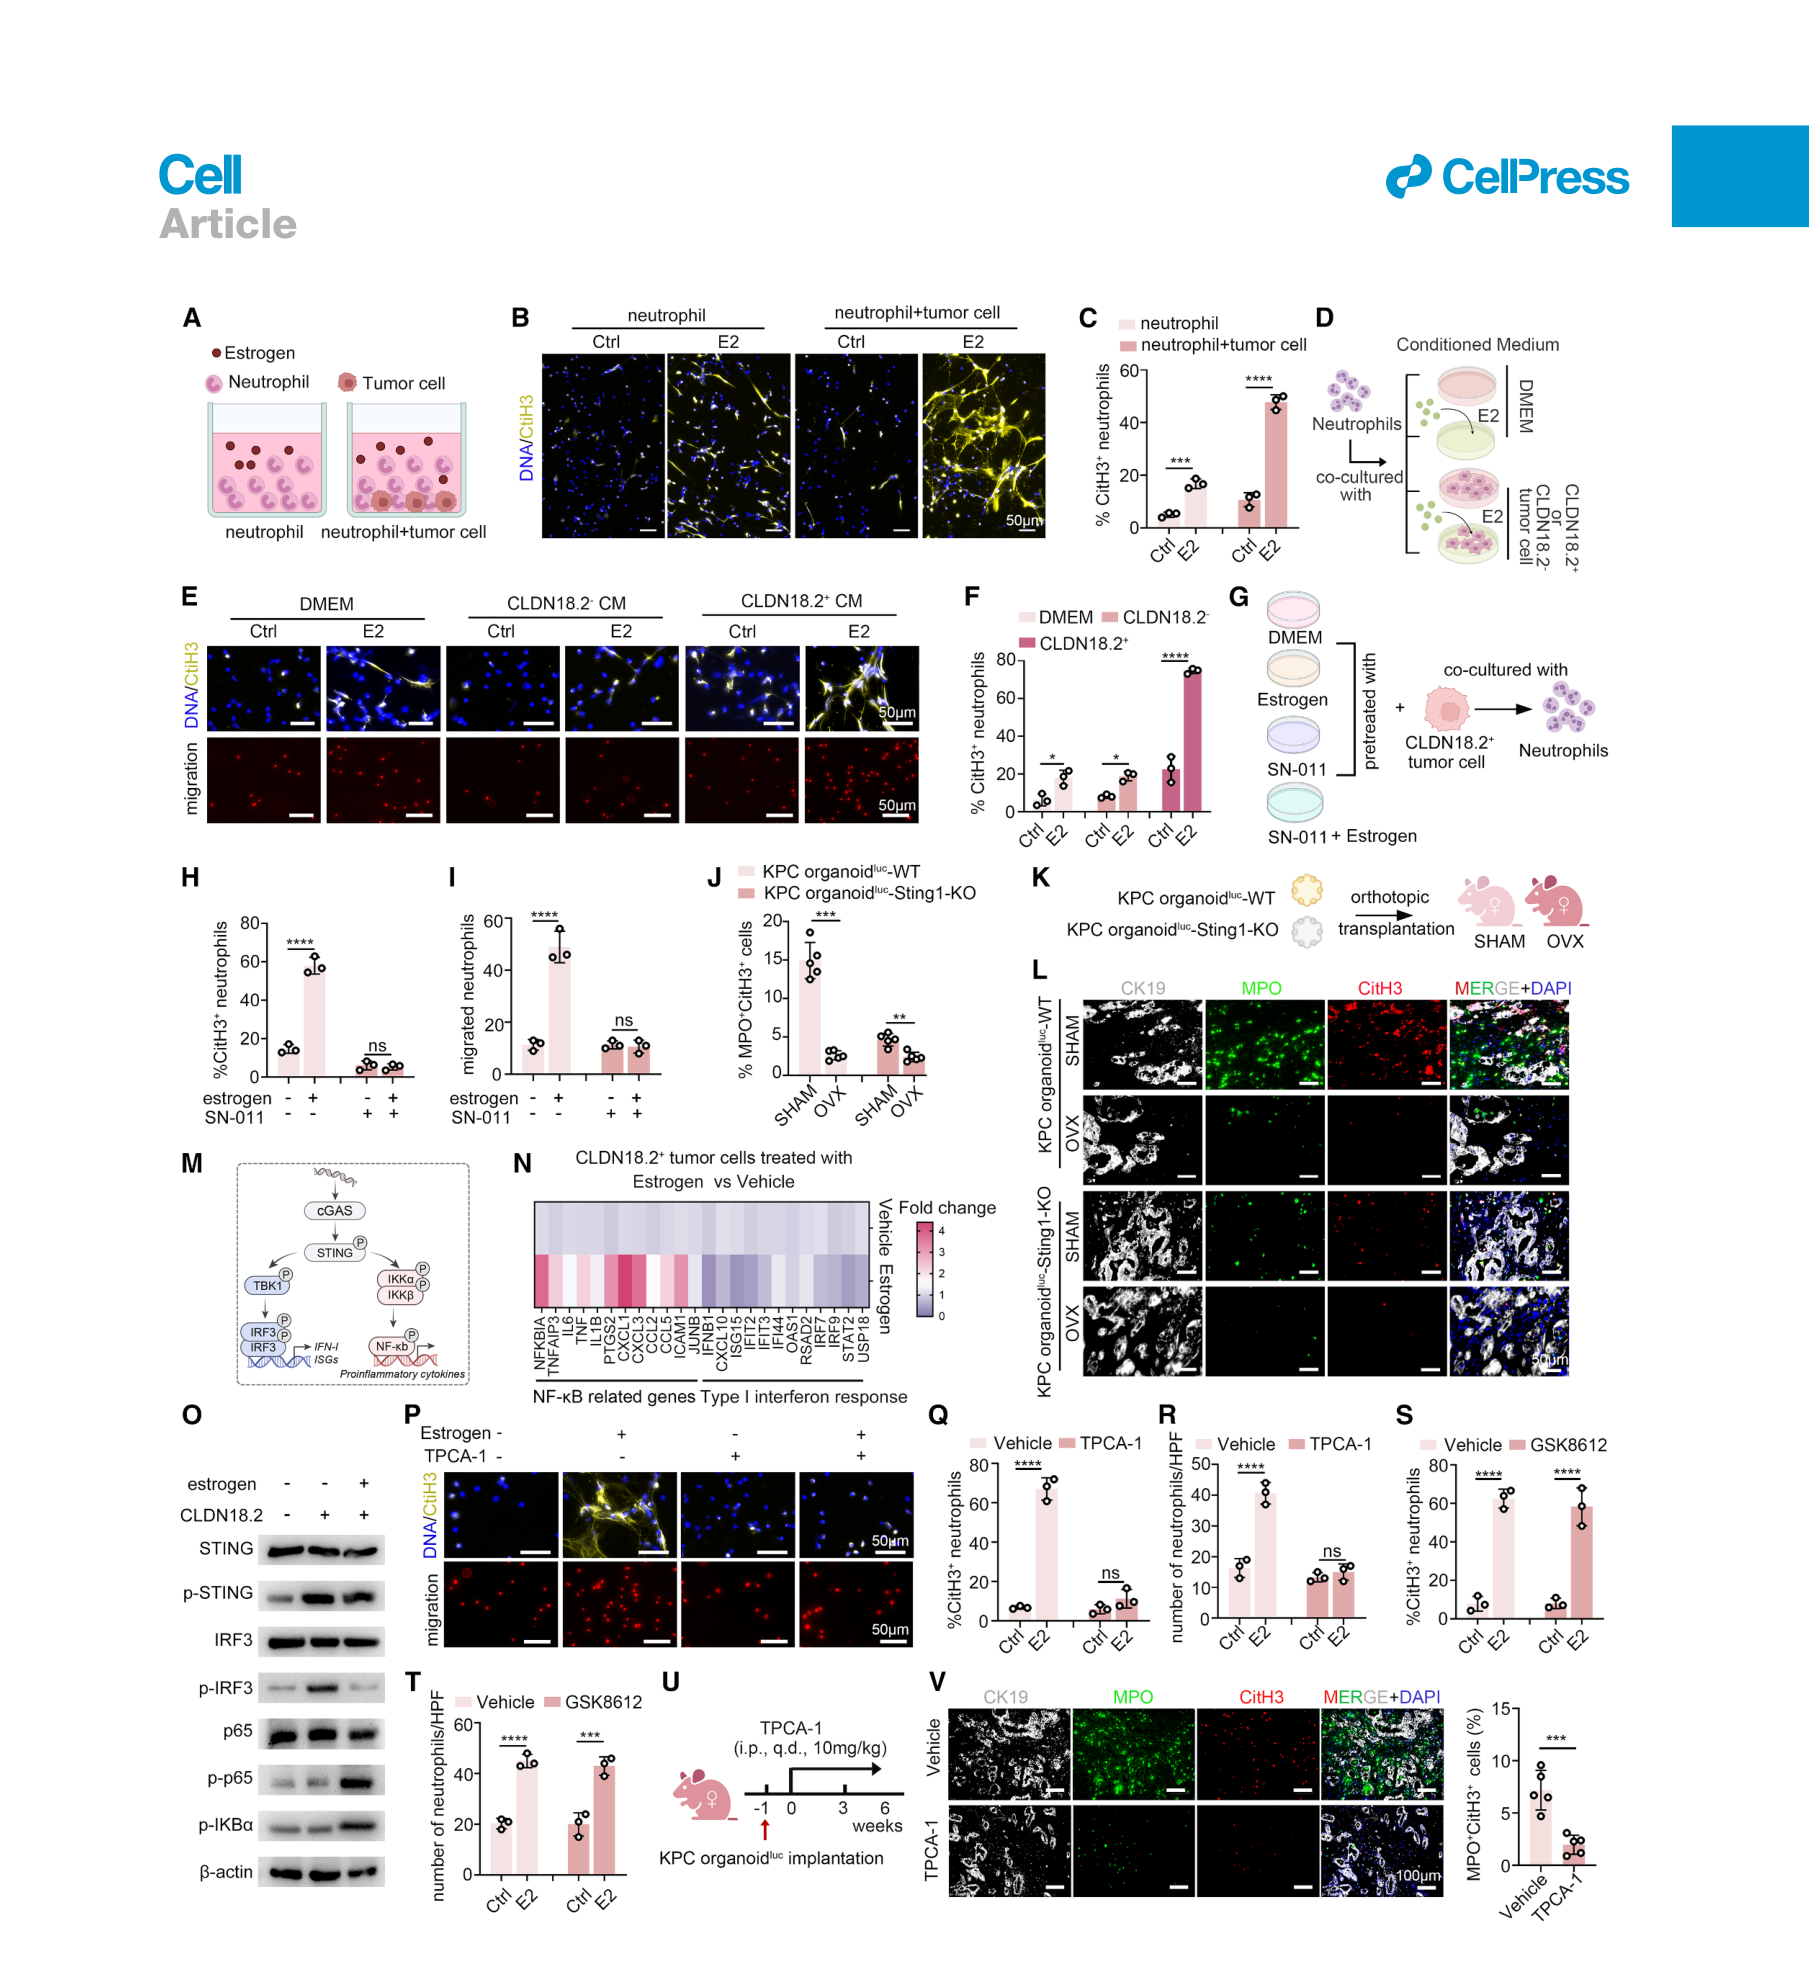
E2可直接经中性粒细胞GPER1促进体外NET形成,但中性粒细胞Gper1缺失并未在体内完全消除NET。作者因此继续检查肿瘤细胞的信号。(补图S6)
在CLDN18.2阳性肿瘤细胞中,作者提出并通过蛋白互作、稳定性及缺失实验支持以下路径:
- 基础状态:CLDN18.2促进SPOP与TREX1关联及TREX1降解,伴随胞质DNA积累和cGAS–STING激活。(补图S7)
- E2刺激后:GPER1–CREB1上调TRAF6,增强STING与TRAF6结合及STING的K63泛素化,增加IKKβ募集、减少IRF3募集,使下游输出偏向NF-κB。(图5;补图S8)
因此,这里的关键变化是STING下游信号分支的重新分配。肿瘤Sting1缺失可减少NET相关信号,抑制NF-κB也可降低条件培养液诱导的中性粒细胞迁移和NET形成;TBK1/IRF3通路抑制未产生相同效果。(图5g–w)
CXCL1连接肿瘤信号与NET形成
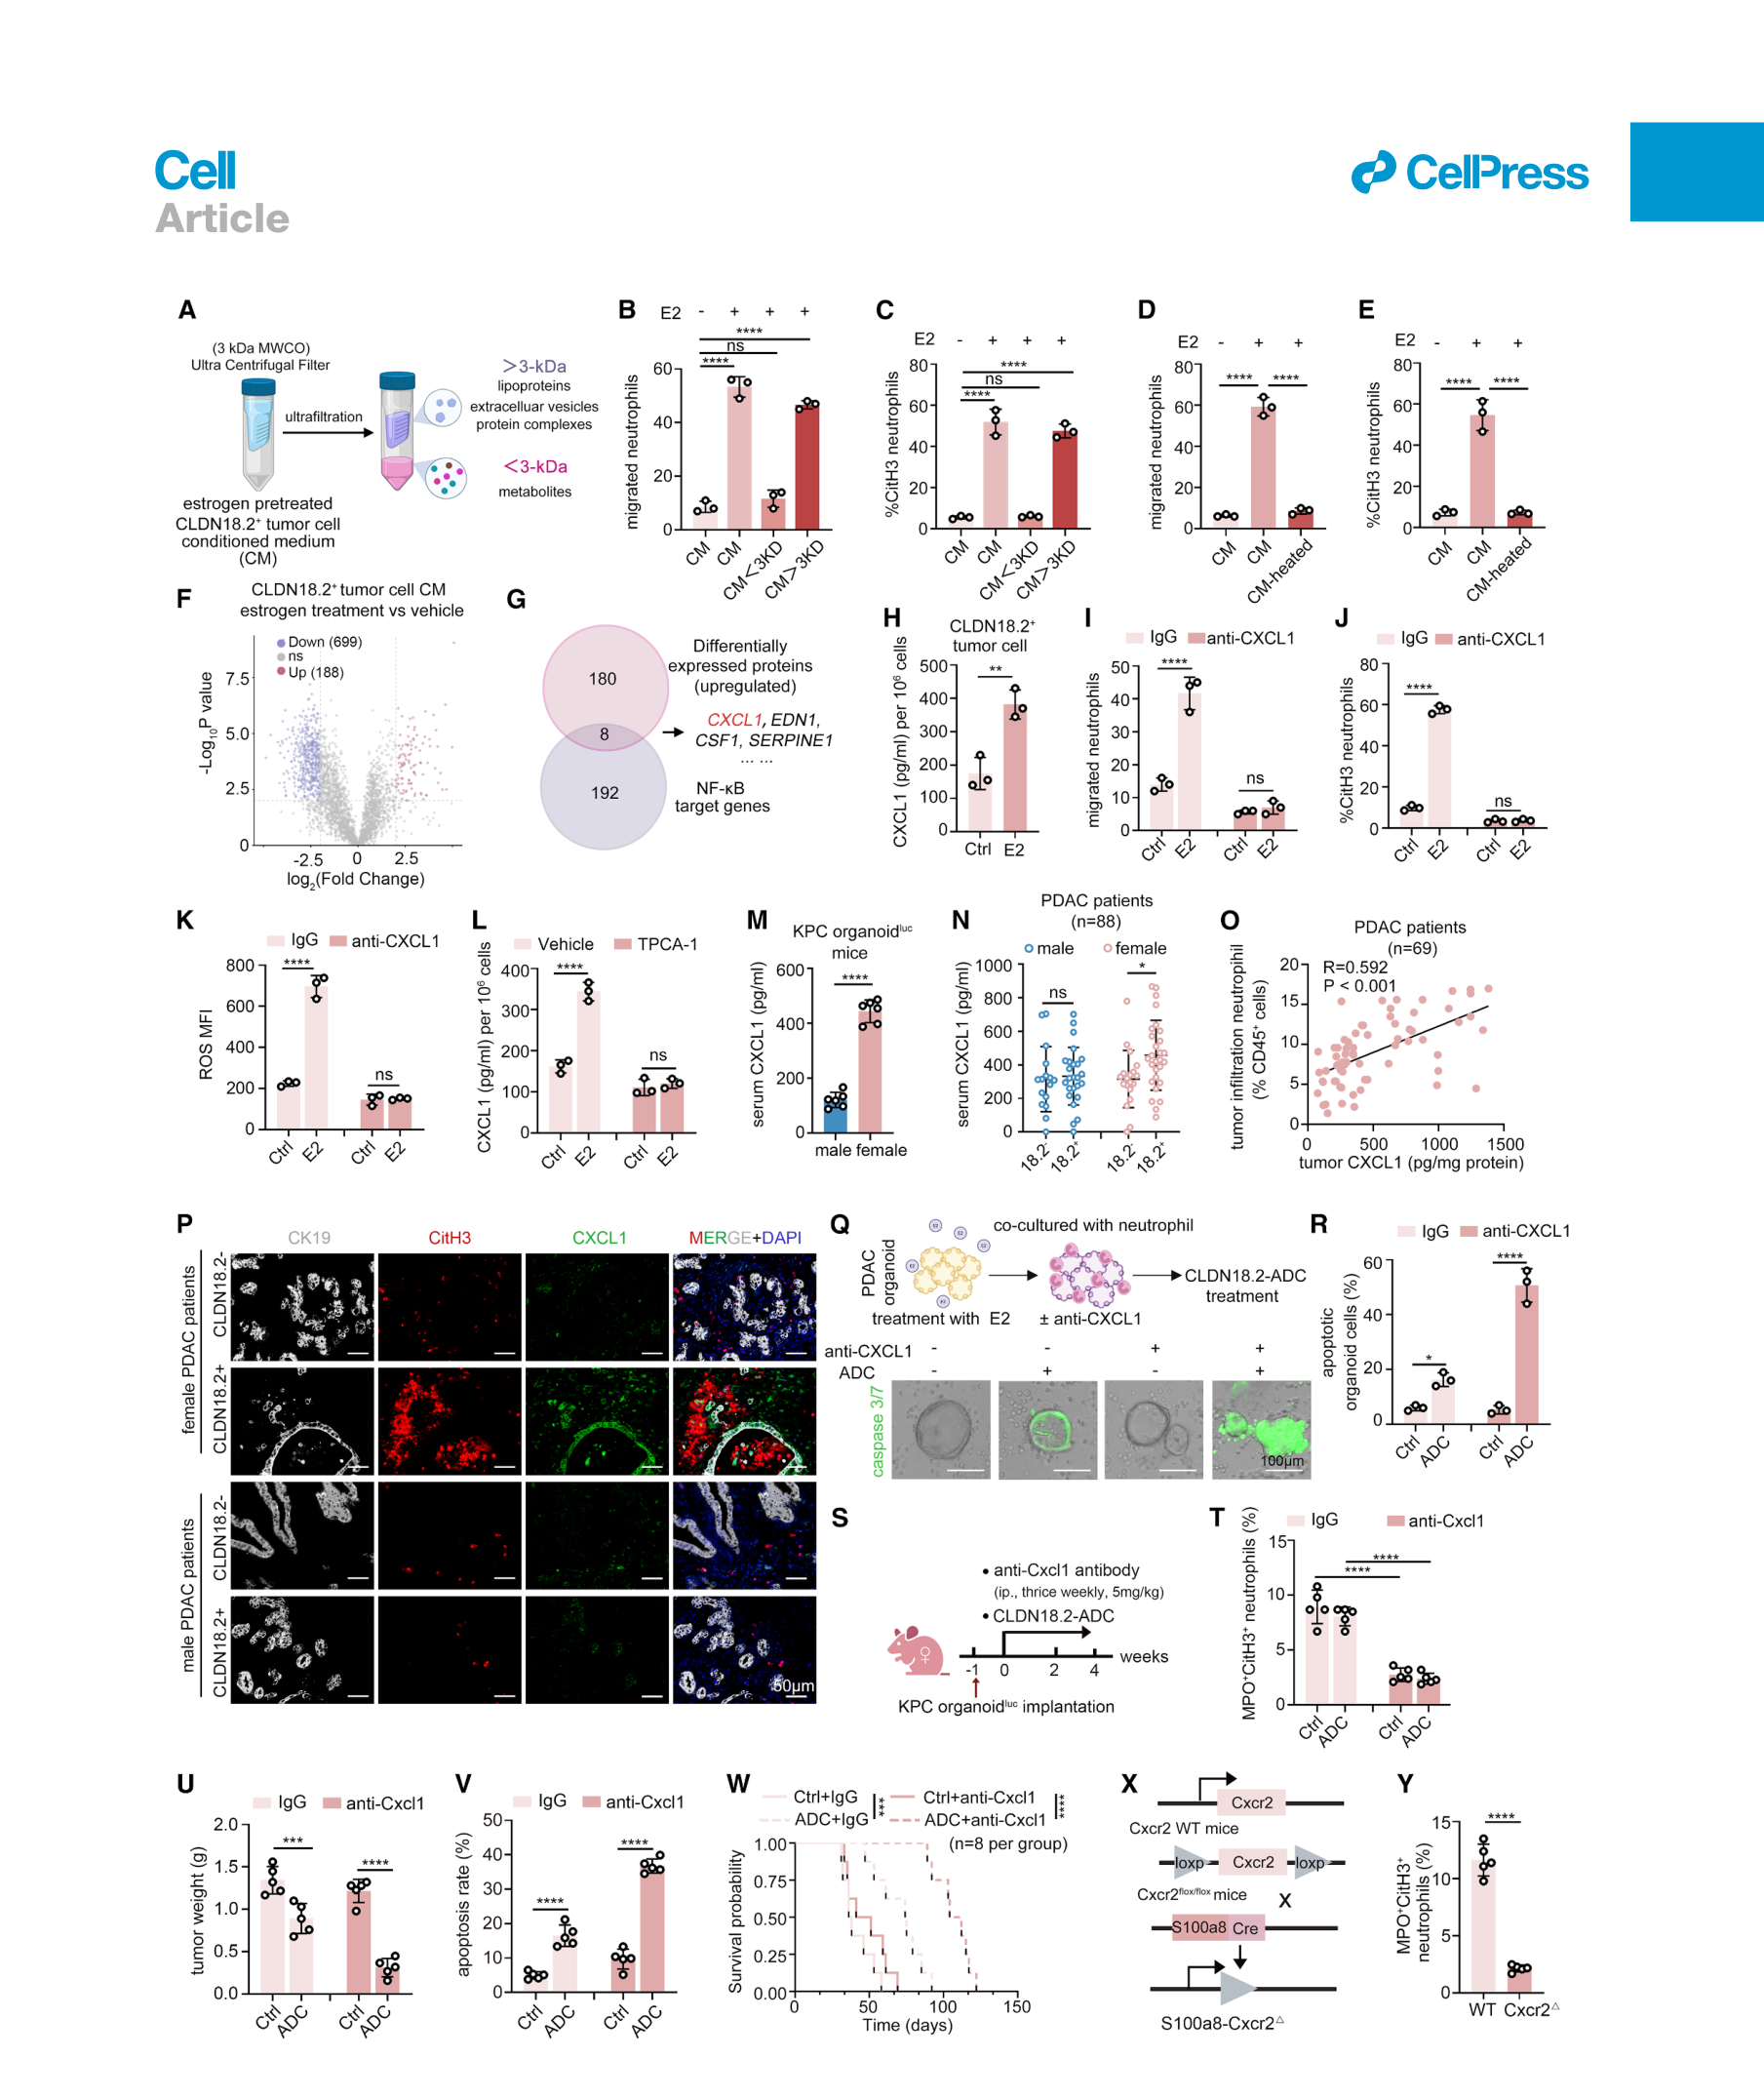
分泌组与NF-κB靶基因交叉筛选后,作者聚焦CXCL1。E2增加肿瘤细胞CXCL1分泌;CXCL1中和可降低中性粒细胞迁移、ROS和NET形成,并增强ADC杀伤。中性粒细胞Cxcr2缺失进一步支持这一信号连接。(图6a–m、q–y)
临床样本中,88例PDAC的血清分析显示,女性患者CLDN18.2阳性组的CXCL1高于阴性组,男性患者的对应比较未达显著;另一个69例组织分析显示肿瘤CXCL1与中性粒细胞浸润比例正相关(图中R=0.592,P<0.001)。两个检测集合分别报告,不累加为疗效试验人群。(图6n–p)
抑制NET在模型中增强抗体治疗
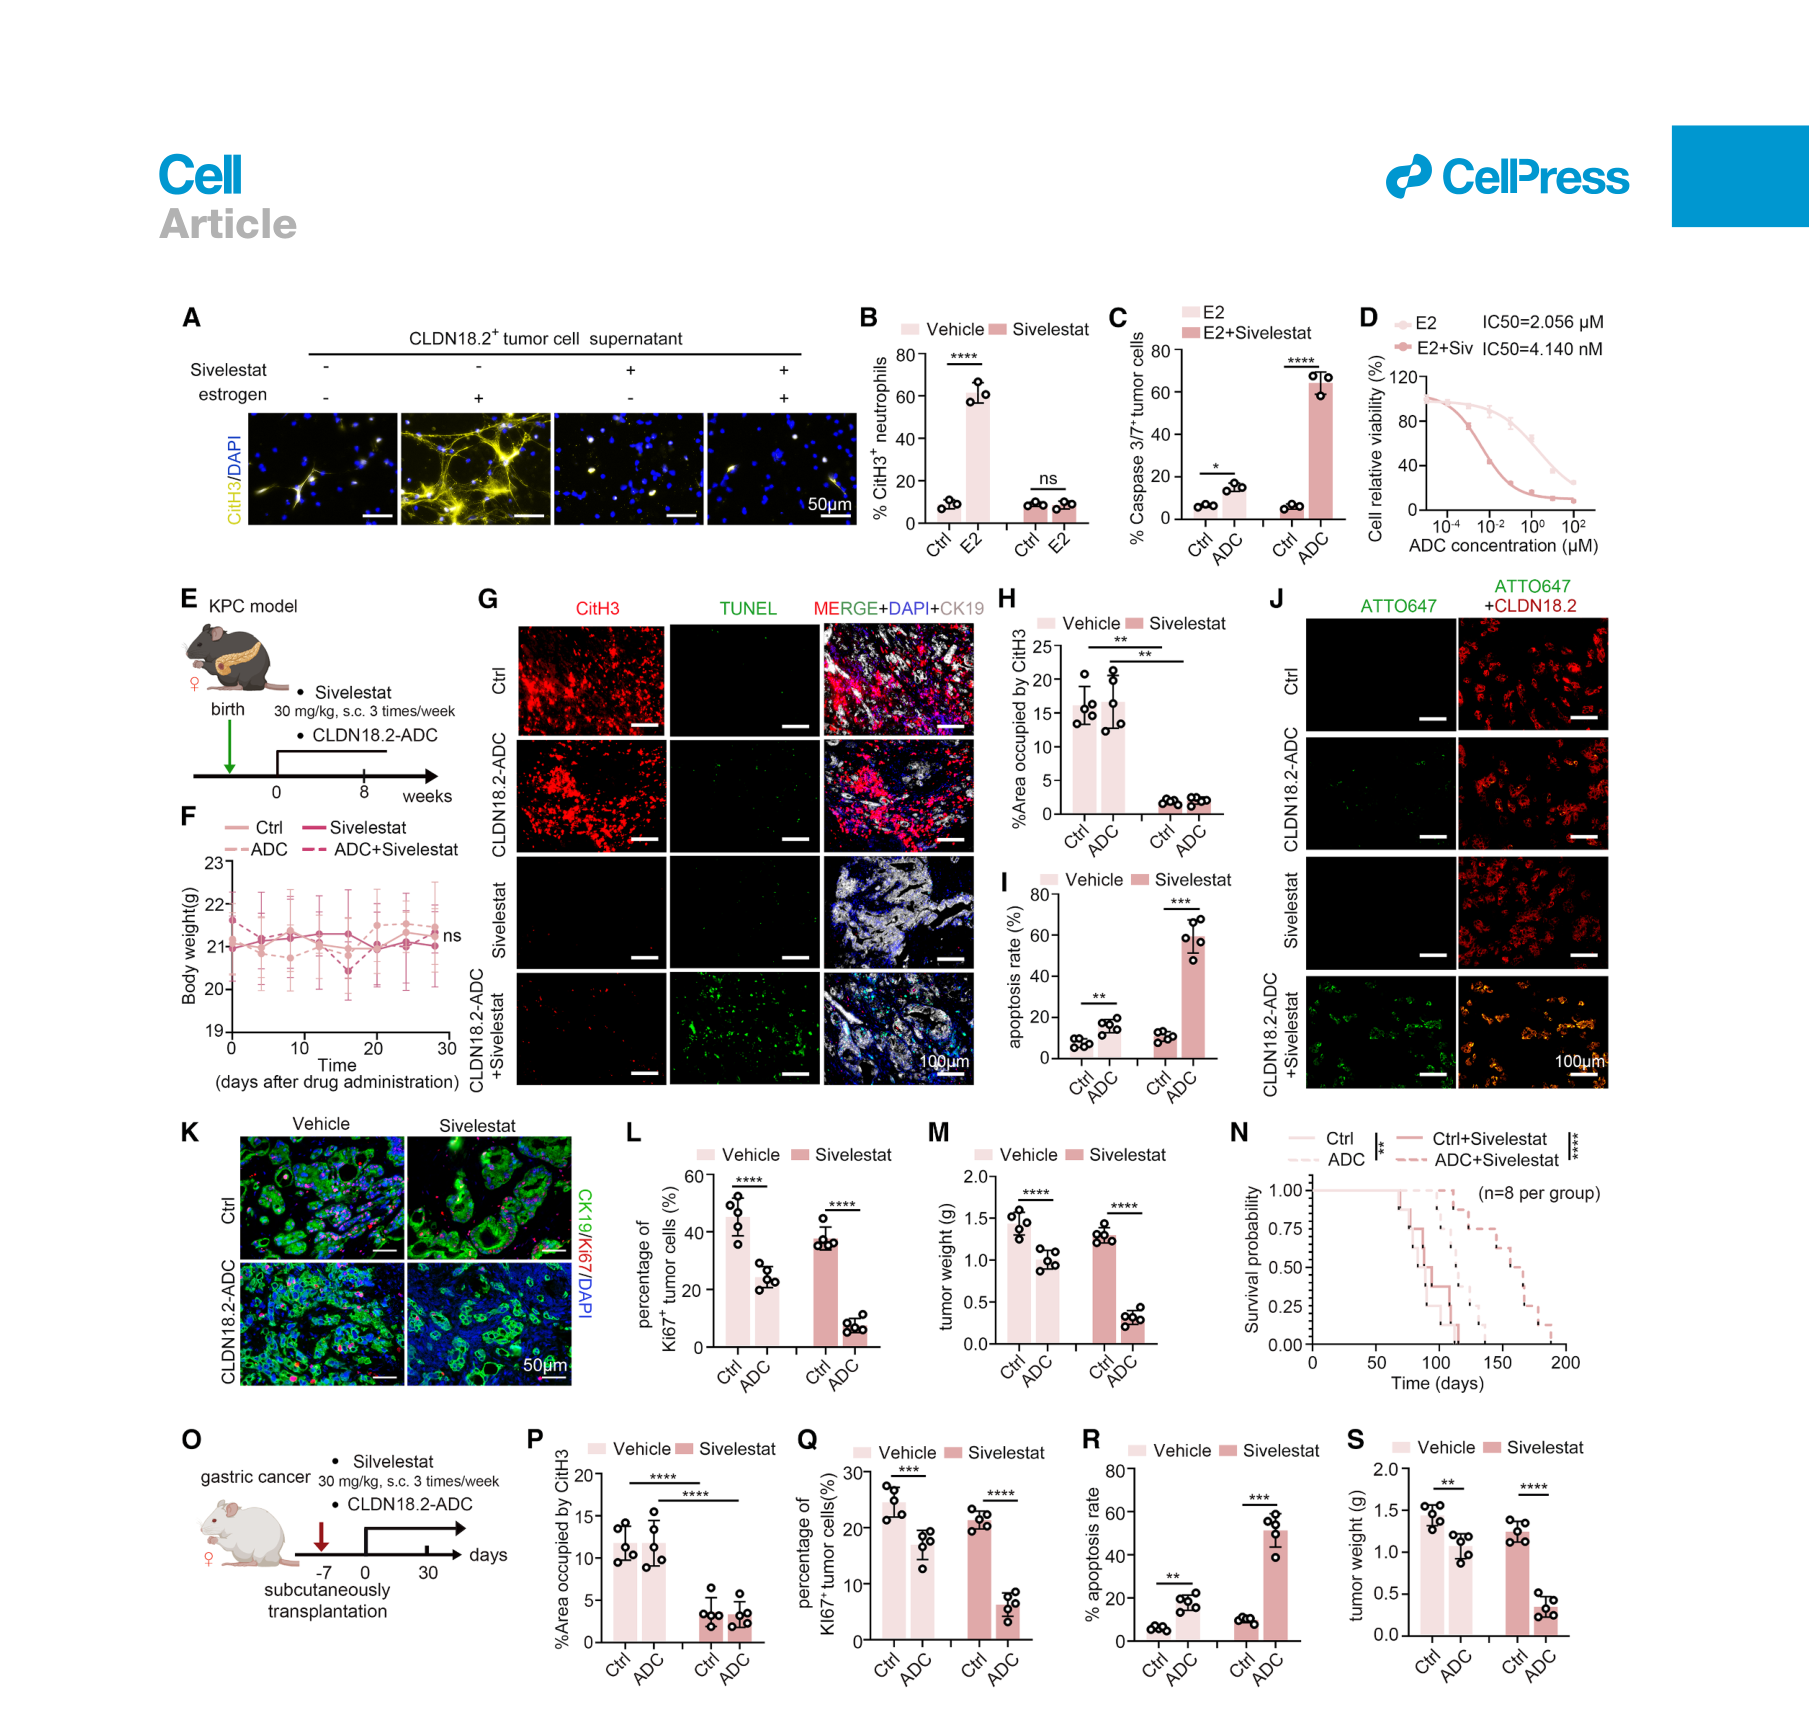
中性粒细胞弹性蛋白酶抑制剂sivelestat可减少NET形成,提高ADC接触肿瘤细胞的信号和杀伤。在雌性KPC小鼠中,联合CLDN18.2-ADC减少肿瘤负荷并延长生存;胃癌移植模型也观察到药效增强。图7多数组织和肿瘤定量每组5只,生存每组8只。(图7)
在GPER1较高、STING已激活的胃癌及结直肠癌PDX中,作者另外用T-DXd检验NET对药物可及性的限制;在人工表达人TROP2或NECTIN4的胰腺癌模型中,也测试了Dato-DXd和enfortumab vedotin。各延伸实验对应具体抗原、药物与模型。(补图S9、S10、S13)
患者队列提供NET与治疗反应的关联
作者按治疗前组织MPO⁺CitH3⁺面积分为NET高、低组,在三个独立队列中比较疗效。各队列使用自己的分界值,终点也不同。(补图S4;补表S4–S9)
| 队列与治疗 | 总人数 | NET高组 | NET低组 | 终点及比较 |
|---|---|---|---|---|
| 晚期尿路上皮癌,enfortumab vedotin单药 | 46 | 5/26,19.2% | 12/20,60.0% | 客观缓解率;P=0.005 |
| HER2阳性乳腺癌,曲妥珠单抗为基础的新辅助治疗 | 55 | 6/28,21.4% | 18/27,66.7% | 病理完全缓解率;P<0.001 |
| RAS野生型转移性CRC,西妥昔单抗为基础的治疗 | 38 | 2/19,10.5% | 8/19,42.1% | 客观缓解率;P=0.027 |
NET高组的面积阈值依次为≥8%、≥5.1%、≥3.5%。表内P值来自补表的Pearson χ²比较;这些结果支持NET丰度与治疗反应存在关联,临床性别效应及治疗与性别的交互作用尚待前瞻性研究。
局限与待解问题
- 雌雄药效差异和NET干预的因果链主要建立于临床前模型。患者队列比较NET高低,尚未完成预设的性别分层及治疗×性别交互检验。
- 55对PDX中,每个病例每种受体性别仅1只小鼠;统计已按病例配对或聚类处理,但模型建立成功、CLDN18.2阳性等条件仍影响适用范围。
- NET的空间覆盖及药物滞留有实验支持;DNA、组蛋白和颗粒蛋白分别如何影响药物扩散、结合与释放,仍需更直接的定量。
- sivelestat联合方案尚属模型研究。体重与主要器官H&E未见明显异常,临床联合治疗的疗效、长期毒性及给药方案仍需专门评估。(补图S11)
- STING输出受肿瘤类型与信号背景影响,其他细胞来源的STING作用、雌激素水平的连续变化,以及不同ADC载荷和连接子的差异尚未充分展开。
新线索
本文提示,评价ADC时可以把“靶点表达”与“靶点可及性”作为两个相互关联的变量。一个值得追踪的问题是:在抗原表达相近的患者中,NET及相关空间结构能否提供额外分层信息。需要将药物分布、组织NET、靶点表达和临床反应在同一患者中配对验证。
相关原始研究:CXCR1/CXCR2–NET与免疫细胞杀伤,Immunity,2020,研究肿瘤诱导NET对免疫细胞接触及杀伤的影响。本次核实题名与摘要,未独立全文精读。
主图与表格 · 7 张
图1 · PDF 第 3 页
Figure 1. A paired ‘‘phase II-like’’ PDX preclinical trial reveals sex-dimorphic responses to CLDN18.2-ADC (A) Design of the hCD34+ humanized PDX preclinical trial. (B) Waterfall plot of the best tumor volume change from baseline (best response, defined as the minimum percentage change recorded from day 10 to day 21 after treatment initiation) in CLDN18.2-ADC-treated PDX recipients. Responses were classified according to mRECIST criteria. (C) Objective response rates stratified by recipient sex, donor sex, age, CA19-9 level, differentiation, and CLDN18.2 expression. Response was defined as mCR or mPR; non-response was defined as mSD or mPD. (D) mRECIST response distribution by recipient sex (n = 55 per sex). (E and F) Representative annexin V/PI flow cytometry (E) and quantification of apoptotic tumor cells (F) in treated PDX tumors. (G) CLDN18.2-ADC treatment scheme in male and female spontaneous KPC mice. (H and I) Gross tumor images (H), tumor weight, and tumor inhibition rate (I) in KPC mice (n = 5 per group). (J and K) Representative immunofluorescence images (J) and quantification (K) of Ki67+ tumor cells in KPC mice (n = 5 per group). Scale bars, 50 μm. (L–N) Tumor-cell apoptosis by flow cytometry (L; n = 5 per group), Bax and Bcl-2 immunoblotting (M; n = 5 per group), and Kaplan-Meier survival (N; n = 8 per group) in KPC mice. (O) Treatment scheme for subcutaneous MKN45-CLDN18.2 tumor cell xenografts in male and female mice. (P–S) Tumor growth (P), tumor weight (Q), Ki67+ tumor cells (R), and tumor-cell apoptosis (S) in the gastric cancer model (n = 5 per group). Data are presented as mean ± SD. Unpaired two-tailed Student’s t test (I) (tumor inhibition); paired two-tailed Student’s t test (F); Brown-Forsythe and Welch ANOVA with Dunnett’s T3 correction (I) (tumor weight) and (L); ordinary one-way ANOVA with multiple comparisons (K and Q–S); two-way repeated-measures ANOVA with Geisser-Greenhouse correction and multiple-comparison correction (P); log-rank (Mantel-Cox) test (N). A two-sided exact McNemar test was used for paired binary comparisons of recipient sex, and Rao-Scott chi-square tests with adjustment for PDX-level clustering were used for other categorical variables (C). The Stuart-Maxwell test was used for paired ordinal mRECIST response categories (D). ns, not significant; *p < 0.05, **p < 0.01, ***p < 0.001, ****p < 0.0001. See also Figure S1 and Tables S1–S3.
图2 · PDF 第 5 页
Figure 2. Estrogen, but not androgen, drives sex-dimorphic resistance to CLDN18.2-ADC (A and B) Serum testosterone (A) and estradiol (B) levels in male mice after sham surgery or ORX, and in female mice after sham surgery or OVX, respectively (n = 5 per group) (C) Experimental design of gonadectomy and CLDN18.2-ADC treatment in the KPC cell line orthotopic tumor model. (D–G) Tumor growth (D), tumor inhibition (E), tumor-cell apoptosis (F), and Kaplan-Meier survival (G) in SHAM and ORX male mice treated with the control or CLDN18.2-ADC (n = 5 per group for D–F; n = 8 per group for G). (H–K) Tumor growth (H), tumor inhibition (I), tumor-cell apoptosis (J), and survival (K) in SHAM and OVX female mice treated with the control or CLDN18.2-ADC (n = 5 per group for H–J; n = 8 per group for K). (L) Schematic of 17β-estradiol replacement in OVX female mice bearing orthotopically implanted KPC cell line tumors. (M) Serum estradiol levels in SHAM, OVX, and OVX+E2 mice (n = 5 per group). (N–Q) Tumor growth curves in OVX and OVX+E2 mice treated with the control or CLDN18.2-ADC (n = 5 per group). (R–U) Tumor weight and tumor inhibition (R), Ki67+ tumor cells (S), tumor-cell apoptosis (T), and survival (U) in OVX and OVX+E2 mice treated with the control or CLDN18.2-ADC (n = 5 per group for R–T; n = 8 per group for U). Data are presented as mean ± SD. Unpaired two-tailed Student’s t test (A, B, E, and I) and for tumor inhibition (R); ordinary one-way ANOVA with multiple comparisons (F) and for tumor weight (R); Brown-Forsythe and Welch ANOVA with Dunnett’s T3 correction (J, M, S, and T); a two-way repeated-measures ANOVA with Geisser-Greenhouse correction and multiple-comparison correction (D and H); log-rank (Mantel-Cox) test (G, K, and U). ns, not significant; *p < 0.05, **p < 0.01, ***p < 0.001, ****p < 0.0001. See also Figure S1.
图3 · PDF 第 7 页
Figure 3. Estrogen induces neutrophil-dependent resistance to CLDN18.2-ADC (A) Experimental design for scRNA-seq of tumor-infiltrating CD45+ cells from SHAM and OVX female mice bearing KPC organoidluc tumors (n = 3 per group). (B–D) Single-cell RNA sequencing analysis of tumor-infiltrating CD45+ cells, including UMAP visualization of 41,260 cells (B), canonical marker expression (C), and the proportions of major cell populations (D). (E and F) Uniform manifold approximation and projection (UMAP) of neutrophils (E) and Gene Ontology analysis of differentially expressed genes (F) between SHAM and OVX groups. (G and H) Representative flow cytometry (G) and quantification (H) of tumor-infiltrating neutrophils (n = 5 per group). (I) Flow-cytometric analysis of tumor-infiltrating neutrophils after vehicle or E2 treatment in OVX female mice (n = 5 per group). (J and K) Representative multiplex immunofluorescence staining (J) and Ly6G+ neutrophil quantification (K) after vehicle or E2 treatment (n = 5 per group). Scale bars, 100 μm. (L) Experimental design for anti-Ly6G-mediated neutrophil depletion in female mice bearing KPC organoidluc tumors. (M) Peripheral-blood neutrophils after isotype or anti-Ly6G treatment (n = 10 per group). (N–P) Tumor weight (N), tumor-cell apoptosis (O), and Kaplan-Meier survival (P) after neutrophil depletion and CLDN18.2-ADC treatment (n = 5 per group for N and O; n = 8 per group for P). (Q) Experimental design for the adoptive transfer of bone-marrow-derived neutrophils into S100a8-DTA female mice bearing KPC organoidluc tumors. (R and S) Representative bioluminescence images (R) and tumor total flux (S) after vehicle or neutrophil transfer (n = 5 per group). (T–X) Effects of neutrophil transfer on tumor growth and survival, including tumor weight (T), apoptosis (U), Ki67 staining (V) and quantification (W), and Kaplan- Meier analysis (X) (n = 5 per group for T, U, and W; n = 8 per group for X). Scale bars, 50 μm. Data are presented as mean ± SD. Unpaired two-tailed Student’s t test (H, I, K, and M); ordinary one-way ANOVA with multiple comparisons (N, T, and W); Brown- Forsythe and Welch ANOVA with multiple comparisons (O, S, and U); log-rank (Mantel-Cox) test (P and X). *p < 0.05, **p < 0.01, ***p < 0.001, ****p < 0.0001. See also Figure S2.
图4 · PDF 第 9 页
Figure 4. Estrogen-induced NET formation restricts tumor-antigen accessibility and impairs ADC cytotoxicity (A) Heatmap of gene expression based on RNA sequencing of tumor-infiltrating neutrophils isolated from SHAM and OVX female mice (n = 3 per group). (B and C) Representative flow-cytometry histograms (B) and quantification (C) of neutrophil ROS levels detected by H2DCFDA staining (n = 5 per group). (D) Flow-cytometric analysis of Ly6G+MPO+ neutrophils in SHAM and OVX tumors (n = 5 per group). (E and F) CitH3+MPO+ cell quantification (E) and representative multiplex immunofluorescence staining (F) in SHAM and OVX tumors (n = 5 per group). Scale bars, 100 μm. (G) Experimental design of the tumor cell-neutrophil co-culture assay with estrogen and CLDN18.2-ADC treatment. (H) Scanning electron microscopy images of NETs with or without E2 treatment. Scale bars, 10 μm. (I) Representative fluorescence images of NETs and tumor-cell apoptosis with or without E2 treatment. Scale bars, 15 μm. (J) CLDN18.2-ADC dose-response curves with or without E2 treatment. (K) Schematic of ATTO647 labeling of CLDN18.2-ADC. (L) Representative fluorescence images and quantification of tumor-cell-associated ATTO647-ADC in tumor cell-neutrophil co-cultures (n = 15 wells per group). ATTO647-labeled ADC is shown in green pseudocolor, tumor cells in red pseudocolor, and NETs in blue pseudocolor. Scale bars, 10 μm. (M) Experimental design of in vivo ATTO647-ADC tracing in SHAM and OVX mice bearing KPC organoidluc tumors. (N and O) Representative immunofluorescence images (N) and quantification (O) of intratumoral ATTO647-ADC localization (n = 5 per group). Scale bars, 50 μm. (P) Model of NET-mediated functional antigen shielding. (Q) Generation of neutrophil-lineage Padi4-deficient (S100a8-Padi4Δ) mice. (R–T) Representative immunofluorescence images (R), CitH3-occupied tumor area (S), and tumor-cell apoptosis (T) in wild-type (WT) and S100a8-Padi4Δ female mice treated with the control or CLDN18.2-ADC (n = 5 per group). Scale bars, 50 μm. (U–W) Representative bioluminescence images (U), tumor total flux (V), and Kaplan-Meier survival (W) in WT and S100a8-Padi4Δ female mice (n = 5 per group for U and V; n = 8 per group for W). Data are presented as mean ± SD. Unpaired two-tailed Student’s t test (D, E, and O); Mann-Whitney U test (L); ordinary one-way ANOVA with multiple com parisons (S); Brown-Forsythe and Welch ANOVA with multiple comparisons (C, T, and V); four-parameter nonlinear regression model (J); log-rank (Mantel-Cox) test (W). *p < 0.05, **p < 0.01, ***p < 0.001, ****p < 0.0001. See also Figures S3–S5 and Tables S4–S9.
图5 · PDF 第 11 页
Figure 5. Estrogen redirects tumor-cell STING signaling toward NF-κB to promote NET formation (A–C) Experimental scheme (A), representative immunofluorescence images (B), and quantification (C) of NET formation in neutrophils cultured alone or co- cultured with tumor cells with or without E2 treatment (n = 3). Scale bars, 50 μm. (D–F) Experimental scheme (D), representative images of neutrophil migration and NET immunofluorescence staining (E), and quantification (F) of NET formation in neutrophils treated with conditioned media from CLDN18.2- or CLDN18.2+ tumor cells with or without E2 treatment (n = 3). Scale bars, 50 μm. (G–I) Design of STING inhibition with SN-011 (G) and quantification of CitH3+ neutrophils (H) and neutrophil migration (I) after exposure to conditioned media from CLDN18.2+ tumor cells (n = 3). (J–L) Quantification of MPO+CitH3+ cells (J), the experimental design (K), and representative immunofluorescence images (L) in SHAM and OVX mice bearing WT or Sting1-knockout (KO) KPC organoidluc tumors (n = 5 per group). Scale bars, 50 μm. (M) Schematic of STING signaling through the TBK1-IRF3/type I interferon and IKK-NF-κB axes. (N) Heatmap of RT-qPCR analysis of NF-κB-related and interferon-response genes in CLDN18.2+ tumor cells treated with vehicle or E2 (n = 3). (O) Immunoblot analysis of STING pathway signaling in CLDN18.2+ tumor cells with or without E2 treatment. (P–R) Representative immunofluorescence images of NET staining and neutrophil migration (P), quantification of CitH3+ neutrophils (Q), and neutrophil migration (R) after exposure to conditioned media from CLDN18.2+ tumor cells treated with estrogen and/or TPCA-1 (n = 3). Scale bars, 50 μm. (S and T) CitH3+ neutrophils (S) and neutrophil migration (T) after exposure to conditioned media from CLDN18.2+ tumor cells treated with E2 and/or GSK8612 (n = 3). (U and V) The TPCA-1 treatment scheme (U) and representative immunofluorescence images with the quantification of intratumoral NET formation (V) in female mice bearing KPC organoidluc tumors (n = 5 per group). Scale bars, 100 μm. Data are presented as mean ± SD. Unpaired two-tailed Student’s t test (V); ordinary one-way ANOVA with multiple comparisons (C, F, H, I, and Q–T); Brown- Forsythe and Welch ANOVA with multiple comparisons (J). ns, not significant; *p < 0.05, **p < 0.01, ***p < 0.001, ****p < 0.0001. See also Figures S6–S10.
图6 · PDF 第 13 页
Figure 6. CXCL1 from estrogen-reprogrammed tumor cells promotes CXCR2-dependent NET formation (A–C) Size fractionation of conditioned medium from estrogen-treated CLDN18.2+ tumor cells using a 3-kDa molecular-weight cutoff filter (A), followed by quantification of neutrophil migration (B) and CitH3+ neutrophils (C) in response to the <3-kDa and >3-kDa fractions (n = 3). (D and E) Quantification of neutrophil migration (D) and CitH3+ neutrophils (E) in response to untreated or heat-inactivated conditioned medium (n = 3). (F and G) Secretome proteomics of vehicle- and estrogen-treated CLDN18.2+ tumor cells (F) and the overlap of differentially expressed proteins with NF-κB target genes defined by the HALLMARK_TNFA_SIGNALING_VIA_NFKB gene set (G). (H) CXCL1 concentrations in the conditioned medium measured by ELISA (n = 3). (I–K) Neutrophil migration (I), CitH3+ neutrophils (J), and ROS levels (K) after exposure to the conditioned medium with IgG or CXCL1-neutralizing antibody (n = 3). (L) CXCL1 secretion after E2 and/or TPCA-1 treatment measured by ELISA (n = 3). (M and N) Serum CXCL1 levels in male and female KPC organoidluc-bearing mice (M; n = 6 per group) and in patients with CLDN18.2−or CLDN18.2+ PDAC (N; n = 88). (O) Association between tumor CXCL1 levels and neutrophil infiltration in patients with PDAC (n = 69). (P) Representative multiplex immunofluorescence images of CXCL1 and NET formation in CLDN18.2−and CLDN18.2+ PDAC. Scale bars, 50 μm. (Q and R) Experimental design and representative images (Q), with quantification of PDAC organoid apoptosis (R), after neutrophil co-culture and CLDN18.2-ADC treatment with or without a CXCL1-neutralizing antibody (n = 3). Scale bars, 100 μm. (S–W) Treatment scheme (S), intratumoral MPO+CitH3+ neutrophils (T), tumor weight (U), tumor-cell apoptosis (V), and Kaplan-Meier survival (W) after CXCL1 neutralization and CLDN18.2-ADC treatment (n = 5 per group for T–V; n = 8 per group for W). (X and Y) Generation of neutrophil-lineage Cxcr2-deficient (S100a8-Cxcr2Δ) mice (X) and quantification of intratumoral MPO+CitH3+ neutrophils in WT and S100a8-Cxcr2Δ female mice (Y; n = 5 per group). Data are presented as mean ± SD. Unpaired two-tailed Student’s t test (H and M); Welch’s unpaired t test (Y); Mann-Whitney U test (N); ordinary one-way ANOVA with multiple comparisons (B–E, I–L, R, and T–V); linear regression analysis (O); log-rank (Mantel-Cox) test (W). ns, not significant; *p < 0.05, **p < 0.01, ***p < 0.001, ****p < 0.0001.
图7 · PDF 第 15 页
Figure 7. Sivelestat-mediated NET inhibition enhances CLDN18.2-ADC efficacy in pancreatic and gastric cancer models (A and B) Representative immunofluorescence images (A) and CitH3+ neutrophil quantification (B) in neutrophils treated with conditioned media from E2-treated CLDN18.2+ tumor cells with or without sivelestat (n = 3). Scale bars, 50 μm. (C) Tumor-cell apoptosis in tumor cell-neutrophil co-cultures treated with CLDN18.2-ADC with or without sivelestat under E2 stimulation (n = 3). (D) CLDN18.2-ADC dose-response curves in tumor cell-neutrophil co-cultures treated with E2 and/or sivelestat (n = 3). (E and F) The treatment scheme (E) and body weight (F) of female KPC mice receiving CLDN18.2-ADC and/or sivelestat (n = 5 per group). (G–I) Representative immunofluorescence images (G), CitH3-occupied tumor area (H), and tumor-cell apoptosis (I) in KPC tumors (n = 5 per group). Scale bars, 100 μm. (J) Representative images of the intratumoral localization of ATTO647-labeled CLDN18.2-ADC. Scale bars, 100 μm. (K–N) Representative CK19/Ki67 immunofluorescence (K), Ki67+ tumor cells (L), tumor weight (M), and Kaplan-Meier survival (N) in female KPC mice (n = 5 per group for L and M; n = 8 per group for N). Scale bars, 50 μm. (O–S) The treatment scheme of subcutaneous MKN45-CLDN18.2 tumor-cell xenografts established in humanized mice (O), CitH3-occupied tumor area (P), Ki67+ tumor cells (Q), tumor-cell apoptosis (R), and tumor weight (S) after CLDN18.2-ADC and/or sivelestat treatment (n = 5 per group). Data are presented as mean ± SD. Ordinary one-way ANOVA with multiple comparisons (B, C, L, M, P, Q, and S); Brown-Forsythe and Welch ANOVA with multiple comparisons (H, I, and R); two-way repeated-measures ANOVA (F); four-parameter nonlinear regression (D); log-rank (Mantel-Cox) test (N). ns, not significant; *p < 0.05, **p < 0.01, ***p < 0.001, ****p < 0.0001. See also Figures S11–S13.
完整阅读记录与证据表
文献卡:雌激素、NET与ADC可及性
- Paper ID:p-0042-art-sting-reprogramming-estrogen-promotes
- 分析日期:2026-11-03;article-read、morning-report、pdf、spreadsheets、web-publish。
- 原文:Cell 189, 6752–6770.e21,在线2026-10-06,刊期2026-10-15;DOI 10.1016/j.cell.2026.09.031。
- 读取范围:41页主PDF的科研正文、方法、全部主图及图注;31页补充PDF中的13补图、11补表。参考书目仅检索相关条目,未逐篇另读;组学原始数据和统计未独立复现,详见coverage.md。
- 晨会日期:2026-11-04;接收与分析日期保持2026-11-03。
- 人工核对:pending。图表清单见figures/README.md,共45 PNG,网页选7主图。
一句话结论
在CLDN18.2阳性胰腺癌等临床前模型中,雌激素使肿瘤STING输出偏向NF-κB–CXCL1,促进中性粒细胞胞外诱捕网形成,降低ADC到达靶点的机会;靶向NET的干预可改善所测模型药效。
研究问题与背景
本文研究靶抗原表达相近时的药效差异,重点是受体小鼠的激素环境、肿瘤细胞信号和中性粒细胞之间的联系。NET是细胞外DNA与蛋白构成的结构,文中检验其是否限制抗体与细胞表面靶点接触。既往NET对免疫细胞杀伤的影响作为背景,本文主要增加对抗体药物定位和可及性的功能证据。
贡献与比较对象
- 以同一个患者来源肿瘤在雌雄人源化小鼠中的成对比较,控制部分肿瘤固有差异。
- 以性腺切除、E2补回、中性粒细胞清除/补入及NET遗传干预,定位微环境因素。
- 以STING分支信号、蛋白互作及转录调控实验连接肿瘤信号与CXCL1。
- 将sivelestat联合效应与多个特定抗体治疗模型相连;患者队列提供NET与疗效的关联。
方法与验证
| 层次 | 设计及比较 | 主要终点 |
|---|---|---|
| PDX配对 | 81份PDAC筛查,55成功建模病例;每病例雌雄各1只,共110受体;均接受CLDN18.2-ADC | 21天内小鼠改良疗效分类,配对McNemar与病例聚类GEE |
| 微环境功能 | KPC自发/原位、类器官移植及人源化模型;SHAM/OVX、E2、中性粒细胞及Padi4干预 | 肿瘤负荷、凋亡、增殖、ADC定位及独立生存队列 |
| 信号机制 | 肿瘤Sting1/TRAF6、GPER1药理、CREB1启动子占据与报告、CXCL1中和及中性粒细胞Cxcr2缺失 | STING下游分支、分泌、迁移、NET和药物可及性 |
| 临床关联 | 46例尿路上皮癌、55例HER2阳性乳腺癌、38例RAS野生型转移CRC | 各自NET阈值下的ORR或pCR;不合并队列与终点 |
核心证据
| 主张或结果 | 数字、单位、条件 | PDF页序/图表 | 依据类型 | 核对状态 |
|---|---|---|---|---|
| 受体性别与模型药效相关 | 55对;雄44/55(80%),雌22/55(40%);配对exact McNemar P<0.0001 | 主PDF3–4,图1a–f;补PDF22–24,S1–3 | 原图、正文及表格 | 已核;模型反应非患者ORR |
| 聚类调整仍有差异 | female vs male OR 0.166,95% CI 0.09–0.32,P<0.001;调整供者性别及抗原表达,PDX为聚类单位 | 补表S3,补PDF24;Methods41 | 表格及方法 | 已核;保留OR方向 |
| 激素干预定位E2 | 去势主要药效差异NS,OVX改善,E2补回削弱;组织/肿瘤n5,生存n8/组 | 主PDF5–6,图2 | 原图、图注及正文 | 已核;阴性结果保留 |
| 肿瘤细胞孤立时效应有限 | CLDN18.2表达、pHrodo内化、类器官凋亡对应比较NS | 补图S2,补PDF4–5 | 原图及完整图注 | 已核;限定实验条件 |
| 中性粒细胞作用受宿主环境影响 | scRNA每组3鼠、合计41,260细胞;雌鼠清除/补入影响药效,雄鼠补入无同样效应 | 主PDF7–8,图3;补图S2n–q | 图、正文、方法 | 已核;细胞数与动物数分开 |
| NET限制药物接触 | SEM、免疫金、ATTO647定位及杀伤;E2存在时细胞相关ADC减少 | 主PDF9–10,图4h–o;补图S3m | 原图与图注 | 已核;空间定位与结合预测分开 |
| NET功能干预改善药效 | 中性粒细胞谱系Padi4缺失;DNase I降解,在T细胞缺陷模型亦有作用 | 图4q–w;补图S5,补PDF10 | 原图、图注及正文 | 已核;未归纳所有作用均与T细胞无关 |
| 中性粒细胞GPER1不是体内全部解释 | Gper1缺失阻断体外直接E2反应,体内仍有NET/OVX差异 | 补图S6,补PDF11 | 原图及图注 | 已核 |
| CLDN18.2提供STING激活背景 | SPOP/TREX1互作、TREX1降解、胞质DNA与cGAMP升高 | 补图S7,补PDF12–13;Methods37–39 | 原图、图注、方法 | 已核;不补造全新通量 |
| STING向NF-κB偏转 | E2–GPER1–CREB1上调TRAF6、K63泛素化及IKKβ募集;IRF3募集降低;Sting1缺失及分支抑制检验 | 主PDF11–12,图5;补图S8,补PDF14–15 | 图、正文及方法 | 已核;不写成STING整体关闭 |
| CXCL1–CXCR2连接肿瘤与NET | CXCL1中和减少迁移/ROS/NET并改善ADC效应;Cxcr2谱系缺失减少NET | 主PDF13–14,图6 | 原图及图注 | 已核 |
| 人体CXCL1关联 | 血清88例,女性CLDN18.2+ vs −升高、男性对应比较NS;组织69例CXCL1与中性粒浸润图示R=0.592、P<0.001 | 图6n–p,主PDF13–14 | 原图及图注 | 已核;O面板不是NET面积,R不是R² |
| sivelestat联合的模型效应 | 雌性KPC,主要组织n5/组、生存n8/组;胃癌n5/组;体重NS、器官H&E未见明显异常 | 主PDF15–16图7;补图S11 | 原图及图注 | 已核;临床组合尚未验证 |
| NET高组临床反应较低 | EV:5/26 vs 12/20,ORR;乳腺:6/28 vs 18/27,pCR;CRC:2/19 vs 8/19,ORR | 补PDF8–9及25–29;S4,S4–S9 | 图及表格 | 已核;不同队列、终点、阈值分别写 |
| 延伸模型 | 胃/CRC的T-DXd;人工hTROP2/hNECTIN4胰腺模型的Dato-DXd/EV;CLDN18.2 mAb/BiTE | 补图S9、S10、S12、S13,补PDF16–21 | 原图、图注、正文 | 已核;不推广为所有癌种或所有ADC |
临床表S7–9的95% CI分别为:EV高6.6–39.4%、低36.1–80.9%;乳腺pCR高8.3–41.0%、低46.0–83.5%;CRC高1.3–33.1%、低20.3–66.5%。均为Clopper–Pearson区间;ORR/pCR二分类P值来自相应表的Pearson χ²检验,图S4g四分类则为Fisher–Freeman–Halton,终点与检验不互换。
局限与待解问题
作者明确指出
临床性别效应需要前瞻性预设分层和正式治疗×性别交互检验;STING重编程的普适性取决于肿瘤与细胞背景。讨论也把NET对药物的带电结构滞留作为可能机制。(主PDF16–17)
AI推断与理由
- 每病例每性别1只PDX受体,配对设计能控制部分病例差异,但仍需要扩增生物学重复及独立模型验证。
- 患者NET高低是观察关联,阈值按队列中位数划分,样本量较小且存在治疗背景差异;预测阈值及联合用药效果需要独立验证。
- NET降解、形成抑制和药物定位相互支持,但精确电荷结合与扩散贡献仍缺直接定量。分子对接能量不是测得的体内结合常数。
- sivelestat的体重和器官形态资料覆盖有限,不能据此量化长期或患者组合毒性;图7给药较早,自发模型亦需区分肿瘤形成和晚期治疗。
待核对问题与后续阅读
- 原始测序、分泌组数据及全部统计未重跑。数据登记及公开性按论文记载,未把登记当作下载和复现完成。
- 图6o按原图R及中性粒细胞/CD45分母记录;图6n按实际标注的组内CLDN18.2比较,不将其P值当作性别交互。
- 相关原始研究:CXCR1/CXCR2–NET与免疫细胞杀伤,Immunity,2020,DOI10.1016/j.immuni.2020.03.001。题名与摘要已核实,未独立全文精读。