研究问题
有T细胞浸润的肿瘤,仍可能对免疫检查点抑制剂反应有限。本文研究在透明细胞肾癌中,肿瘤细胞和癌相关成纤维细胞(CAF)如何共同维持可响应治疗的T细胞群。
作者使用患者来源的组装体(assembloid):将分开培养的肿瘤上皮细胞、CAF及肿瘤浸润免疫细胞,按对应患者的组成比例重新组合。这样可以分别去除、替换或干预其中某一部分,检验多细胞之间的功能联系。
| 研究层次 | 方法 | 主要问题 |
|---|---|---|
| 患者来源模型 | 自体组装体与原肿瘤对照、跨来源细胞替换 | 哪些细胞共同维持T细胞状态 |
| 功能路径 | 基因敲低、回补、人源化小鼠和ALI类器官 | WNT–CAF–activin A是否参与模型药效 |
| 人体材料 | 单细胞、组织染色及空间转录组 | 所测状态与临床分组如何关联 |
六例患者来源组装体重现部分临床差异
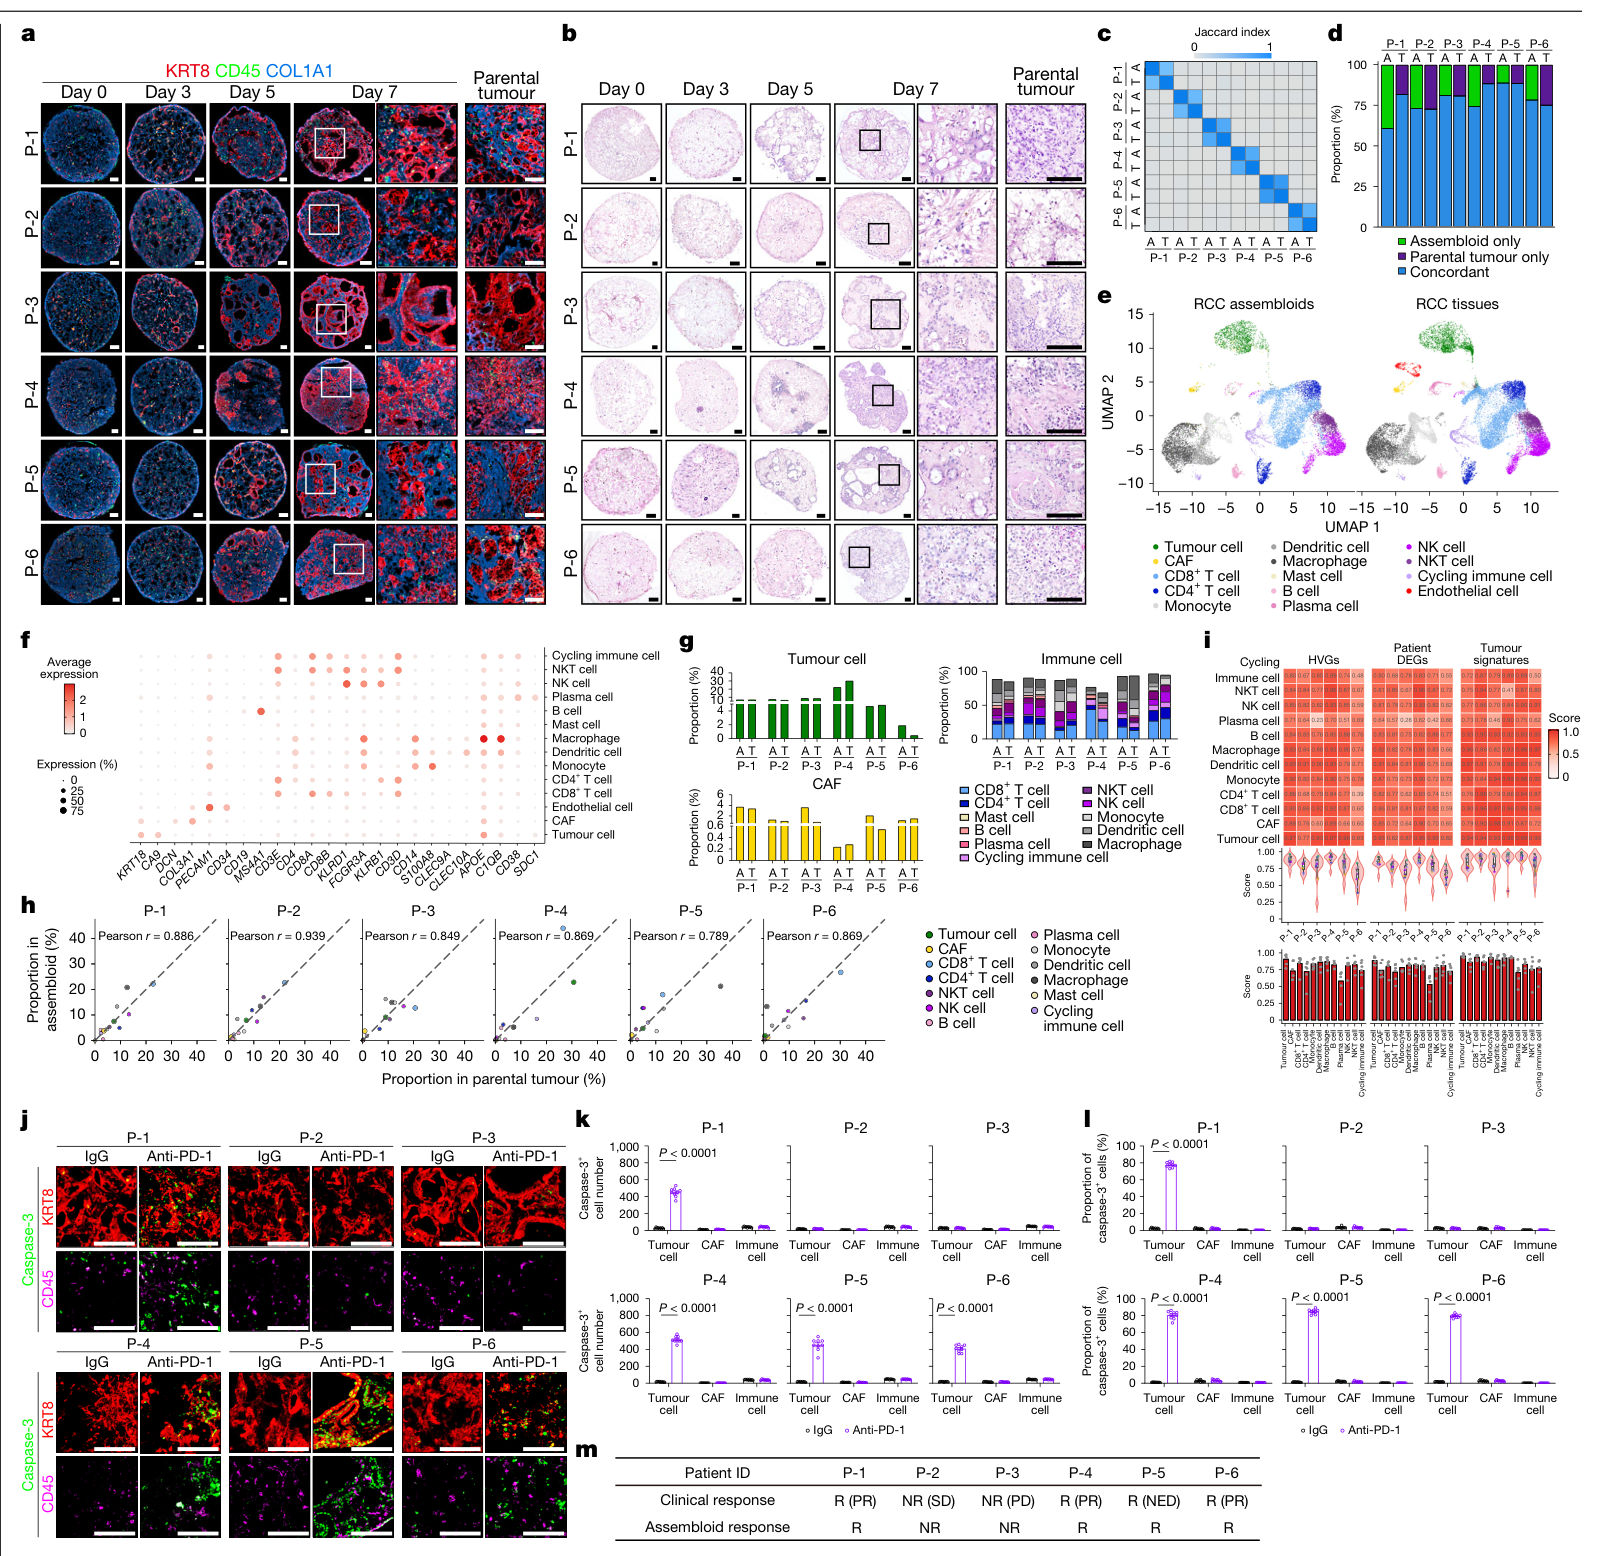
核心队列为6例患者。作者分别维持CA9⁺与CA9⁻上皮细胞、CAF和免疫细胞,组合培养7天后进行检测,再以PD-1抗体处理7天。形态、外显子突变、单细胞转录组及细胞构成比较显示,组装体保留了对应原肿瘤的主要特征。(图1;扩展图1–4;Methods,PDF第12–15页)
4例临床反应者来源的组装体出现PD-1抗体相关肿瘤细胞杀伤,2例临床非反应者来源的组装体反应有限。临床记录中,P-1、P-2、P-3、P-4及P-6接受PD-1与CTLA4联合治疗,P-5接受术后辅助PD-1治疗;P-5的“反应”标签为无疾病证据(NED),其余反应者主要为部分缓解。因此,这里的对应关系是小队列中模型表型与作者所定义临床分组的一致。(图1m;补充数据1,Patient info A1:L7)
图1凋亡定量每组来自3个独立组装体、每个分析3张切片,图中的n=9指切片层级;患者来源仍为6例。
T细胞状态受肿瘤与CAF共同维持
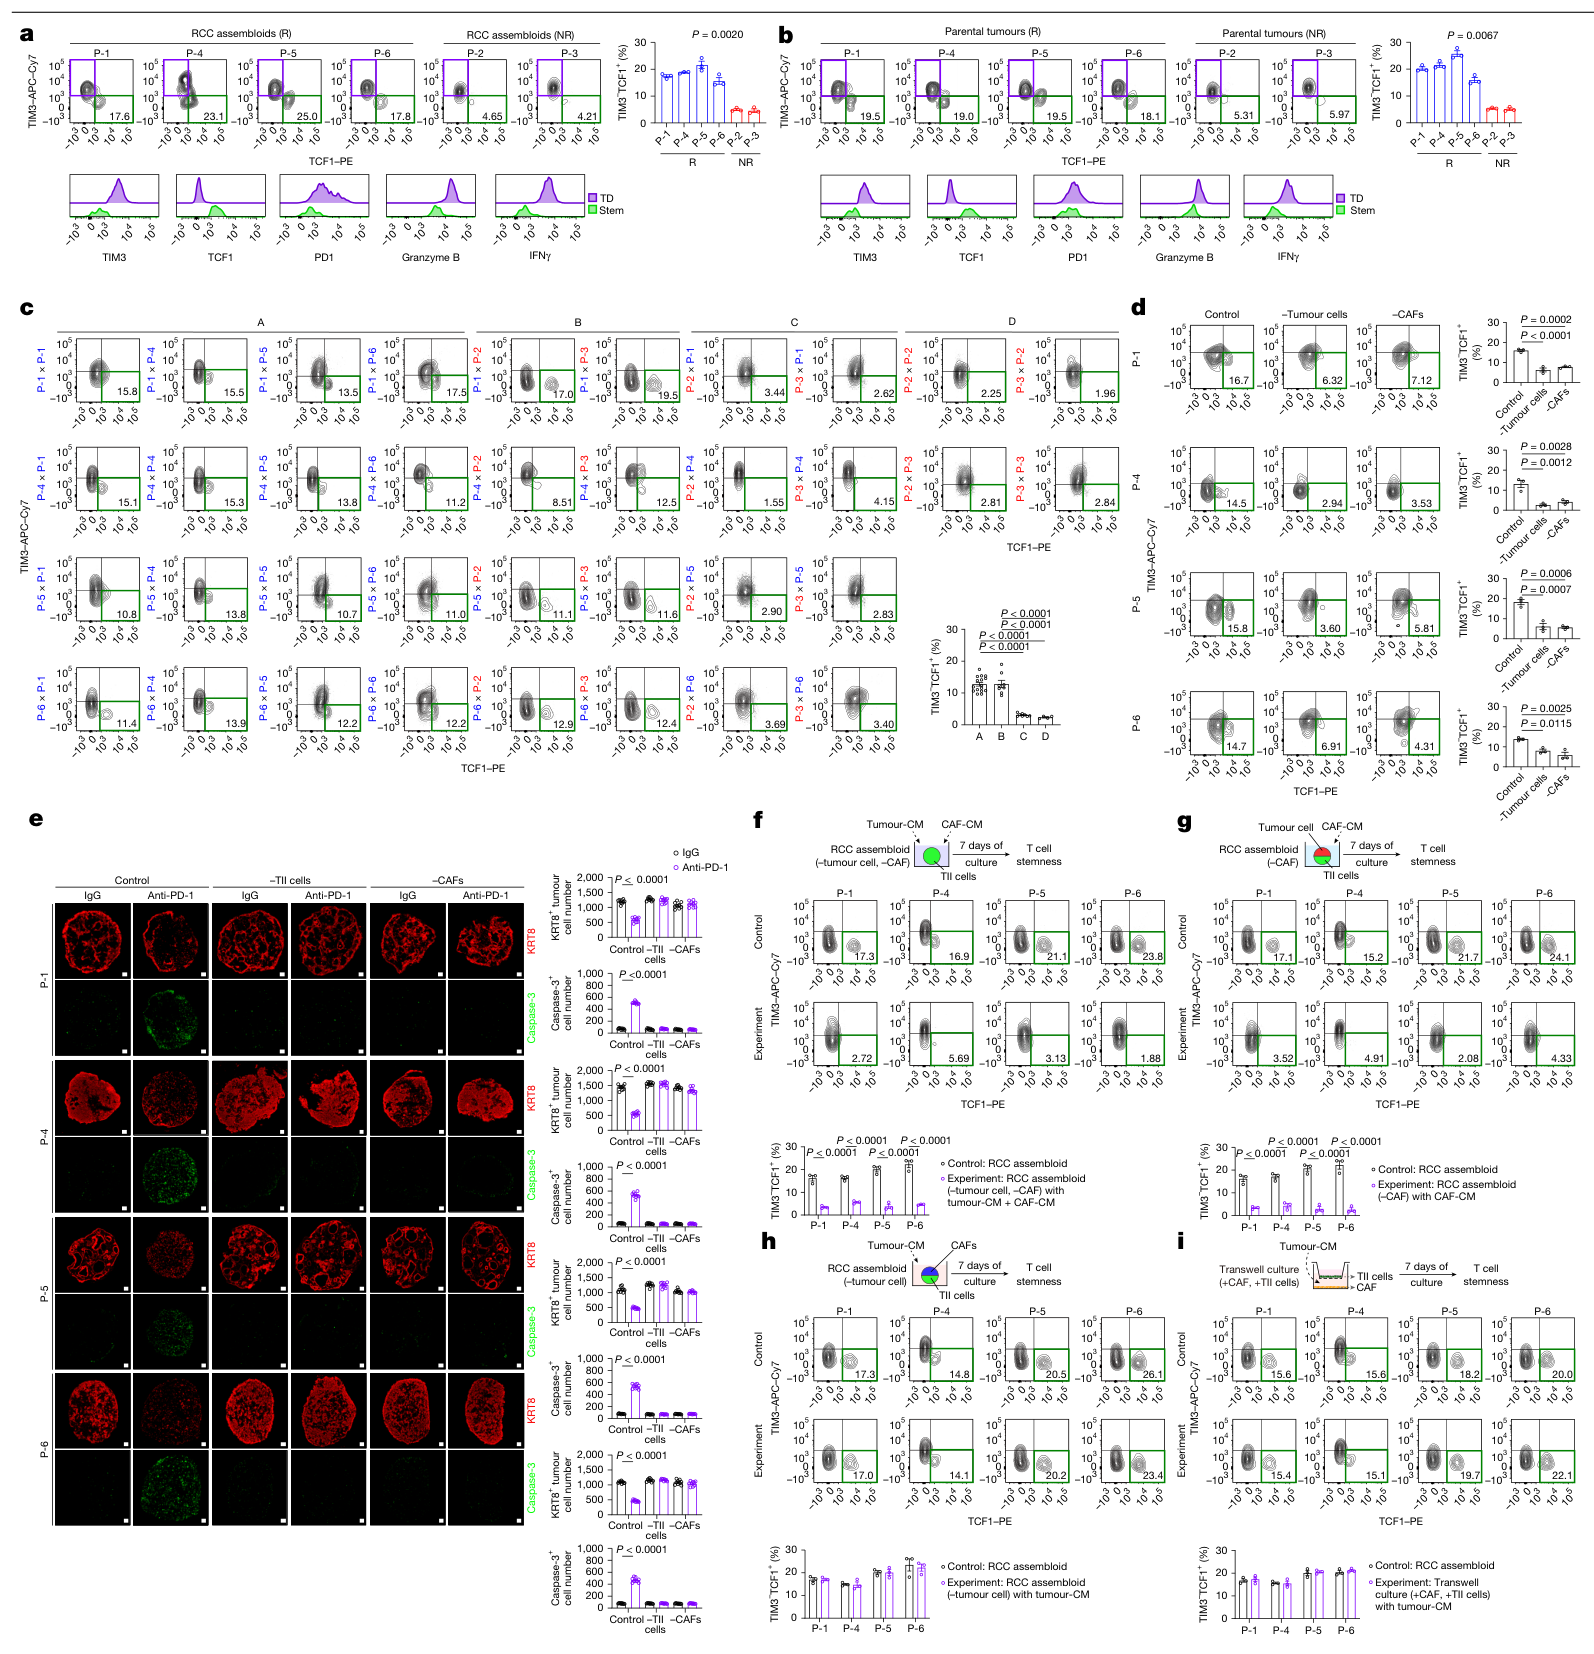
反应者的原肿瘤及组装体中,TIM3⁻TCF1⁺干样CD8⁺ T细胞比例较高。去除这群细胞会削弱模型中的PD-1抗体效应。(图2a、b;扩展图5a)
作者将不同患者来源的浸润免疫细胞与肿瘤细胞、CAF交叉组合。来自非反应者的T细胞,在反应者来源的肿瘤—CAF环境中能够维持较高干样比例;反方向的组合则较低。进一步去除肿瘤细胞或CAF,均会损失这一维持效应。谱系标记结果主要支持原有干样细胞的维持和扩增。(图2c–e;扩展图5b–f)
单独把肿瘤和CAF各自的条件培养液混合,不能充分替代完整体系;让CAF先接受肿瘤来源信号后,即使与免疫细胞隔着Transwell,仍能支持干样群体。这支持具有先后顺序的可溶性信号交流。(图2f–i)
图2c的n=48、24、24、12分别来自不同来源组合及每组合3个组装体,而非相同数量的独立患者。
WNT2B通过CAF的activin A支持干样群体
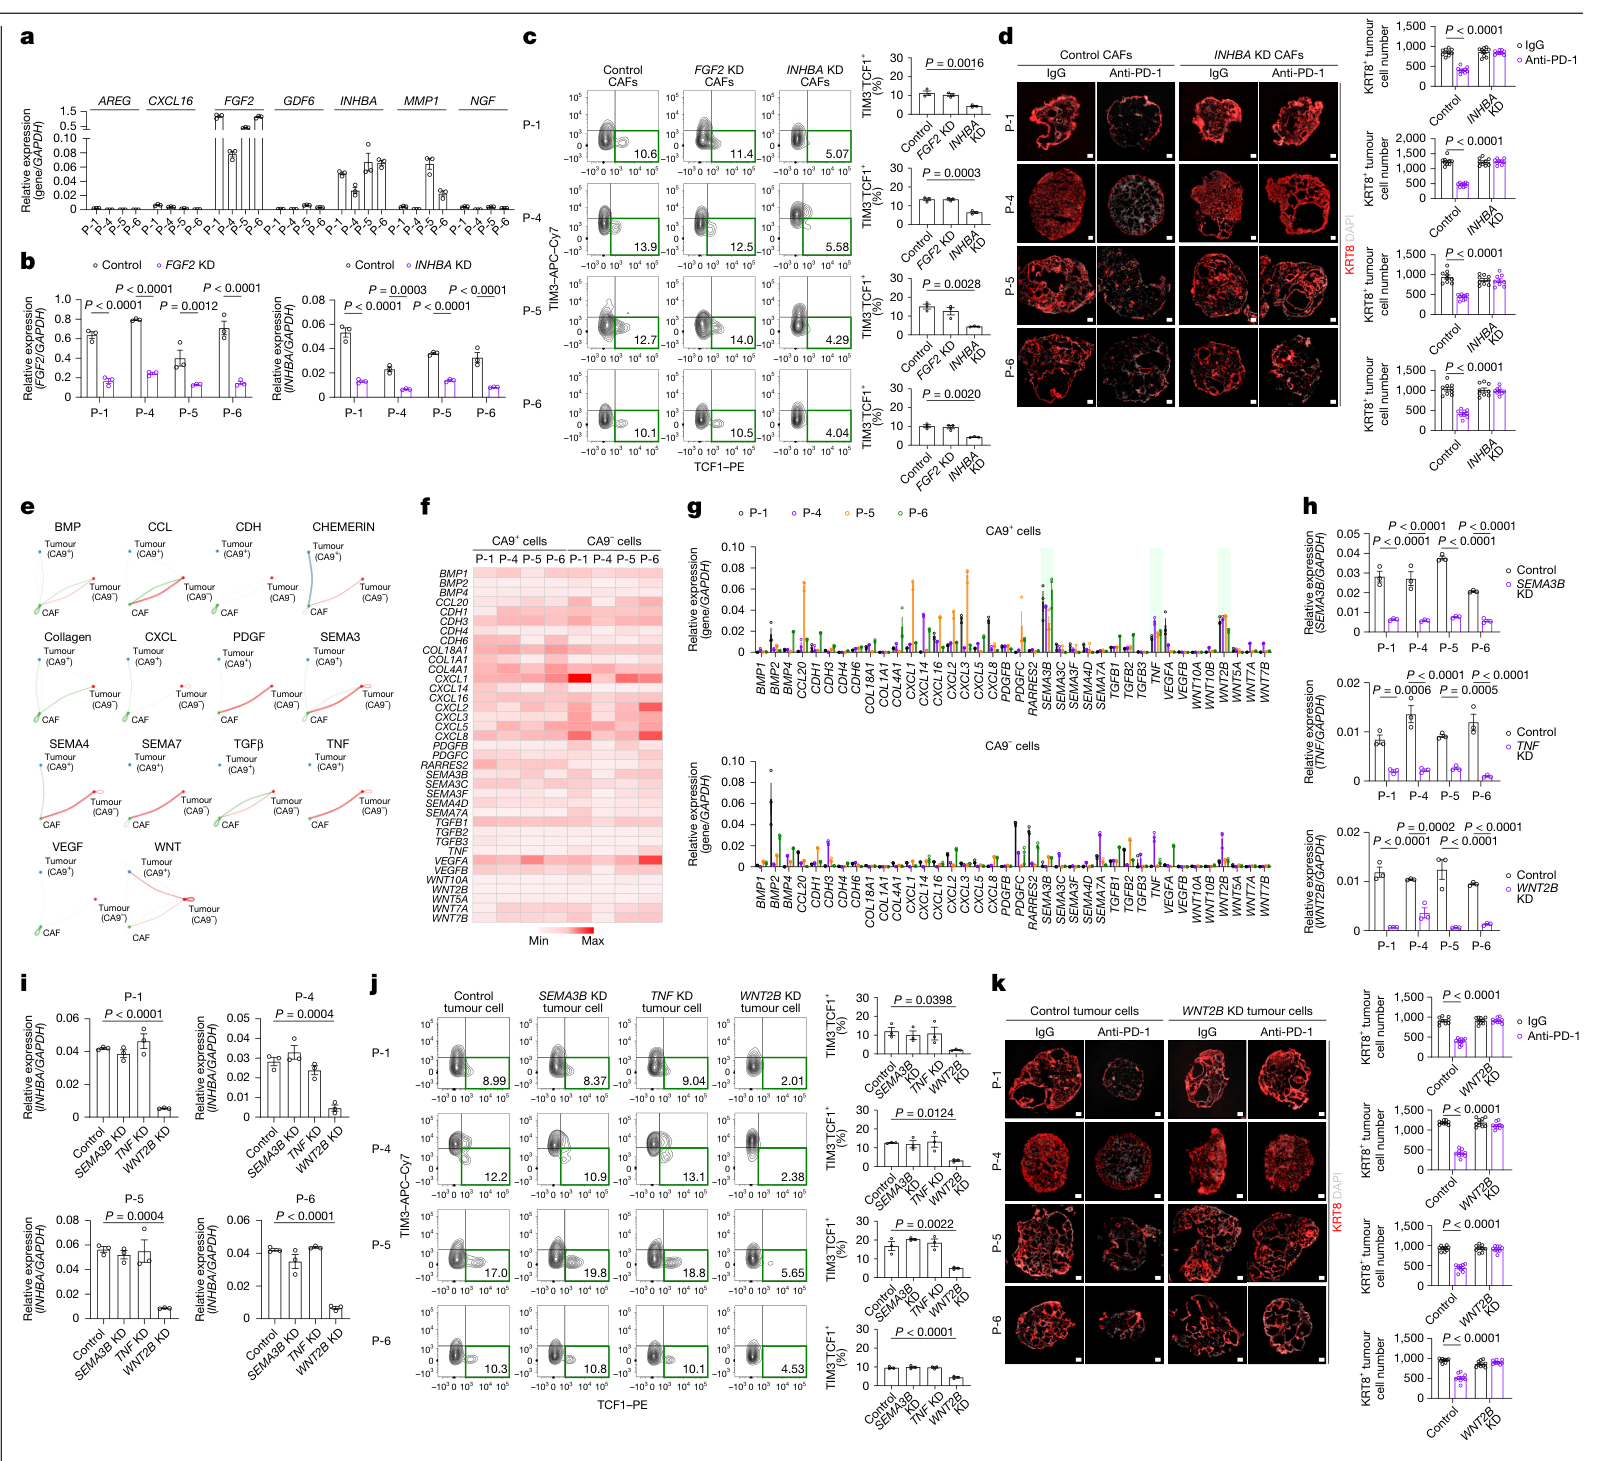
作者在肿瘤细胞存在时被诱导的CAF分泌因子中,进一步检验FGF2和INHBA。INHBA编码activin A的βA亚基:敲低CAF中的INHBA后,干样CD8⁺ T细胞减少,模型对PD-1抗体的反应减弱;FGF2敲低未产生相同效应。(图3a–d)
补回干样T细胞后,若CAF仍缺乏INHBA,这一群体难以持续维持;补充activin A可改善相应表型。结果把CAF来源因子、干样细胞维持与治疗反应连接起来。(扩展图5m、n)
在肿瘤来源候选信号中,作者聚焦WNT2B。敲低肿瘤细胞WNT2B,降低CAF的INHBA表达、干样T细胞比例及PD-1抗体效应;SEMA3B或TNF敲低未产生相同的变化。(图3e–k)
候选来自转录组、NicheNet和CellChat辅助筛选;补充数据5的首轮分泌因子筛选采用未校正P值,7个候选均未达到FDR<0.05。其后的独立功能干预构成这条路径的主要支持。
非反应者CAF对WNT的响应不足
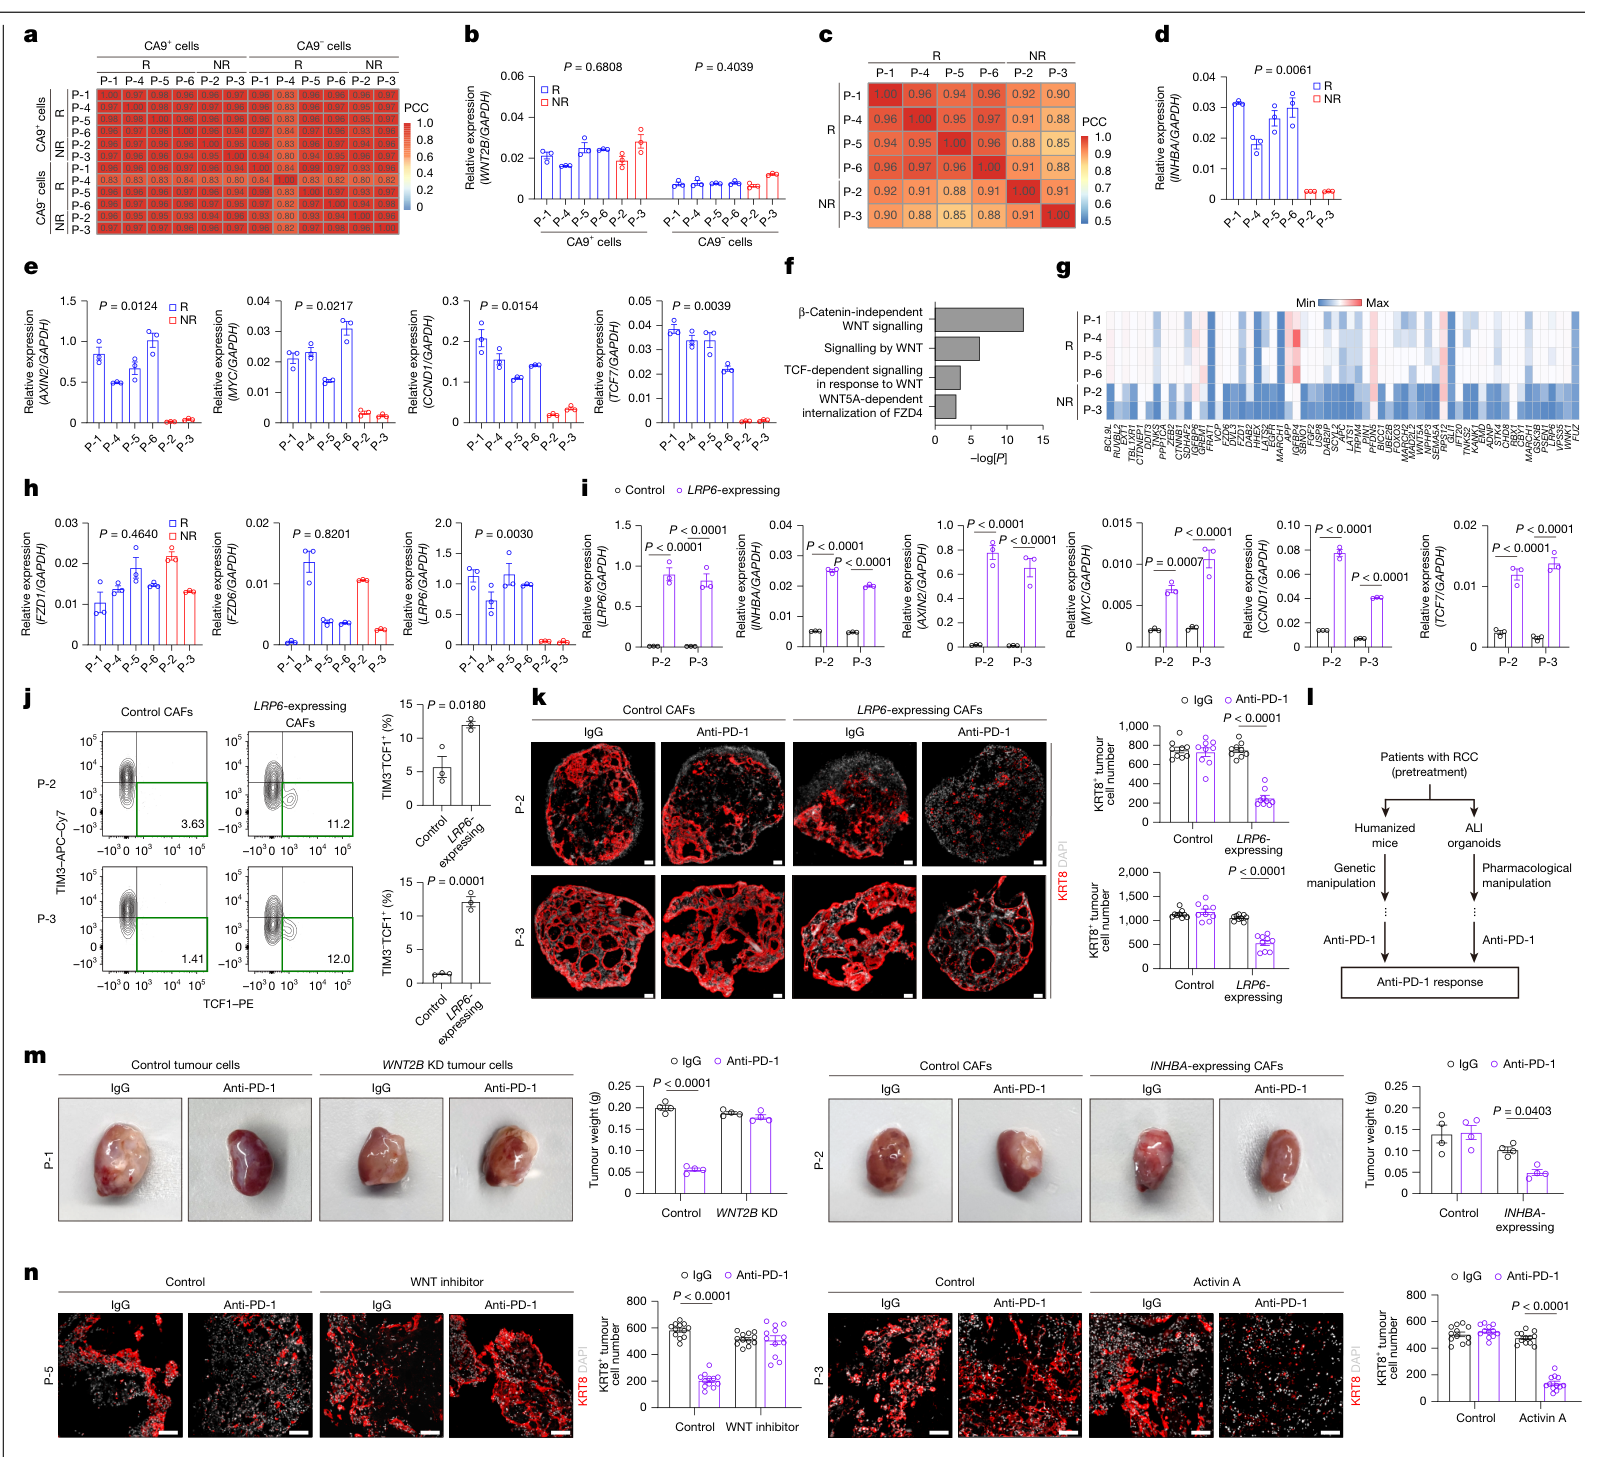
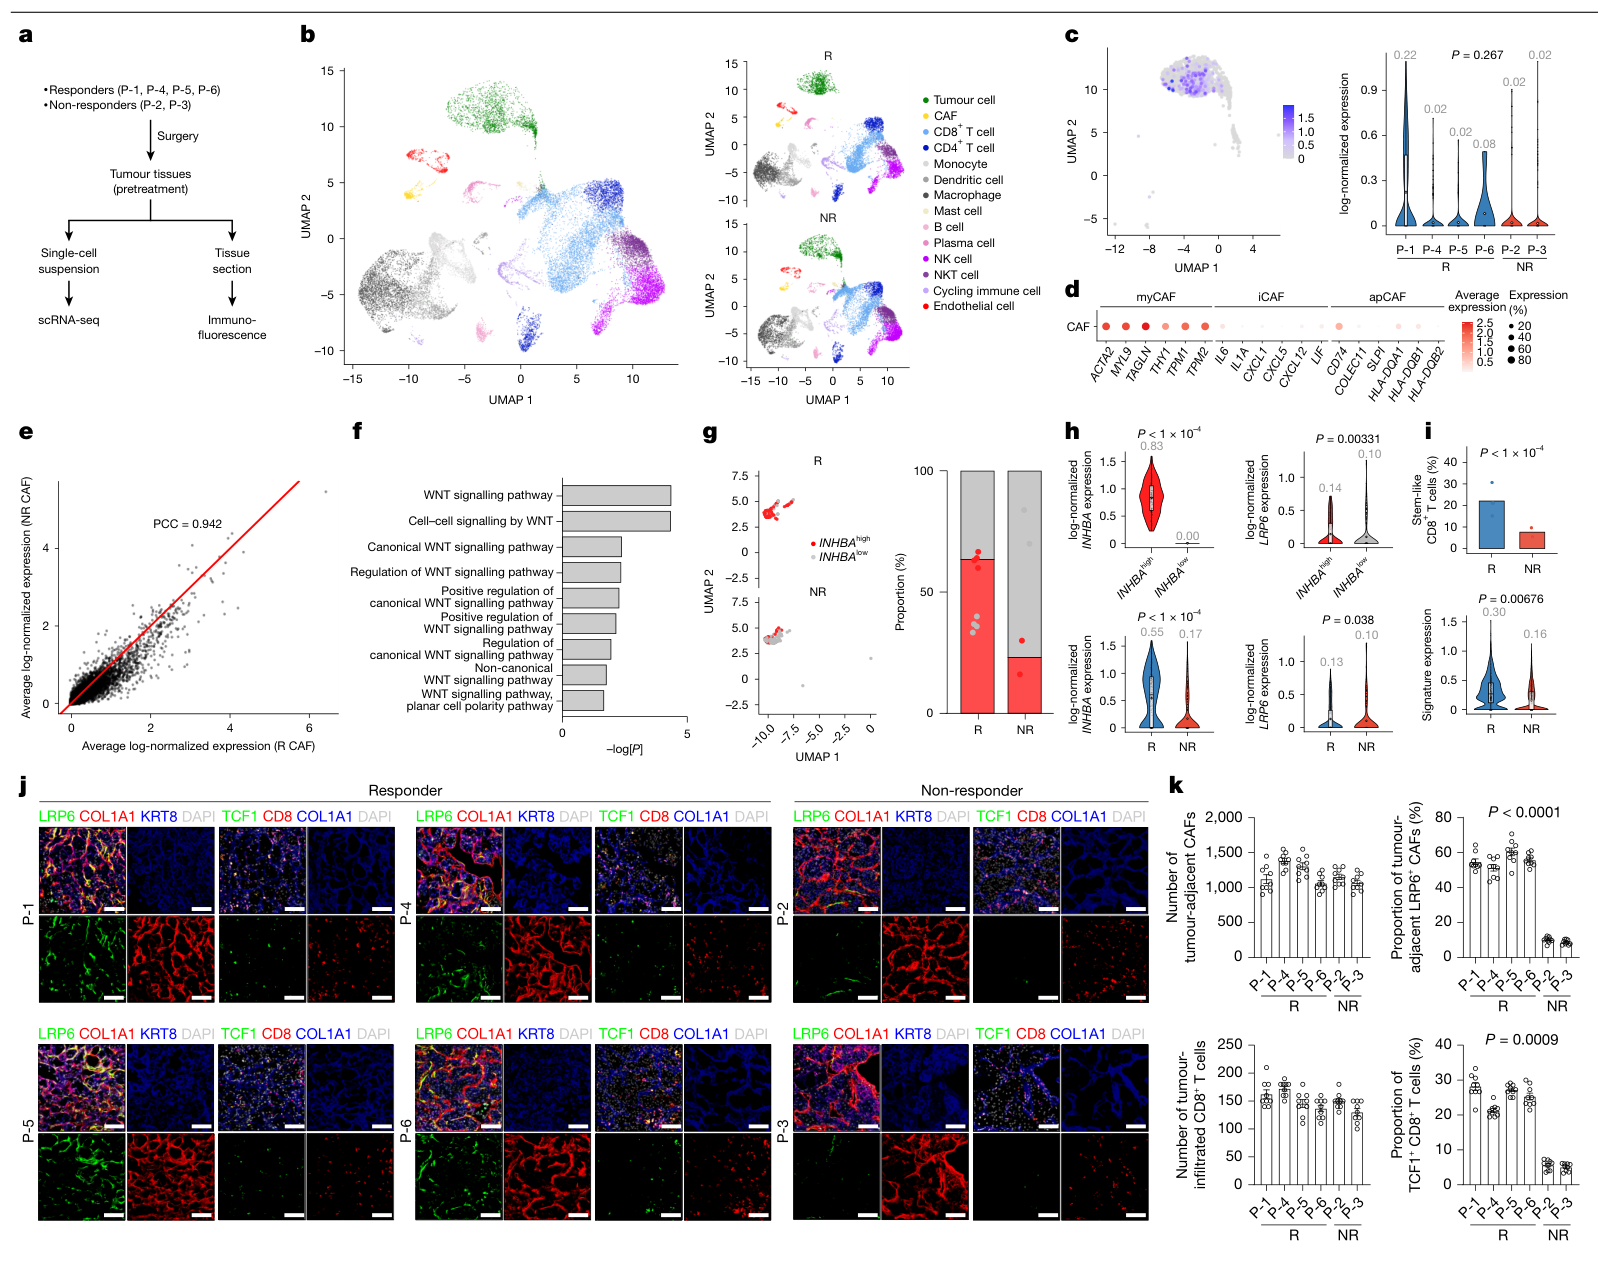
反应者与非反应者的肿瘤WNT2B表达相近,差异集中到CAF。非反应者CAF中INHBA和WNT靶基因较低;候选受体和调节分子比较后,作者关注WNT共受体LRP6。(图4a–h)
提高非反应者CAF的LRP6表达,可恢复WNT靶基因和INHBA表达,增加组装体中的干样CD8⁺ T细胞,并增强PD-1抗体相关杀伤。这组回补说明,CAF能否接收肿瘤信号,是所测模型中的一个功能环节。(图4i–k)
作者用另外两类模型检验路径:
- 患者匹配的人源化小鼠:反应者P-1肿瘤细胞WNT2B敲低后,PD-1抗体作用减弱;非反应者P-2使用表达INHBA的CAF后,PD-1抗体作用增强。肿瘤重量每组4只小鼠,伴随干样群体相应变化。(图4m;扩展图6)
- 气液界面(ALI)类器官:P-5模型中WNT抑制剂削弱PD-1抗体效应,P-3模型中activin A补充改善相应效应。各组为3个类器官、每个3张切片,n=9为切片层级。(图4n)
人体组织中的数量、状态与空间关系
在构建组装体的同一6例患者中,单细胞和组织染色显示:两组CAF总量、CD8⁺ T细胞浸润及肿瘤WNT2B水平相近,而反应者肿瘤旁LRP6⁺ CAF和TCF1⁺CD8⁺ T细胞比例较高。图5k每位患者分析3张切片、每张3个区域,比较采用嵌套检验。(图5;扩展图7)
独立材料提供了进一步关联支持:
| 检验材料 | 患者构成 | 主要观察 |
|---|---|---|
| 独立单细胞队列 | 8例,6反应者、2非反应者 | 反应者CAF的INHBA/LRP6及CD8干样特征较高 |
| 公开Visium空间数据 | 2例,1反应者、1非反应者 | WNT2B⁺肿瘤旁CAF状态及干样T细胞的空间差异 |
| 独立GeoMx队列 | 6例,3反应者、3非反应者 | 反应者myCAF区域INHBA及WNT相关转录信号较高 |
空间分析中的“8例”由Visium 2例与GeoMx 6例组成。原始6例的单细胞和染色是同一批患者的不同检测。(PDF第9页;扩展图8;补充数据1、11)
局限与待解问题
- 核心功能研究只有6例患者来源,其中非反应者2例;临床方案、疾病阶段及反应定义并不完全一致。模型与临床分组的吻合尚需前瞻性、独立且方案一致的验证。
- CA9⁻组分可能混有非肿瘤上皮,培养也会选择性扩增某些细胞;其他免疫细胞、血管及长期微环境演变尚未被完整重建。(PDF第10页)
- 跨患者组合涉及HLA不匹配。作者在审稿回复中补充的基线T细胞活化与细胞毒性分析未见显著增加,降低了这一担忧;抗原特异性和克隆层面的贡献仍需更直接的验证。(Peer Review File,第28–30页)
- LRP6低CAF为何富集、activin A如何直接维持T细胞干样程序,以及这条路径与其他维持信号的相对贡献仍待展开。正常成纤维细胞亚群随机扩增是作者提出的解释,尚未经过谱系追踪。
- 跨癌种数据属于探索性转录关联。部分分组本身使用INHBA、LRP6和T细胞干样指标,分组后的这些指标差异不构成独立验证;治疗队列也经过WNT表达筛选。(扩展图9;Methods,第17页)
- 作者提出activin A在冷、热肿瘤或不同阶段可能发挥不同作用,本文未直接比较这一转换。恢复activin A或LRP6的患者疗效与全身影响尚待专门研究;小鼠实验随机分组,但未盲法评估。(PDF第10、12页)
新线索
本文的一个有用区分是:T细胞“进入肿瘤”与“在局部保持可扩增、可响应的状态”需要不同的微环境支持。沿此思路,CAF研究可以进一步比较其维持免疫细胞状态的功能,而不只按数量或单一标志物判断作用。对于临床分层,值得检验的是肿瘤旁CAF状态、干样CD8⁺ T细胞及空间关系能否在既有指标之外提供额外信息。
相关原始研究:Creation of bladder assembloids mimicking tissue regeneration and cancer,Nature,2020,是本文所用组装体方法的前序研究。本次核实题名与摘要,未独立全文精读。
主图与表格 · 5 张
图1 · PDF 第 3 页
Fig. 1 | Generation of patient-specific RCC assembloids that recapitulate therapeutic responses to ICIs. a,b, Representative immunofluorescence (a) and haematoxylin and eosin (H&E)-stained (b) images from a time-course analysis of patient-derived RCC assembloid formation in comparison to corresponding parental tumours from six patients (P-1 to P-6). Scale bars, 100 μm. c, Heatmap showing pairwise similarity between RCC assembloids (A) and their corresponding parental tumours (T) based on somatic mutation profiles. d, Proportion of shared and unique mutations in each patient-derived pair. e, Uniform manifold approximation and projection (UMAP) plots showing major cell populations identified by scRNA-seq in RCC assembloids and corresponding parental tumours from six patients. f, Dot plots showing the expression of selected marker genes for each cell type. g, Cell-type composition of RCC assembloids and matched parental tumours across six patient pairs. h, Pairwise comparison of cell-type proportions between RCC assembloids and matched parental tumours for each patient pair. i, Cell-type-specific transcriptomic similarity between RCC assembloids and their matched parental tumours. Detailed methods for these analyses are provided in the Methods. j, Representative immunofluorescence images of RCC assembloids treated with isotype control IgG or anti-PD-1. Scale bars, 100 µm. k,l, Quantification of cleaved caspase-3+ cells (k) and the proportion of cleaved caspase-3+ cells (l) in the indicated cell types following IgG or anti-PD-1 treatment. Three biologically independent assembloids per group were analysed, with three sections analysed per assembloid (n = 9). m, Summary of the clinical responses of patients with RCC to ICI therapy and corresponding responses in assembloids to anti-PD-1. Statistics: paired Wilcoxon signed-rank test with Benjamini–Hochberg false discovery rate (FDR) correction (g) or two-way analysis of variance (ANOVA) followed by Sidak’s multiple-comparison test (k,l); data show the mean ± s.e.m. (k,l). HVGs, highly variable genes; R, responder; NR, non-responder; NED, no evidence of disease; PD, progressive disease; PR, partial response; SD, stable disease.
图2 · PDF 第 4 页
Fig. 2 | Non-T cell-autonomous maintenance of CD8+ T cell stemness, mediated through a tumour–CAF–CD8+ T cell crosstalk, is required for anti-PD-1 responsiveness. a,b, Top, flow cytometry analyses (left) and quantification (right) of stem-like T cells in RCC assembloids (a) and parental tumours (b) from responders and non-responders. Bottom, expression profiles of exhaustion and effector markers in terminally differentiated (TD) and stem-like (Stem) T cell subsets from P-2. For a, three biologically independent assembloids were analysed per patient (n = 3); for b, three biologically independent samples were analysed per patient (n = 3). c, Flow cytometry analyses of stem-like T cells in four mix-and-match RCC assembloids (A–D) (Extended Data Fig. 5b). Blue, responder; red, non-responder. Three biologically independent assembloids were analysed per group (A, n = 48; B, n = 24; C, n = 24; D, n = 12). d, Flow cytometry analyses of the proportion of stem-like T cells in combinatorial RCC assembloids from responders. Three biologically independent assembloids were analysed per group (n = 3). e, Anti-PD-1 responses in combinatorial RCC assembloids from responders. Three biologically independent assembloids were analysed per group, with three sections analysed per assembloid (n = 9). Scale bars, 100 µm. f–i, Top, schematic of the experiment. Bottom, flow cytometry plots and bar graphs show the proportion of stem-like T cells. Three biologically independent assembloids were analysed per group (n = 3). f, RCC assembloids lacking tumour cells and CAFs were cultured for 7 days in the presence of tumour-CM and CAF-CM. g, RCC assembloids lacking CAFs were cultured for 7 days in the presence of CAF-CM. h, RCC assembloids lacking tumour cells were cultured for 7 days in the presence of tumour-CM. i, CAFs and TII cells were cultured in a Transwell system, with CAFs in the bottom chamber treated with tumour-CM and TII cells cultured in the top Transwell insert. Statistics: two-tailed nested t-test (a,b), one-way ANOVA followed by Tukey’s multiple-comparison test (c,d) or two-way ANOVA followed by Sidak’s multiple-comparison test (e–i); data show the mean ± s.e.m. (a–i).
图3 · PDF 第 5 页
Fig. 3 | Identification of a WNT–activin A–T cell stemness axis in tumour– CAF–CD8+ T cell interactions. a, Relative expression of candidate genes in CAFs isolated from tumour tissue samples of four responders. Three technical replicates were analysed per group (n = 3). b, Relative expression of FGF2 in control and FGF2 KD CAFs and INHBA in control and INHBA KD CAFs from responders. Three biologically independent samples were analysed per group (n = 3). c, Proportion of stem-like T cells in RCC assembloids reconstituted with control CAFs, FGF2 KD CAFs or INHBA KD CAFs from responders. Three biologically independent assembloids were analysed per group (n = 3). d, Anti- PD-1 responses in RCC assembloids reconstituted with control or INHBA KD CAFs from responders. Three biologically independent assembloids were analysed per group, with three sections analysed per assembloid (n = 9). Scale bars, 100 μm. e, Predicted tumour–CAF signalling networks based on transcriptomic profiles of tumour cells and CAFs. Networks involving tumour cell–CAF interactions are shown. f, Heatmap showing expression of candidate genes in tumour cells from responders as determined by RNA-seq. g, Relative expression of candidate genes in CA9+ and CA9− cells isolated from tumour tissue samples of responders. Three technical replicates were analysed per group (n = 3). h, Relative expression of SEMA3B, TNF and WNT2B in control and candidate-gene KD tumour cells from responders. Three biologically independent samples were analysed per group (n = 3). i, Relative expression of INHBA in CAFs reconstituted with candidate-gene KD tumour cells from responders. Three biologically independent assembloids were analysed per group (n = 3). j, Proportion of stem-like T cells in RCC assembloids reconstituted with control tumour cells, SEMA3B KD tumour cells, TNF KD tumour cells or WNT2B KD tumour cells from responders. Three biologically independent assembloids were analysed per group (n = 3). k, Anti-PD-1 responses in RCC assembloids reconstituted with control or WNT2B KD tumour cells from responders. Three biologically independent assembloids were analysed per group, with three sections analysed per assembloid (n = 9). Scale bars, 100 μm. Statistics: two-way ANOVA followed by Sidak’s multiple-comparison test (b,d,h,k) or one-way ANOVA followed by Tukey’s multiple-comparison test (c,i,j); data show the mean ± s.e.m. (a–d,g–k).
图4 · PDF 第 7 页
Fig. 4 | Identification of tumoural WNT-unresponsive CAFs that confer resistance to anti-PD-1 therapy. a, Heatmap showing transcriptomic profiles of CA9+ and CA9− cells from responders and non-responders. b, Relative expression of WNT2B in CA9+ and CA9− cells from responders and non-responders. Three biologically independent assembloids were analysed per group (n = 3). c, Heatmap showing transcriptomic profiles of CAFs from responders and non-responders. d, Relative expression of INHBA in CAFs from responders and non-responders. Three biologically independent assembloids were analysed per group (n = 3). e, Relative expression of WNT target genes in CAFs from responders and non-responders. Three biologically independent assembloids were analysed per group (n = 3). f, Differential pathway analysis of CAFs between responders and non-responders, highlighting WNT-related pathways. g, Heatmap of WNT pathway-associated DEGs in CAFs from responders and non-responders. h, Relative expression of key WNT pathway regulator genes in CAFs isolated from tumour tissues of responders and non-responders. Three technical replicates per group were analysed (n = 3). i, Relative expression of LRP6, INHBA and WNT target genes in control and LRP6-expressing CAFs from non-responders. Three biologically independent assembloids were analysed per group (n = 3). j, Proportion of stem-like T cells in RCC assembloids reconstituted with control CAFs or LRP6-expressing CAFs from non-responders. Three biologically independent assembloids were analysed per group (n = 3). k, Anti-PD-1 responses in RCC assembloids reconstituted with control or LRP6-expressing CAFs from non-responders. Three biologically independent assembloids were analysed per group, with three sections analysed per assembloid (n = 9). Scale bars, 100 µm. l, Experimental design for evaluating anti-PD-1 responses in humanized mice and ALI organoids derived from patients with RCC (responders and non-responders). m, Anti-PD-1 responses in humanized mice with responder (P-1) tumours (left) or non-responder (P-2) tumours (right). Four mice were analysed per group (n = 4). n, Anti-PD-1 responses in ALI organoids from a responder (P-5) (left) and a non-responder (P-3) (right). Three biologically independent organoids were analysed per group, with three sections analysed per organoid (n = 9). Scale bars, 100 µm. Statistics: two-tailed nested t-test (b,d,e,h), one-sided Fisher’s exact test, with FDR correction for multiple comparisons (f), two-way ANOVA followed by Sidak’s multiple-comparison test (i,k,m,n) or unpaired two-tailed t-test (j); data show the mean ± s.e.m. (b,d,e,h–k,m,n).
图5 · PDF 第 8 页
Fig. 5 | Single-cell and spatial analyses of patient tumours reveal a WNT– activin A–T cell stemness axis and WNT-unresponsive CAF subsets associated with anti-PD-1 responses. a, Schematic for analysing pretreatment tumour tissue samples from responders and non-responders. b, UMAP plots showing major cell populations identified in patients with RCC (left; n = 6) and split into responders (n = 4) and non-responders (n = 2) (right). c, UMAP plot (left) and violin plot (right) showing WNT2B expression levels in tumour cells from responders (n = 4) and non-responders (n = 2). d, Dot plot showing expression of canonical marker genes for CAF subtypes. e, Pearson’s correlation coefficient (PCC) of average CAF gene expression profiles between responders and non- responders. f, Differential pathway analysis of CAFs from responders and non- responders, based on DEGs upregulated in responders, highlighting enrichment of WNT-related pathways. g, UMAP plots (left) and bar plot (right) of CAFs from responders and non-responders. h, Top, violin plots showing INHBA and LRP6 expression in CAFs stratified by INHBA expression status from patients with RCC (n = 6). Bottom, violin plots of INHBA and LRP6 expression in CAFs from responders (n = 4) and non-responders (n = 2). i, Bar plot showing the proportion of stem-like CD8+ T cells among total CD8+ T cells (top) and violin plot showing stem-like CD8+ T cell signature scores in CD8+ T cells (bottom) in responders (n = 4) and non-responders (n = 2). j, Representative immunofluorescence images of tumour tissue samples from responders and non-responders. Scale bars, 100 μm. k, Quantification of tumour-adjacent CAFs (COL1A1+ cells located within 50 µm of KRT8+ tumour cells), the proportion of LRP6+ CAFs among tumour-adjacent CAFs, tumour-infiltrating CD8+ T cells (CD8+ cells located within 50 µm of KRT8+ tumour cells) and the proportion of TCF1+ CD8+ T cells among total tumour-infiltrating CD8+ T cells. All measurements were calculated per unit area (mm2). Three regions per section were analysed, with three sections analysed per patient (n = 9). Statistics: two-tailed Welch’s t-test (c,i (bottom)), one-sided Fisher’s exact test, with FDR correction for multiple comparisons (f), two-sided Wilcoxon rank-sum test (h), Fisher’s exact test (i, top) or two-tailed nested t-test (k). For box plots (c,h,i), centre lines indicate medians, box limits indicate the interquartile range and whiskers extend to the most extreme data points within 1.5× the interquartile range. Data show the mean ± s.e.m. (k).
完整阅读记录与证据表
文献卡:肾癌组装体中的WNT–CAF–T细胞联系
- Paper ID:p-0043-art-tumour-assembloids-recapitulate-tumour。
- 分析日期:2026-11-03;article-read、morning-report、pdf、spreadsheets、web-publish。
- 原文:Nature,在线发表于2026-10-28;DOI 10.1038/s41586-026-11208-w。用户PDF仍为带“Published online xx xx xxxx”的排版版本,未自行补造卷期页码。
- 读取范围:40页主PDF中的科研正文、Methods、5主图10扩展图及完整图注、5页Reporting Summary;补充指南4页、8个普通短表页签全文、10份57页签Source Data只读提取并定点核查。组学长表只查结构、表头及所列短页签,历史审稿定点阅读,详见coverage.md。
- 晨会日期2026-11-05,接收/分析日期2026-11-03。
- human_review=pending;图表见figures/README.md,30 PNG,网页选5主图。
一句话结论
六例患者来源肾癌组装体中的干预实验支持,肿瘤WNT2B经CAF的LRP6–activin A维持干样CD8⁺ T细胞,影响模型对PD-1阻断的反应;人体独立队列提供状态与空间关联支持。
研究问题与背景
研究聚焦有T细胞浸润但免疫治疗反应不同的透明细胞肾癌,考察多细胞交流是否影响T细胞保持可响应治疗的状态。组装体将同一患者的CA9⁺/CA9⁻上皮细胞、CAF及肿瘤浸润免疫细胞分开维持后重组,允许单组分替换和遗传干预。
贡献与比较对象
平台比较包括原肿瘤和匹配组装体的形态、突变、细胞组成及转录相似性;功能比较包括反应者/非反应者来源细胞互换、组分去除、INHBA或WNT2B敲低、LRP6回补,以及不同患者来源的人源化小鼠和ALI类器官。本文从微环境对干样群体的维持解释模型药效差异,预测性能的独立临床验证尚未完成。
方法与验证
| 层次 | 来源/设计 | 对应问题 |
|---|---|---|
| 核心模型 | 6例透明细胞RCC,4临床反应者/2非反应者;自体多组分重组7天,再抗PD-1或IgG 7天 | 模型重现主要组成及反应表型 |
| 组分和机制 | 36种来源组合及去除、条件培养、敲低/回补、干样细胞补入 | 哪些细胞和信号维持干样CD8群体 |
| 补充功能模型 | P-1/P-2匹配人源化小鼠;P-5/P-3 ALI类器官 | 所测路径在其他模型中的一致性 |
| 人体材料 | 核心6例scRNA/IHC;独立8例scRNA;2例公开Visium+6例GeoMx | 状态和空间关联,分别计数 |
| 跨癌种探索 | 筛选后的TCGA、ICI bulk及scRNA公共队列 | 在特定WNT表达背景下的关联线索 |
核心证据
| 主张或结果 | 数字、单位、条件 | PDF页序/图表或源表 | 依据类型 | 核对状态 |
|---|---|---|---|---|
| 组装体保留主要组织特征 | 6患者匹配突变/scRNA;CA9⁻长培养易偏移,CA9⁺主体保留 | 主PDF1–3图1a–i;扩展图1–4,19–25 | 原图、正文、方法 | 已核;保留正常上皮混杂限制 |
| 模型反应与临床标签对应 | 4R:P-1/4/5/6,2NR:P-2/3;图1凋亡n9=3组装体×3切片 | 图1j–m,PDF3;Source Data 01 | 原图及源表 | 已核;不称100%预测准确率 |
| 临床治疗及终点并不单一 | 5例aPD1+aCTLA4;P-5术后辅助aPD1、NED;P-1/4/6为PR;P-2 SD、P-3 PD | Supplementary Data 1,Patient info A1:L7 | 原始XLSX逐行读取 | 已核;未合并为单药ORR |
| 干样群体与反应相关 | TIM3⁻TCF1⁺CD8,4R/2NR;去除该群体减少模型药效 | 图2a/b;ED5a,PDF27 | 原图、图注、正文 | 已核;并非全部抑制受体阴性 |
| 微环境改变干样维持 | 跨来源组合,A/B/C/D n48/24/24/12=组合×3组装体;肿瘤和CAF均需保留 | 图2c–e,PDF4;ED5b–f | 原图及图注 | 已核;患者数与组合数分开 |
| 既有干样群体的维持/扩增 | SLAMF6分选并染料示踪,原干样细胞贡献为主 | ED5d–f,PDF26–27 | 原图及图注 | 已核;未称去分化为已证实机制 |
| 顺序性可溶信号足以支持 | 独立CM混合不足;肿瘤CM预处理CAF可在Transwell隔开后支持T细胞;每患者每组3组装体 | 图2f–i;Source Data02,Fig2i | 原图、正文、源表 | 已核;未写物理直接接触必要 |
| CAF INHBA有功能作用 | INHBA KD损失干样及抗PD-1效应,FGF2 KD阴性;activin A补充支持维持 | 图3a–d;ED5m/n | 原图及图注 | 已核;主要功能支持与初筛分开 |
| WNT2B在肿瘤端参与 | WNT2B KD降低CAF INHBA及干样/药效;SEMA3B、TNF KD无相同效应 | 图3e–k,PDF5–6 | 原图及图注 | 已核 |
| 非反应者CAF响应缺陷 | 两组肿瘤WNT2B相近;CAF INHBA/WNT靶基因/LRP6较低;提高LRP6恢复相关读出和模型药效 | 图4a–k,PDF7;Data8关键WNT页签 | 图、正文、源表 | 已核;LRP6回补在组装体中 |
| 小鼠和ALI补充验证 | P-1 WNT2B KD、P-2 INHBA CAF,各组小鼠n4;P-5 WNT抑制/P-3 activin A,ALI3×3切片 | 图4m/n,ED6;Source Data04 Fig4m | 图、图注、源表 | 已核;小鼠恢复用INHBA CAF而非LRP6 |
| 组织状态差异多于总量差异 | 原6例,CAF/CD8总量NS,邻瘤LRP6 CAF和TCF1 CD8比例升高;每患者3切片×3区域n9,nested t | 图5j/k,PDF8;Source Data05 | 原图、图注、源表 | 已核;50 μm邻域,数量按mm² |
| 独立人体关联 | scRNA8=6R2NR;空间8=公开Visium2(1/1)+GeoMx6(3/3) | PDF9;ED8,31–32;Data1/11 | 原图、正文、原表 | 已核;空间8含GeoMx6 |
| 候选筛选统计范围 | Data5 7候选的FDR0.67–0.797,初筛按未校正P;Data11 GO总体WNT FDR .00584,其他所列分支FDR>.05 | Data5 Secreted factor candidates;Data11 GO | 全部短页签单元格 | 已核;不称全部通过校正 |
| 跨癌种为探索性 | TCGA4类型先筛WNT/hot/CAF,再按INHBA/LRP6/干样聚类;ICI3类型先筛WNT再合成评分;scRNA亦按相关指标分组 | ED9,PDF33–34;Methods17 | 原图及方法 | 已核;分组差异非独立机制验证 |
统计与证据层级
图1/图3/图4的多数组织切片n9来自3组装体×3切片,图4h为每患者3次技术重复;图2a/b与图4b/d/e/h采用嵌套检验,需以患者来源理解外推范围。图5k的9个区域样本嵌套在患者中。Source Data05列出的CAF总量P=.4116、CD8总量P=.3531、LRP6⁺CAF比例P<.0001、TCF1⁺CD8比例P=.0009,与图5k方向一致;未据此重算患者层面的预测性能。
CellChat步骤将bulk样本复制为两个相同“pseudo-cell”用于候选网络推断;该部分不是额外独立单细胞测量。核心信号链的支持主要来自随后的敲低、回补及功能终点。(Methods,PDF16)
局限与待解问题
作者明确指出
- CA9⁻上皮群体缺乏VHL突变,部分无3p缺失,可能含非肿瘤上皮;初始培养选择性扩增影响代表性。
- LRP6低CAF为何富集尚未明确,正常组织亚群随机扩增是解释性假说。
- activin A在冷/热或早/晚期肿瘤中作用转换未在本文直接比较,其他微环境细胞贡献也未完整检验。(主PDF10)
AI推断与理由
- 核心患者6例,治疗方案及NED/PR等标签不同,临床分组与模型单药反应的一致性尚不足以估计前瞻性预测性能。
- 混合供者可能有HLA影响。作者在审稿回复R7补充分析基线Ki67、IFNγ、IL2及肿瘤死亡未见明显增加,提供了部分功能对照;仍需抗原特异性及克隆追踪。未写为作者完全未考虑HLA。(Peer Review File,PDF28–30、40)
- 原始6例和扩展人体队列较小,单细胞数量、切片区域与患者层级不能互换;空间邻近提供关联。
- 外源培养因子及模型扩增会影响免疫状态;activin A对各细胞的直接作用、与IL7/IL15等因子的关系及系统干预效应仍需独立研究。
- 跨癌种部分用拟解释的变量参与聚类;其组间P值应结合筛选与分组方式理解。未将这一分析称为独立临床分类器或泛癌机制确认。
待核对问题与后续阅读
- 原PDF排版发布日期占位,实际日期由Nature期刊页核实;卷期及页码未知保持未知。
- Methods及Reporting Summary称样本为ICI前手术组织;Data1的“Interval between ICI and surgery”只列正数间隔而未注明先后方向。未据间隔自行推断治疗后采样,也未改原表,完整时序可向作者进一步核对。
- RNA、WES、GeoMx原始数据及代码未下载运行,长表的所有基因和统计未逐条复现。原XLSX中个别基因名日期型保留,未逆推修复。
- 相关原始研究:Creation of bladder assembloids mimicking tissue regeneration and cancer,Nature,2020。已核题名与摘要,未独立全文精读。